Key Takeaways
- Candlestick Patterns Capture Short-Term Moves: They reflect immediate price action and sentiment, helping traders spot quick reversals or momentum shifts.
- Chart Patterns Show the Bigger Picture: These form over many candles and highlight broader trends, breakouts, and long-term market behaviour.
- Candlesticks Give Faster Signals: Since they form quickly, they’re useful for short-term entry and exit decisions in active trading.
- Chart Patterns Improve Trend Confidence: Their larger structure helps confirm overall direction and reduces the chances of reacting to noise.
- Combining Both Strengthens Analysis: Using candlestick signals within larger chart patterns gives clearer trade setups and avoids false patterns.
Technical analysis relies heavily on pattern recognition to identify trading opportunities and forecast price movements. Two fundamental tools in this analytical approach are candlestick patterns and chart patterns.
While both serve to decode market behavior, they differ significantly in structure, timeframe, and application.
Understanding these distinctions enables traders to select the appropriate tool for their specific trading objectives.
What is Candlestick Pattern?
Definition and Purpose
Candlestick patterns are visual representations of market sentiment formed by one or more individual candlesticks. Japanese candlesticks had their origins in the centuries-old Japanese rice trade and then made their way into modern-day price charting. Each candlestick encapsulates complete price information for a specific period, displaying the open, high, low, and close values. The distinctive rectangular body and protruding lines (shadows or wicks) create the candle-like appearance that gives these patterns their name.
Visual Advantage
The primary strength of candlestick patterns lies in their ability to convey emotional aspects of trading activity. The size and color of each candle immediately communicate the intensity and direction of price movements, making them more intuitive than traditional bar charts for many traders.
Also Read : Basic Understanding Of Candlestick Charts
Pattern Categories
Candlestick formations fall into two broad categories based on their market implications:
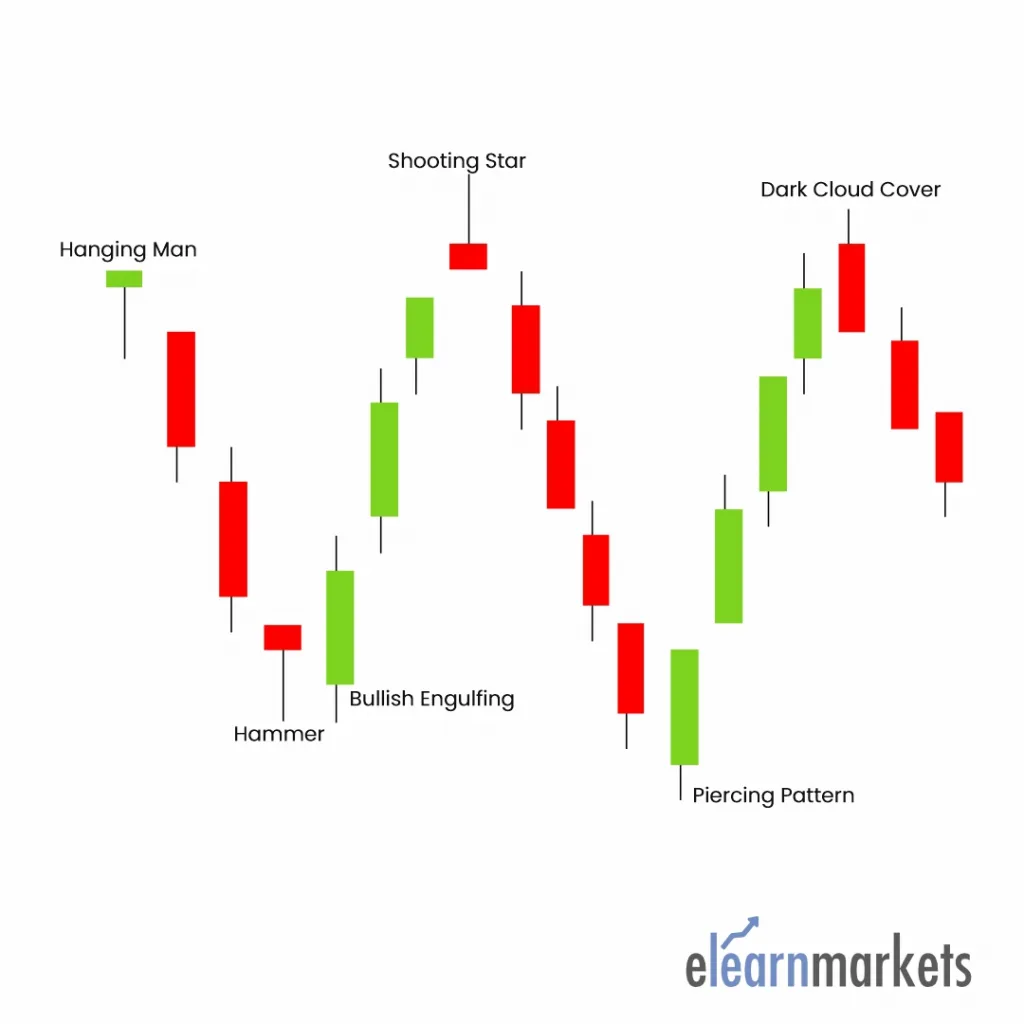
Bullish Patterns suggest potential upward price movement and include:
- Hammer: A reversal signal appearing after downtrends
- Bullish Engulfing: A larger green candle completely encompassing the previous red candle
- Morning Star: A three-candle formation indicating trend reversal from bearish to bullish
- Piercing Line: A two-candle pattern showing buying pressure overcoming selling
- Three White Soldiers: Three consecutive strong green candles signaling sustained upward momentum
Bearish Patterns indicate potential downward price movement and include:
- Hanging Man: A warning sign appearing at the top of uptrends
- Shooting Star: A reversal pattern with a long upper shadow
- Dark Cloud Cover: A bearish reversal pattern after an uptrend
- Evening Star: A three-candle formation signaling trend change from bullish to bearish
- Three Black Crows: Three consecutive strong red candles indicating sustained downward pressure
Temporal Characteristics
Candlestick patterns typically manifest over brief periods, ranging from a single trading session to just a few days. This short-term nature makes them particularly valuable for traders seeking immediate entry and exit signals. The patterns represent tendencies rather than certainties, requiring confirmation from subsequent price action or complementary technical indicators.
What is Chart Pattern?
Definition and Foundation
Chart patterns emerge from extended price movements that create recognizable geometric shapes on price charts. These formations develop as the collective result of market psychology and fundamental factors interacting over longer timeframes. Chart patterns serve as a comprehensive pictorial record of the ongoing contest between buying and selling forces.
Strategic Framework
Chart patterns provide traders with a structured framework for analyzing historical battles between bulls and bears. More importantly, they help identify which side currently maintains control, allowing market participants to position themselves advantageously. This broader perspective makes chart patterns suitable for both short-term tactical decisions and long-term strategic planning.
Common Chart Formations
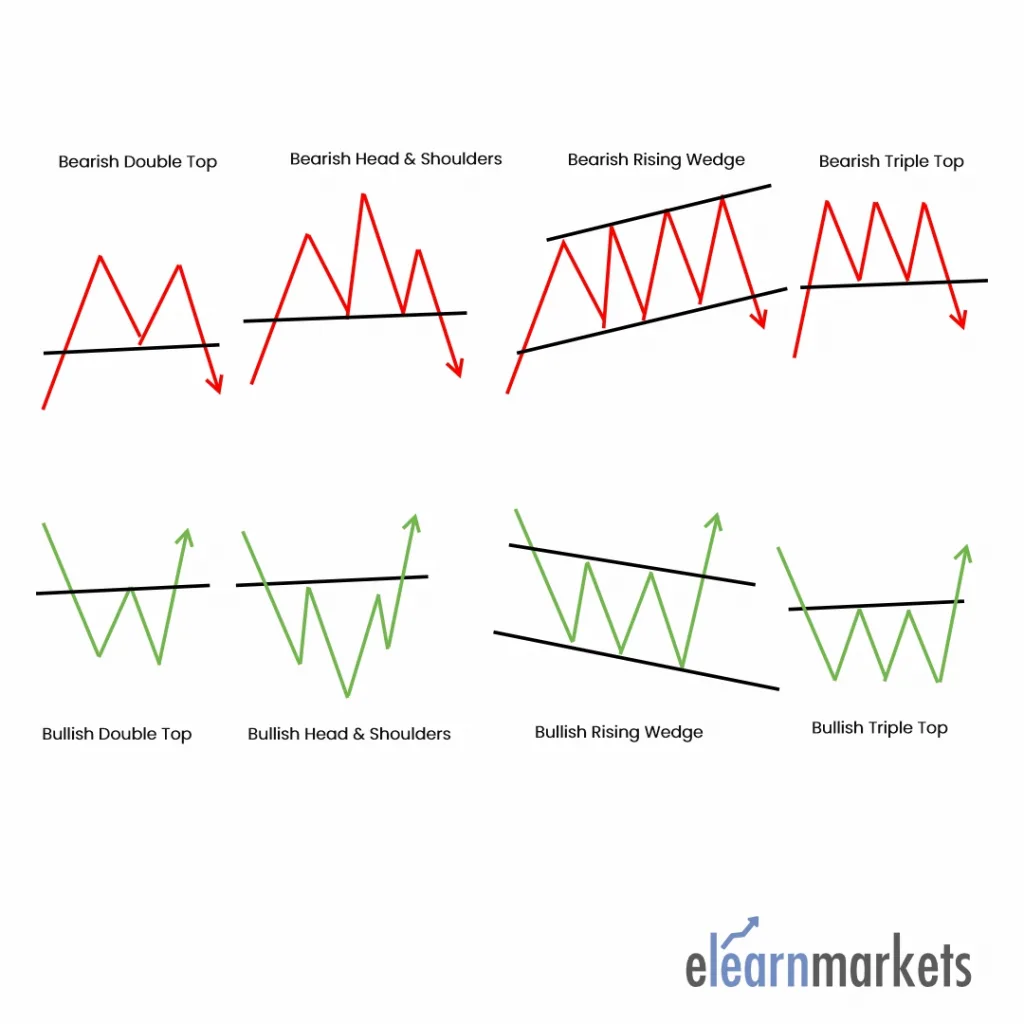
Prominent chart patterns include:
- Double Top: A bearish reversal pattern showing two failed attempts to break through resistance
- Head and Shoulders: A reliable reversal formation indicating trend exhaustion
- Rising and Falling Wedges: Narrowing price ranges that often precede breakouts
- Triangles: Consolidation patterns (ascending, descending, or symmetrical) preceding directional moves
- Triple Top: A stronger version of the double top, showing three rejections at resistance
Time Horizon
Chart patterns develop over extended periods, potentially spanning weeks, months, or even years. Simple formations like gaps or outside reversals might complete within a single session, while complex structures like broadening tops or dormant bottoms require considerable time to materialize fully. This extended development period reflects the gradual shift in market dynamics and participant sentiment.
Key Distinctions Between Candlestick vs. Chart Pattern
Structural Composition
Candlestick patterns combine one or several individual candlesticks into recognizable formations. Chart patterns, conversely, emerge from broader price movements influenced by psychological and fundamental factors operating over extended periods.

Timeframe Focus
The temporal dimension represents a crucial difference. Candlestick patterns concentrate on short-term price action, typically spanning hours to days. Chart patterns encompass longer-term trends, often requiring weeks or months to develop completely.
Signal Duration
Signals generated by candlestick patterns tend to be short-lived, offering guidance for immediate trading decisions. Chart patterns provide longer-lasting trend direction insights, suitable for position trading and investment strategies.
Application Strategy
Traders utilize candlestick patterns primarily for identifying precise entry and exit points within established trends or at potential reversal zones. Chart patterns serve a complementary role, helping traders recognize major trend changes and determine overall market direction for longer-term positioning.
Confirmation Requirements
Neither pattern type guarantees outcomes. Candlestick patterns benefit from confirmation through subsequent price action or volume analysis. Chart patterns similarly require validation, often through breakout confirmation and sustained movement beyond pattern boundaries.
Practical Integration
Successful technical analysis often involves combining both approaches. Traders might use chart patterns to identify the broader market structure and trend direction, then employ candlestick patterns to fine-tune entry and exit timing within that context. This integrated methodology leverages the strengths of each tool while compensating for their individual limitations.
Comparative Analysis Table
| Aspect | Candlestick Patterns | Chart Patterns |
| Composition | Formed by one or more individual candlesticks | Created by extended price movements forming geometric shapes |
| Timeframe | Short-term (hours to a few days) | Long-term (weeks to months or years) |
| Formation Period | Quick development, often 1-3 trading sessions | Gradual development over extended periods |
| Primary Use | Identifying precise entry and exit points | Determining overall trend direction and major reversals |
| Signal Duration | Short-lived signals for immediate action | Longer-lasting directional guidance |
| Market Information | Captures immediate market sentiment and emotion | Reflects psychological and fundamental factors over time |
| Trend Indication | Short-term trend direction or reversal | Long-term trend continuation or reversal |
| Best Suited For | Day trading, scalping, short-term swing trading | Position trading, swing trading, investment decisions |
Practical Integration
Successful technical analysis often involves combining both approaches. Traders might use chart patterns to identify the broader market structure and trend direction, then employ candlestick patterns to fine-tune entry and exit timing within that context. This integrated methodology leverages the strengths of each tool while compensating for their individual limitations.
Conclusion
Candlestick patterns and chart patterns serve distinct but complementary roles in technical analysis. Candlesticks excel at capturing short-term market sentiment and providing tactical trading signals, while chart patterns offer strategic perspective on longer-term price structure and trend evolution. Mastering both tools enhances a trader’s ability to navigate markets across multiple timeframes and adapt to varying market conditions.
In order to get the latest updates about Financial Markets visit our website https://stockedge.com/
Frequently Asked Questions (FAQs)
1. Can I use candlestick patterns and chart patterns together?
Absolutely. In fact, combining both approaches often produces superior results. Chart patterns help you understand the bigger picture and overall trend direction, while candlestick patterns provide precise timing for entries and exits within that broader context. For example, you might identify a head and shoulders pattern forming (chart pattern) and then wait for a bearish engulfing candlestick pattern to time your short entry.
2. Which is more reliable – candlestick patterns or chart patterns?
Neither is inherently more reliable than the other; they serve different purposes. Candlestick patterns excel at short-term signals but can produce more false signals due to market noise. Chart patterns tend to be more reliable for major trend changes but develop slowly and may cause you to miss early entry opportunities. Reliability increases significantly when either pattern type is confirmed with volume analysis and other technical indicators.
3. How long should I wait for pattern confirmation?
For candlestick patterns, confirmation typically occurs within one to three subsequent candles. If a bullish hammer appears, you’d want to see the next candle close higher to confirm the reversal. For chart patterns, confirmation usually requires a clear breakout beyond the pattern boundary with increased volume, followed by sustained movement in the breakout direction. This might take several days to weeks depending on the pattern size.
4. Do candlestick patterns work on all timeframes?
Yes, candlestick patterns function across all timeframes from one-minute charts to monthly charts. However, their reliability generally increases on higher timeframes (daily, weekly) because these incorporate more data and reduce the impact of random price fluctuations. Lower timeframes generate more signals but also more false positives due to market noise.
5. Can a pattern fail after forming correctly?
Yes, all patterns can fail. Markets are probabilistic, not deterministic. A perfectly formed pattern might not produce the expected outcome due to unexpected news, changes in market sentiment, or institutional activity. This is why risk management, stop-loss orders, and pattern confirmation are essential components of any trading strategy based on pattern recognition.
6. Should beginners start with candlestick or chart patterns?
Beginners often find candlestick patterns easier to learn initially because they’re simpler to identify and provide more immediate feedback. However, understanding basic chart patterns early on helps develop a sense of market structure and trend. A balanced approach learning a few basic patterns of each type simultaneously often works best for building comprehensive technical analysis skills.


I have asked for verification code for about 7 times but to no avail.I doubt whether you really send the code?. Can i register without code
Hi,
You can just rest register with your email id.
I am not really superb with English but I line up this real easygoing to understand.