Key Takeaways
- Elliott Wave Theory states that markets move in 5 waves – 3 Impulse with the 3rd wave being the strongest and 2 motive waves. There are also 3 corrective waves.
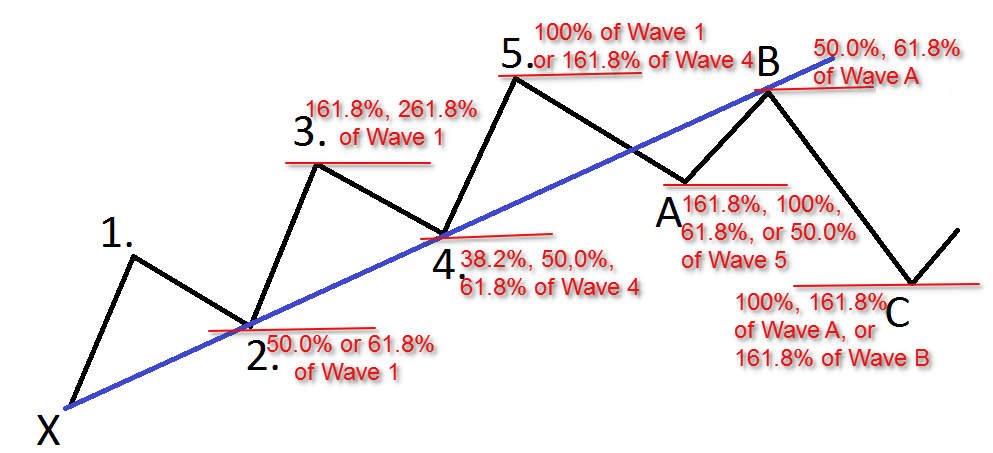
- The third wave is a 161.8% Fibonacci extension of the first wave.
- To trade the third wave, make sure the second wave never retraces more than wave one and wait for the third wave to break the previous high or low of wave 2.
- Focus on the third Elliott wave for clear and trend based trades while avoiding indicator overload.
The 3rd wave is a part of the Elliott wave theory. This is a simple and a straight forward theory which was created by Ralph Nelson Elliott.
The Elliott Wave Theory was first published in the book “The Wave Principal” in the year 1938.
As the Elliott wave theory is open to interpretations, it leads to the result in which wave count tend to differ. Therefore its very important to understand Elliot Wave Theory. You can enhance your understanding through our Elliot wave theory course.
It is confusing to the analysts because of the wave count. But there is no doubt that there are rules regarding the counting of the Elliott waves.
In real life trading, there is subjectivity in the counting of Elliott wave as there are many instances when the market don’t quite follow the rules and thus make Elliott waves open to interpretation.
Elliot waves also tend to occur through different timeframes which makes it more complex.
The Elliott Wave Theory
In simple terms Elliott wave theory is familiar to the Dow Theory of trends. Ralph Nelson found that in any trend the prices tend to move in a five wave pattern.
Out of these five waves, 3 waves are in the direction of the trend. These Elliott waves are known as Impulse waves.
The other two waves within the trend are known as motive waves.
Learn from Experts: Technical Analysis Using Elliott Wave Theory
After the formation of these five waves, there are also three corrective waves known as the corrective waves.
Elliot waves depend on the Fibonacci retracement levels as well.

Among the three impulsive waves, the third wave is the strongest wave as in this wave, there is lot of market euphoria. In most situations, the traders usually identify the third wave when it has already established.
Among the three impulsive waves, the third wave is the strongest wave as in this wave, there is lot of market euphoria. In most situations, the traders usually miss the Elliot wave learning and identify the third wave when it has already established.
The Third Wave
The third wave of the Elliot wave theory is the most visually standing out wave. After the consolidation of the second wave, third wave breaks out.
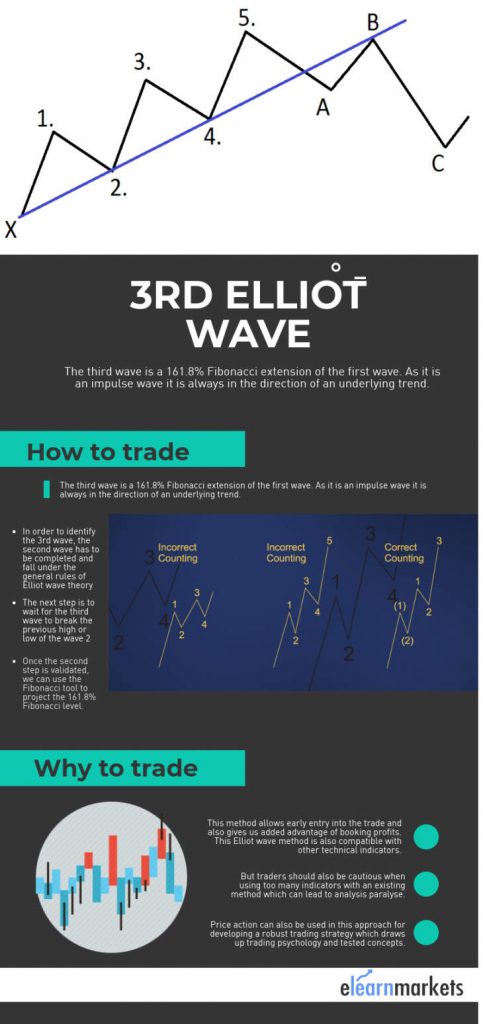
The third wave is a 161.8% Fibonacci extension of the first wave. As it is an impulse wave it is always in the direction of an underlying trend.
In most of the cases, the third case can extend by 261.8% or 461.8% as well.
As the third wave is easily identified, trading the third wave can be difficult.
The third wave can be forms in different multi time frames.
The Elliot wave theory is based on the concept of fractals. Each wave can be broken down into smaller degree of waves.
How to Trade the Third Wave?
We have discussed above that the third wave is the strongest impulsive wave which have an extension of 161.8% of the first wave in the Elliot wave count. It means that the third wave forms after the completion of the second wave.
In order to identify the 3rd wave, the second wave has to be completed and fall under the general rules of Elliot wave theory.
Although there are many explanations on the nature of the second wave, one of the rules is that the second wave should never retrace more than wave one.
Therefore the traders should keep a close watch on the second wave in order to trade successfully the third wave.
The next step is to wait for the third wave to break the previous high or low of the wave 2.
Once the second step is validated, we can use the Fibonacci tool to project the 161.8% Fibonacci level.
Significance of 3rd Wave
The counting of the waves is quite a task and a wrong count of the trade and in most cases a wrong count can lead to the analysis invalid.
Elliot wave is also subjective which could lead to incorrect analysis and result in potentiality devastating trade entries.
In order to avoid this, traders should just focus on the third wave of Elliot wave theory. By identifying the trend, traders can enter the third wave easily.
This method allows early entry into the trade and also gives us added advantage of booking profits. This Elliot wave method is also compatible with other technical indicators.
But traders should also be cautious when using too many indicators with an existing method which can lead to analysis paralyse.
Price action can also be used in this approach for developing a robust trading strategy which draws up trading psychology and tested concepts.
In order to get the latest updates on Financial Markets visit StockEdge
Frequently Asked Questions (FAQs)
1. How Elliott Wave Works?
Elliott Wave Theory works by identifying repeating price patterns called “waves” in financial markets. These waves follow a 5-wave pattern in the direction of the trend (impulse waves) and a 3-wave pattern against it (corrective waves), helping traders predict future price movements.
2. What is Elliott Wave Strategy?
The Elliott Wave strategy is a trading method based on the belief that markets move in a series of five waves in the direction of the trend and three corrective waves. By identifying these patterns, traders aim to spot potential entry and exit points within the broader market cycle.
3. Who Invented Elliott Wave?
The Elliott Wave Theory was invented by Ralph Nelson Elliott in the 1930s. He observed that stock markets move in repeating patterns or “waves” driven by investor psychology.
4. How to Identify Elliott Wave?
To identify Elliott Waves, start by spotting the overall trend. Look for five waves in the direction of the trend (impulse waves) followed by three waves against it (corrective waves). Use tools like trendlines, Fibonacci levels, and chart patterns to confirm wave counts. Wave 3 is usually the strongest, and Wave 4 doesn’t enter Wave 1’s price range. Practice helps refine the pattern recognition.


best