Bank Nifty opened above its 5 day high EMA at (24850 approx) today. The Index moved by 354 points intraday low and closed at 24703.
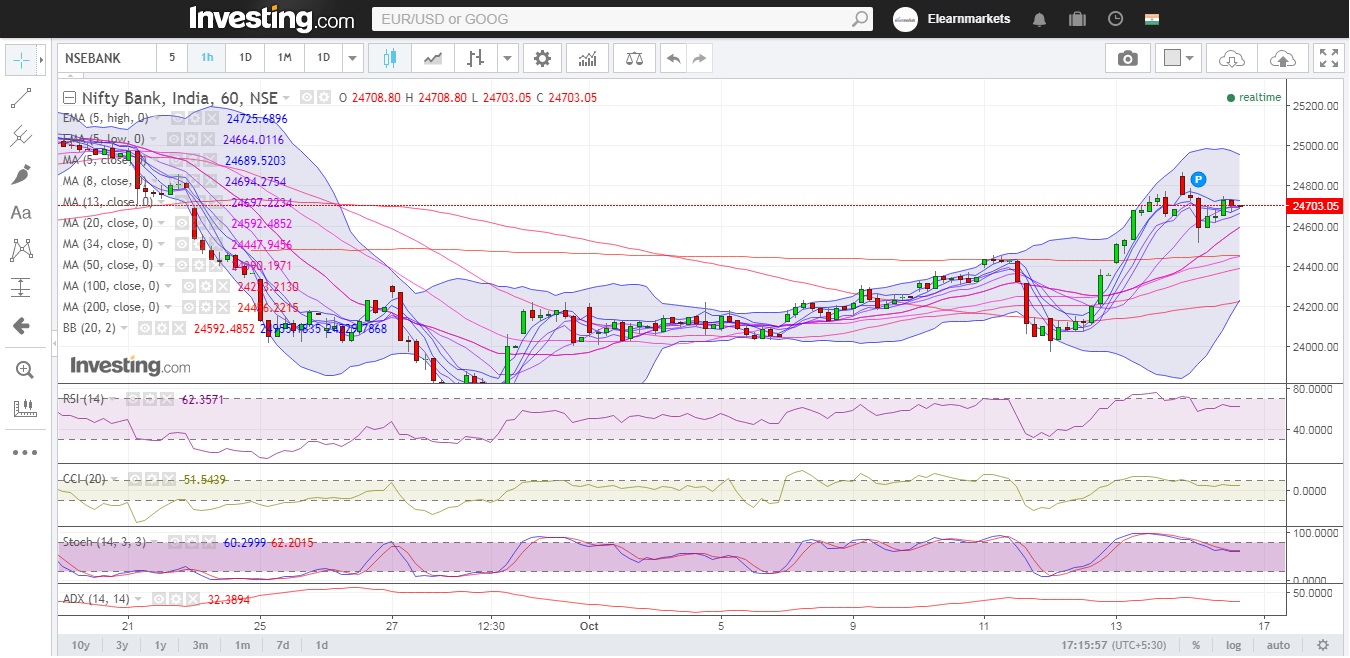
Hourly Technicals:
In the Hourly Chart, Bank Nifty has closed below its 5 hourly EMA of (24703 approx).The Index is likely to face immediate resistance around the upper end of the hourly bollinger band (24955 approx). Bank-Nifty will find its next support around the 5 hourly low EMA (24664 approx).
Figure: Bank-Nifty Hourly Chart
Hourly RSI has moved towards the higher end of the normal range, while the hourly CCI has turned positive. The ADX is indicating that volatility is on the cards.
Daily Technicals:
The daily chart indicates that Bank Nifty has closed above its 50 daily EMA (24706 approx). The Index will face resistance around the upper end of the Bollinger Band(25094 approx). On the downside, if Bank Nifty breaks and closes below its intraday low, it could find support near its 5DMA (24441 approx).
The daily RSI indicator has closed mid way between the normal range.The CCI indicator has turned positive however the ADX indicates momentum might be picking up.
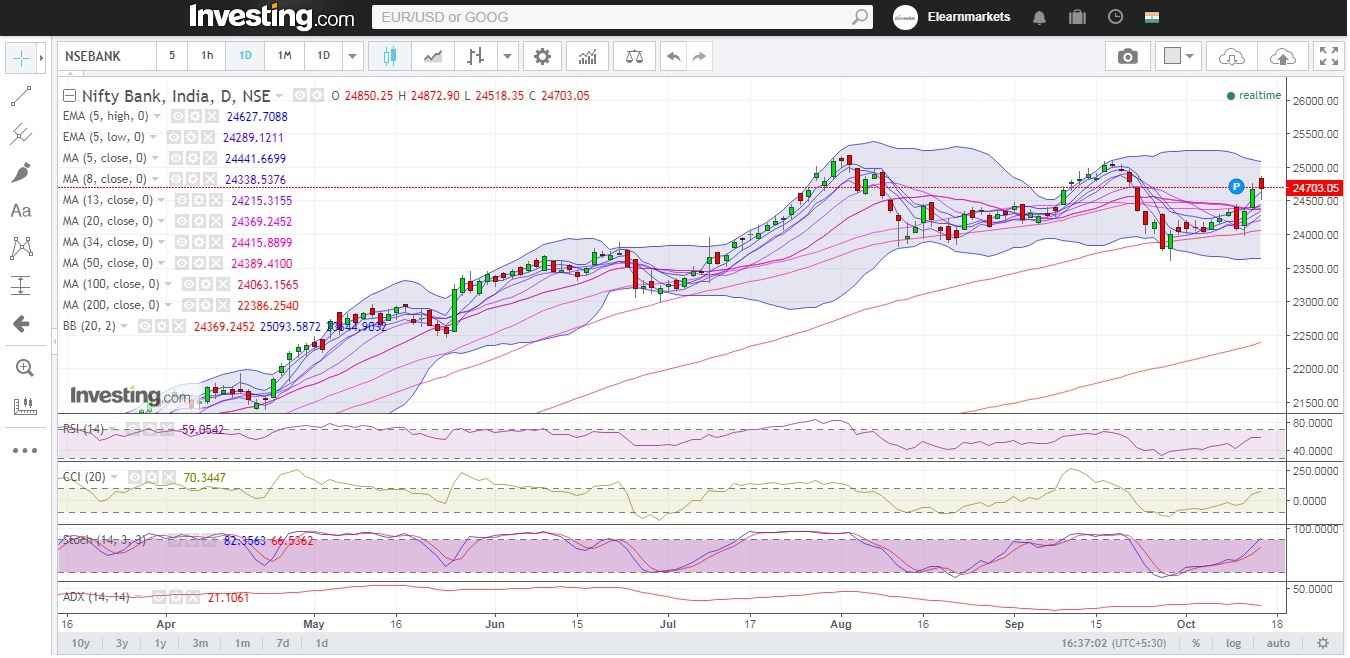
Figure: Bank-Nifty Daily Chart
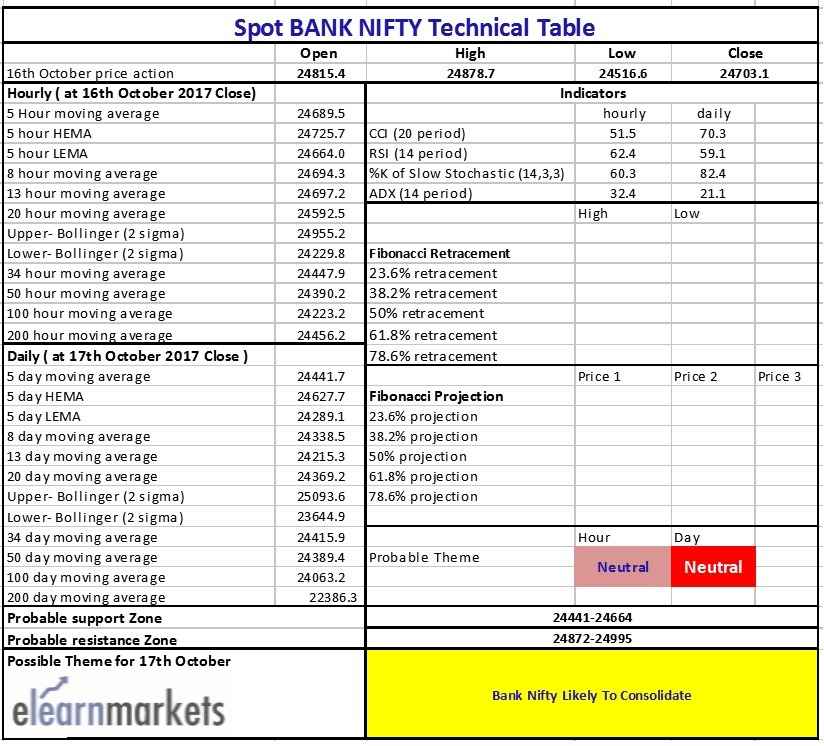
Figure: Bank-Nifty Tech Table


