Key Takeaways
- Signal trend pauses before continuation, unlike reversal patterns.
- Doji & Spinning Top show indecision-need confirmation.
- Three Methods & Tasuki Gap reflect brief consolidation in trends.
- Mat-Hold & Windows indicate strong momentum continuation.
- Confirm with volume and other indicators for reliable signals.
Continuation candlestick patterns indicate that the prevailing trend is likely to continue when a little pause is over and the breakout is verified. They are the foundation of one of the most widely utilized trading methods. Reversal patterns are the antithesis of continuation structures.
One important component of technical analysis that traders use to forecast when a trend will resume is the continuation candlestick patterns.
After a brief period of consolidation or pause, continuation patterns indicate that the present market trend is likely to continue, in contrast to reversal patterns, which indicate possible trend changes. These patterns emerge from prevailing trends and can offer traders useful information about possible points of entry and exit.
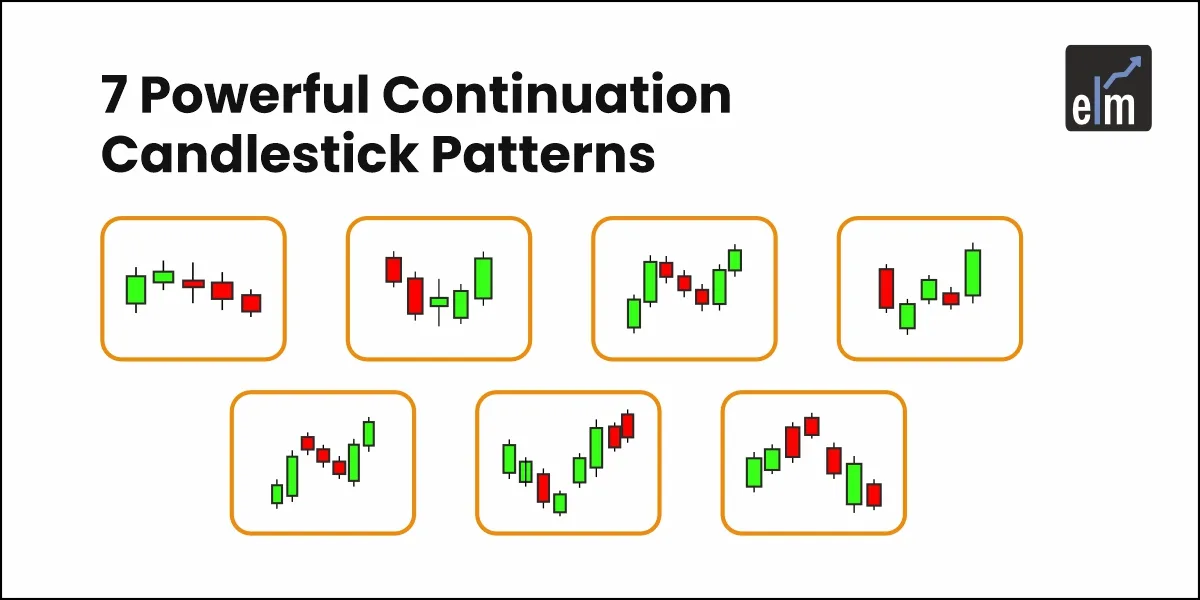
In today’s blog, let us discuss the 7 Powerful Continuation Candlestick Patterns:
7 Powerful Continuation Candlestick Patterns
Here are 7 Powerful Continuation Candlestick Patterns:
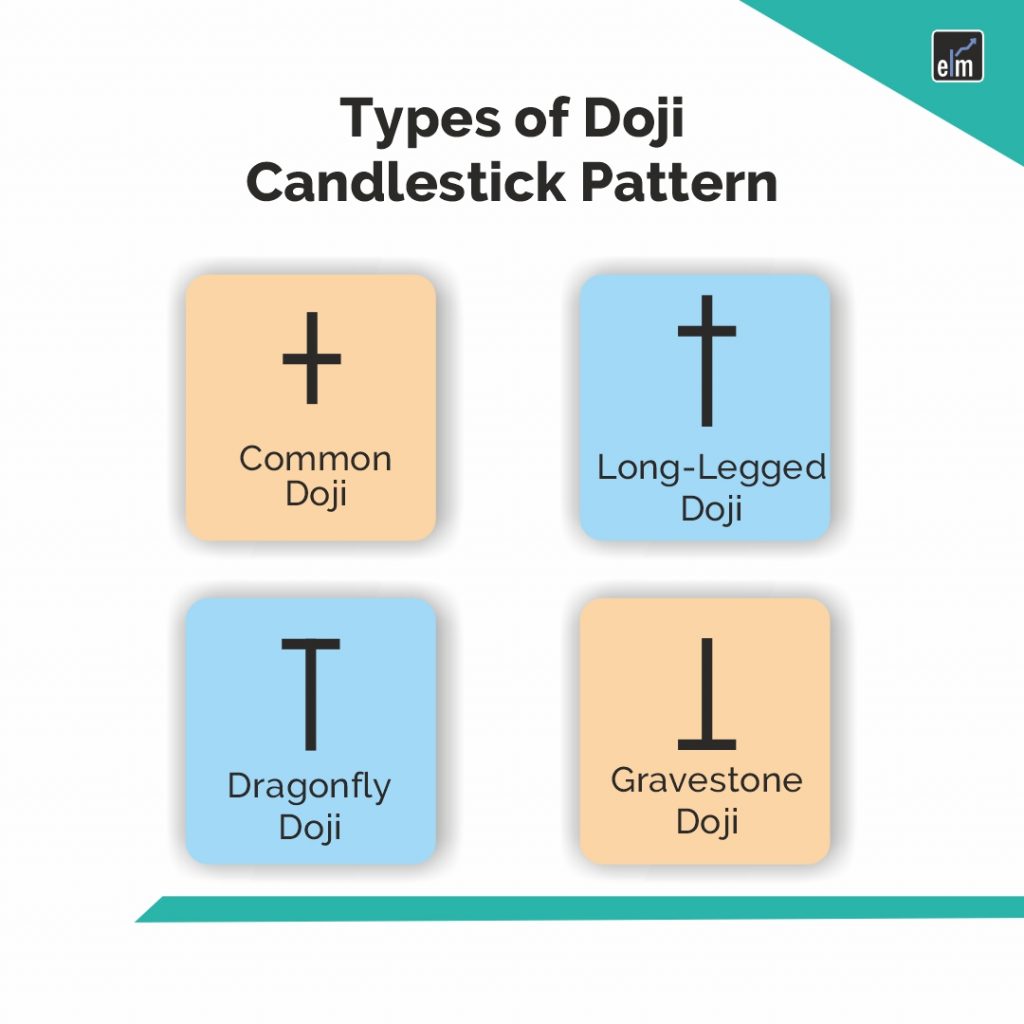
1. Doji
A Doji candlestick pattern is distinguished by its narrow body, in which the open and close are quite near to one another. It represents uncertainty among buyers and sellers in the market. A Doji in a trend may signal a possible pause or consolidation, implying that if price action in the trend is confirmed, the trend may continue.
2. Spinning Top
With its compact body and extended upper and lower shadows, the Spinning Top pattern denotes indecisiveness and a balance between buyers and sellers. If the next candle in a trend confirms the direction, a spinning top may indicate that the trend may continue.
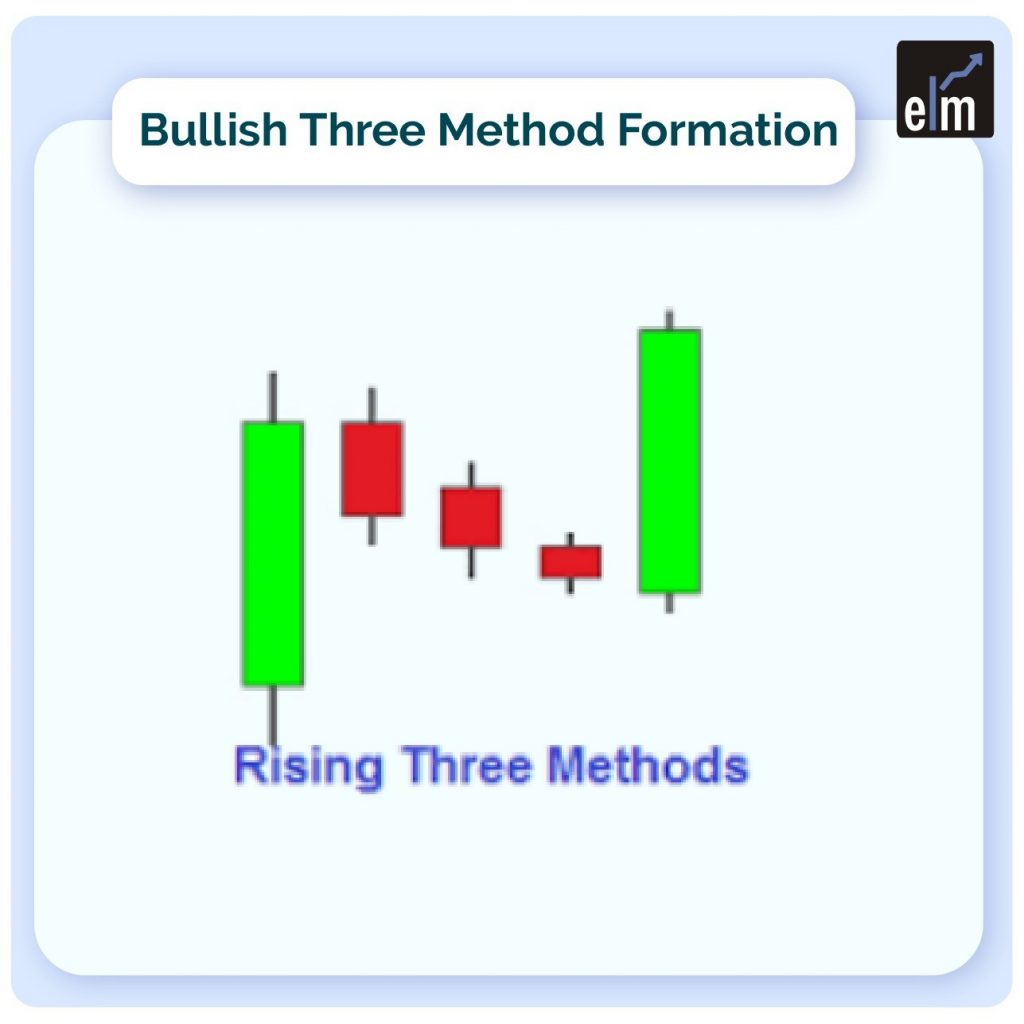
3. Rising & Falling Three Methods
These patterns are made up of a sequence of candlesticks that indicate a phase of consolidation within the dominant trend:
Rising Three Methods– Three little bullish candles, or Dojis, are shown in this pattern, which is in an uptrend, and are followed by a huge bullish candle. It points to a brief period of consolidation prior to the uptrend resuming.
Falling Three Methods: This pattern shows three minor bearish candles followed by a huge bearish candle in a downtrend. It suggests that the downward trend may pause momentarily before continuing.
4. Tasuki Gap
A continuation pattern known as the Tasuki Gap is created when two candles inside a trend follow each other:
A bearish candle that creates a gap downward follows a bullish candle that opens during an uptrend. A possible continuation of the uptrend is indicated by the third candle, which is bullish and closes within the gap of the second candle.
Similar but reversed, the pattern occurs in a downtrend when a bullish candle leaves a gap up after a bearish candle. The third candle is bearish and closes inside the gap, indicating that the downward trend will likely continue.
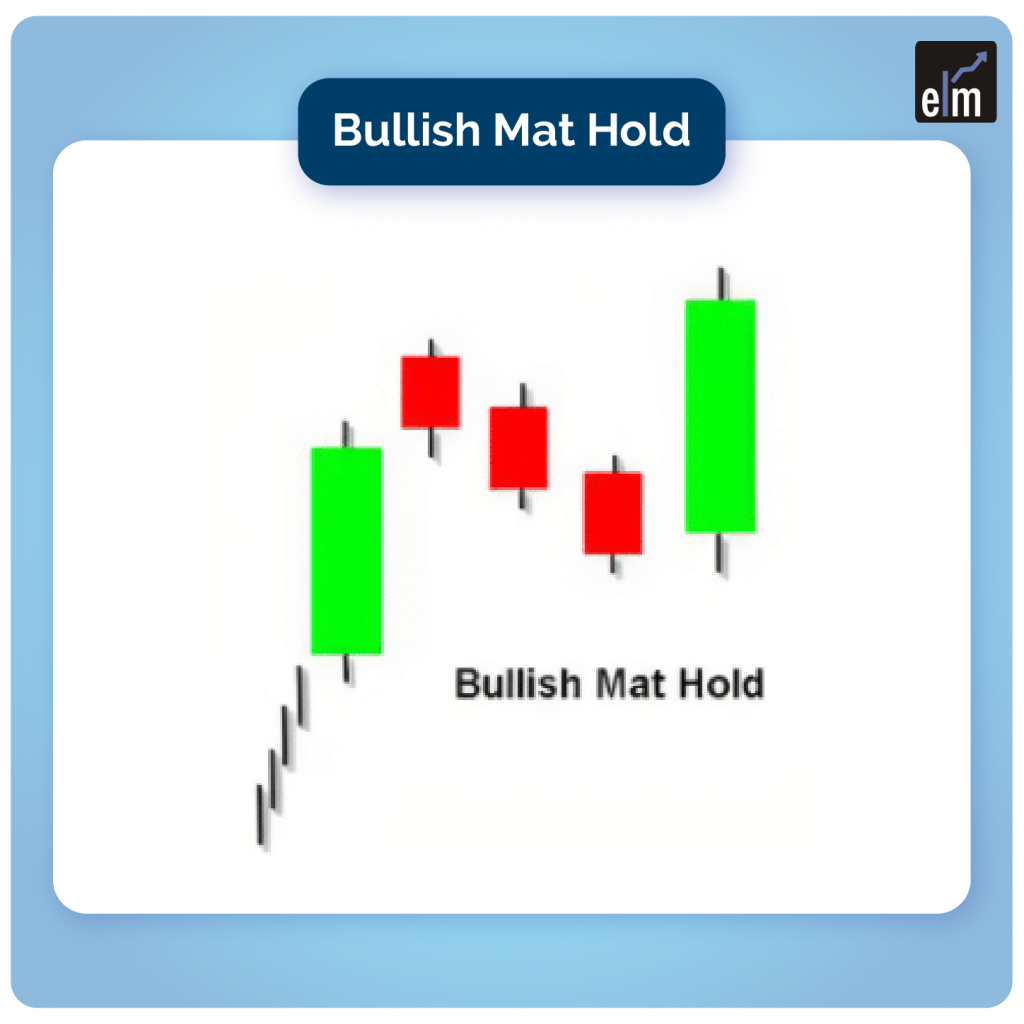
5. Mat-Hold
A long bullish candle initiates the Mat-Hold pattern, which is a continuation pattern that develops within an uptrend. It is followed by a short candle (often a Doji) that indicates a minor downturn or consolidation, and then another long bullish candle that carries on the trend. Based on this pattern, there is a good chance that the uptrend will resume after a little break.
6. Rising & Falling Window
When the current period’s high is wholly greater than the previous period’s high and the current period’s low is greater than the previous period’s low, this is known as a rising window (or gap). The fact that prices are rising sharply suggests a positive attitude.
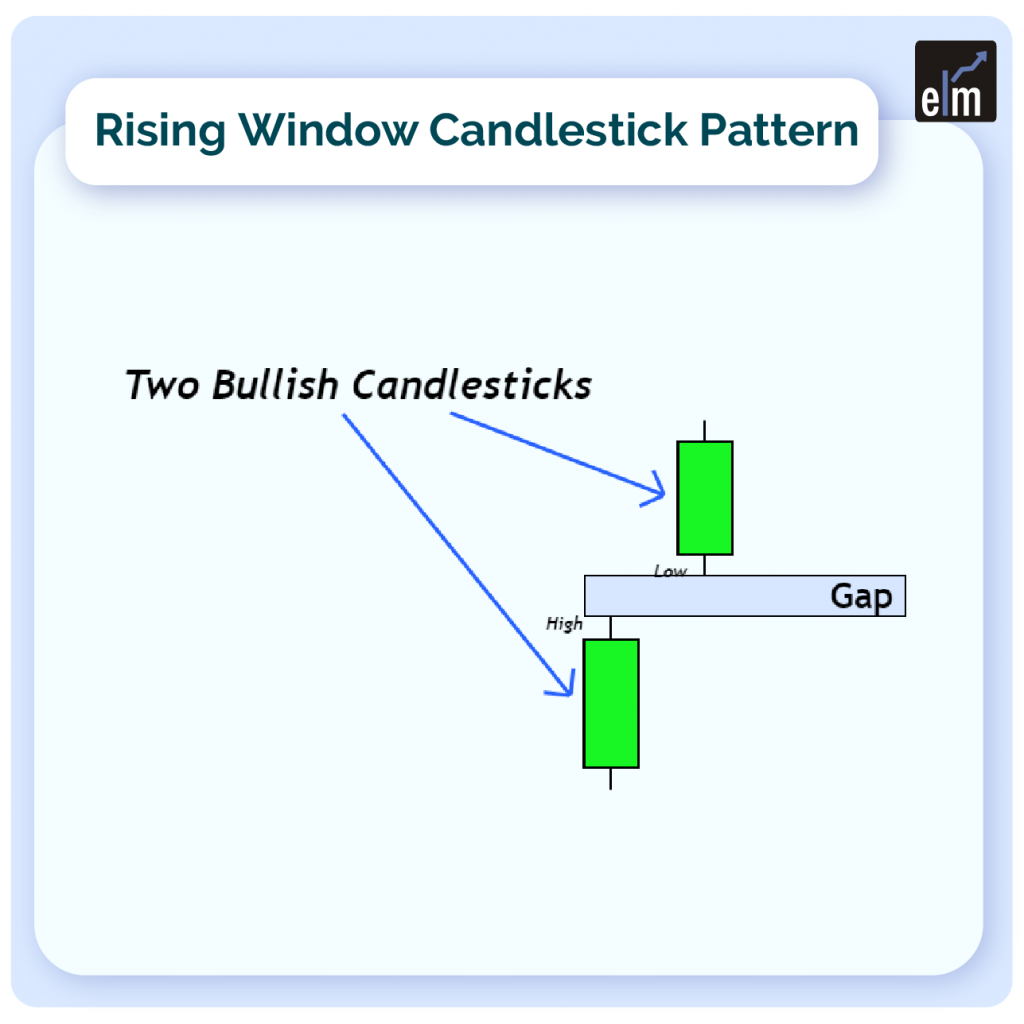
The reverse is known as a Falling Window (or Gap), when the high of the current period is lower than the high of the previous period and the low of the current period is completely lower than the low of the previous period. It implies a pessimistic outlook as prices are plunging.
These gaps frequently indicate significant momentum in the direction of the dominant trend, suggesting that the trend may continue.
7. High Wave
A small true body (open and close prices are near to each other) with extended upper and lower shadows, signifying strong volatility and indecisiveness in the market, is the defining feature of the strong Wave candlestick pattern.
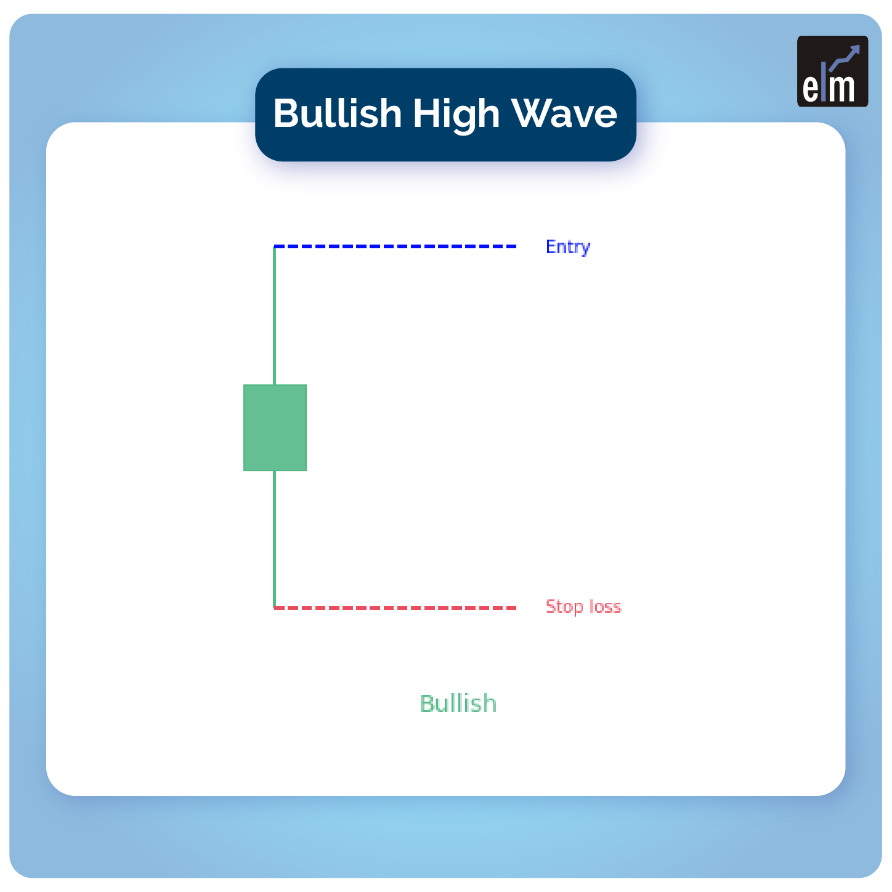
A High Wave candlestick in an upward trend may suggest buyer fatigue or hesitancy, potentially indicating a pause or trend reversal.
A High Wave candlestick in a downward trend may indicate ambiguity or a conflict between buyers and sellers, indicating that the trend may reverse or continue based on future price movement.

You can filter stocks based on Continuation Candlestick Patterns with the help of StockEdge Scans
Conclusion
Comprehending these candlestick patterns can offer significant understanding of market emotion and possible continuation or reversal of the trend. To help them make well-informed trading decisions, traders frequently combine these patterns with additional technical analysis techniques. For more trustworthy indications, it’s critical to validate these patterns with more price movement and volume investigation.
Also Read-All 35 Candlestick Chart Patterns in the Stock Market-Explained
Frequently Asked Questions (FAQs)
1. What are continuation candlestick patterns?
Continuation candlestick patterns indicate that a trend may be entering a brief period of consolidation or halt, after which it is likely to continue. These patterns aid traders in determining possible locations of entry into the direction of the dominant trend and are commonly featured in resources like our Chart Patterns E-book
2. How do I identify these patterns on a price chart?
The form and traits of successive candlesticks within a trend can be used to identify continuation candlestick patterns. Seek for distinct patterns that suggest possible continuance, such as pennants, flags, or certain candlestick forms like the Doji, Spinning Top, or High Wave.
3. Why are continuation patterns important for traders?
Continuation patterns offer important clues about the mood of the market and possible future price moves. Through the identification of these patterns, traders may predict when the current trend will resume and determine the best times to enter and exit the market.


