
Hindi: आप इस लेख को हिंदी में भी पढ़ सकते है|
Key Takeaways:
- Average True Range (ATR) is a volatile indicator was introduced by a famous technical analyst J. Welles Wilder Jr. in his book “New Concepts in Technical Trading Systems” in the year 1978.
- The ATR indicator moves up and down when the moves in the prices become larger or smaller.
- Traders use the indicator to enter and exit trades and also to put a stop loss in order to reduce the loss if the prices move in the opposite direction.
- ATR is open to interpretation. Not a single ATR value will tell you with any certainty if the trend is going to reverse or not.
- Traders can also use ATR scans in the StockEdge web version.
Average True Range is one of the popular and widely used technical indicators which track volatility.
This indicator shows how much an asset has moved on an average during a specific timeframe.
This indicator helps the traders to confirm their trade as well as help them to place a stop-loss.
Let us discuss this indicator in details:
What is the Average True Range (ATR)?
Average True Range (ATR) is a volatile indicator was introduced by a famous technical analyst J. Welles Wilder Jr. in his book “New Concepts in Technical Trading Systems” in the year 1978.
Unlike other technical indicators, ATR does not indicate the trend of the market’s price but is only measures the degree of its volatility.
ATR was first introduced for use in commodities markets but now it is applied to all types of securities.
The ATR indicator represents an N-period smoothed moving average (SMMA) of the true range values.
Traders usually use 14-period as it was first recommended by J. Welles Wilder.
Now, you must be wondering what is the how is the ATR values calculated?
Calculation of Average True Range:
The calculation of ATR is done by using the following 1 of 3 methods that depend on how the candles are formed.
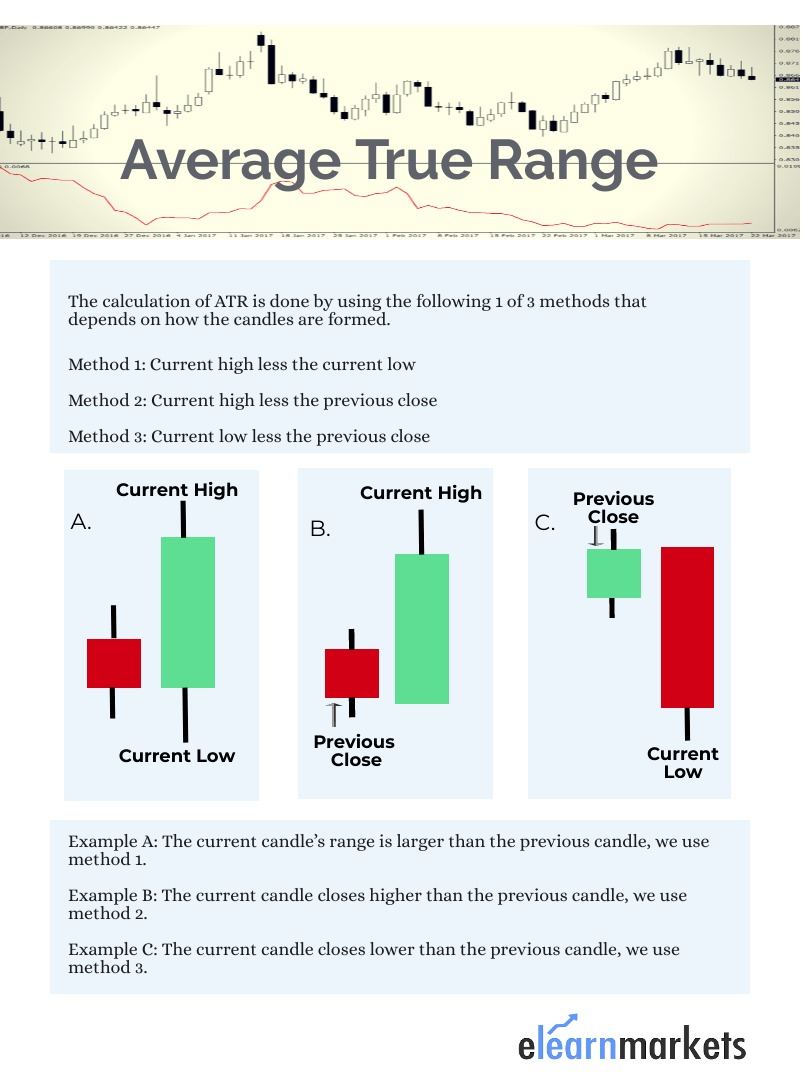
From the above image, we can conclude that the larger the range of the candles, the greater is the ATR value and vice versa.
Current ATR = [(Prior ATR x 13) + Current TR] / 14

It doesn’t matter whether the number is positive or negative. The highest absolute value is used in the calculation.
Typically, we use 14 as the number of periods in the calculation.
In case you are willing to learn about technical analysis, click here: Certification in Online Technical Analysis
How to analyze Average True Range?
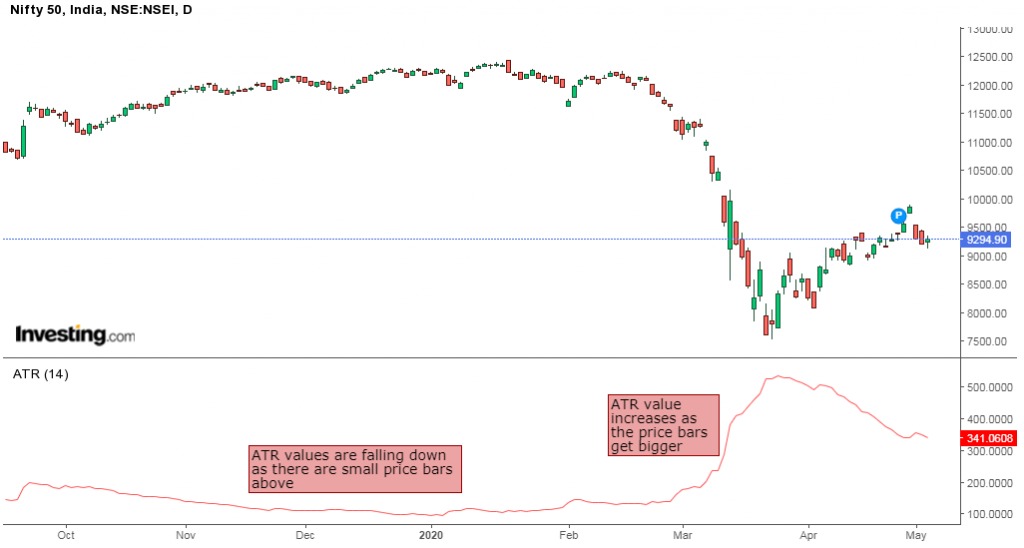
The ATR indicator moves up and down when the moves in the prices become larger or smaller.
On a one-minute chart, a new ATR reading is calculated every minute. On a daily chart, ATR is calculated every day.
All the above readings are plotted forming a continuous line, so that the traders can see how volatility is changing over time.
Below we can see the Average True Range as seen on daily charts:
How the Average True Range helps us in our trading decisions:
In simple terms, a stock with a high level of volatility has a higher ATR, and similarity, a stock with a lower volatility has a lower ATR.
Traders use the indicator to enter and exit trades and also to put a stop loss in order to reduce the loss if the prices move in the opposite direction.
A rule of thumb for putting stop loss using ATR is that to multiply the ATR by two.
So if you’re buying a stock, then you may place a stop loss at 2 x ATR below the entry price.
And similarly, If you’re selling a stock, then you should place a stop loss at 2 x ATR above the entry price.
If you’re long and the price moves favorably, continue to move the stop loss to 2 x ATR below
For example, a long trade is taken at Rs.100 and the ATR value is 2. Then you can place a stop loss at Rs.96 i.e. {100-(2*2)}. And when a short trade is taken at Rs. 100 and the ATR value is 2. Then you can place a stop loss at Rs.104 i.e. {100+ (2*2)}.
How to use Average True Range Scans in StockEdge:
You can also use the Average True Range Scans in the StockEdge web version as shown below:
Steps to use ATR scans in StockEdge:
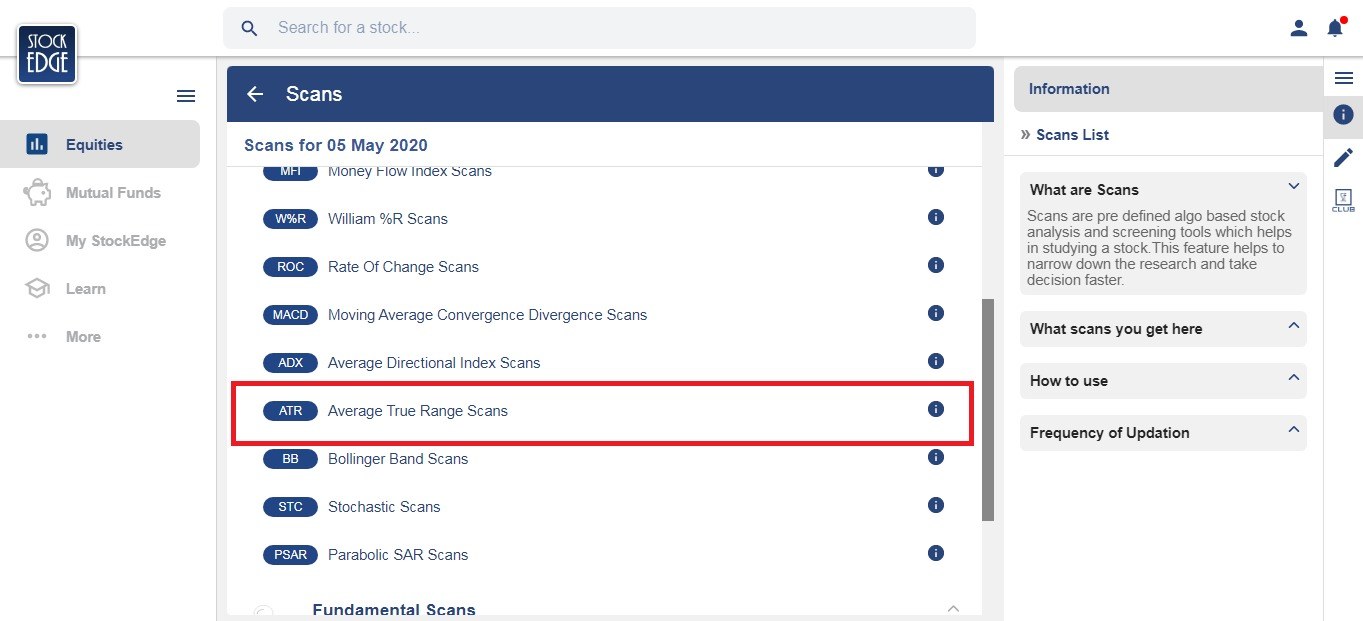
• Under the “Technical scans”, you can select “Average True Range” scans as shown below:
• There are many ATR scans in this section as shown as below. You can select any of them depending on your trading strategy.
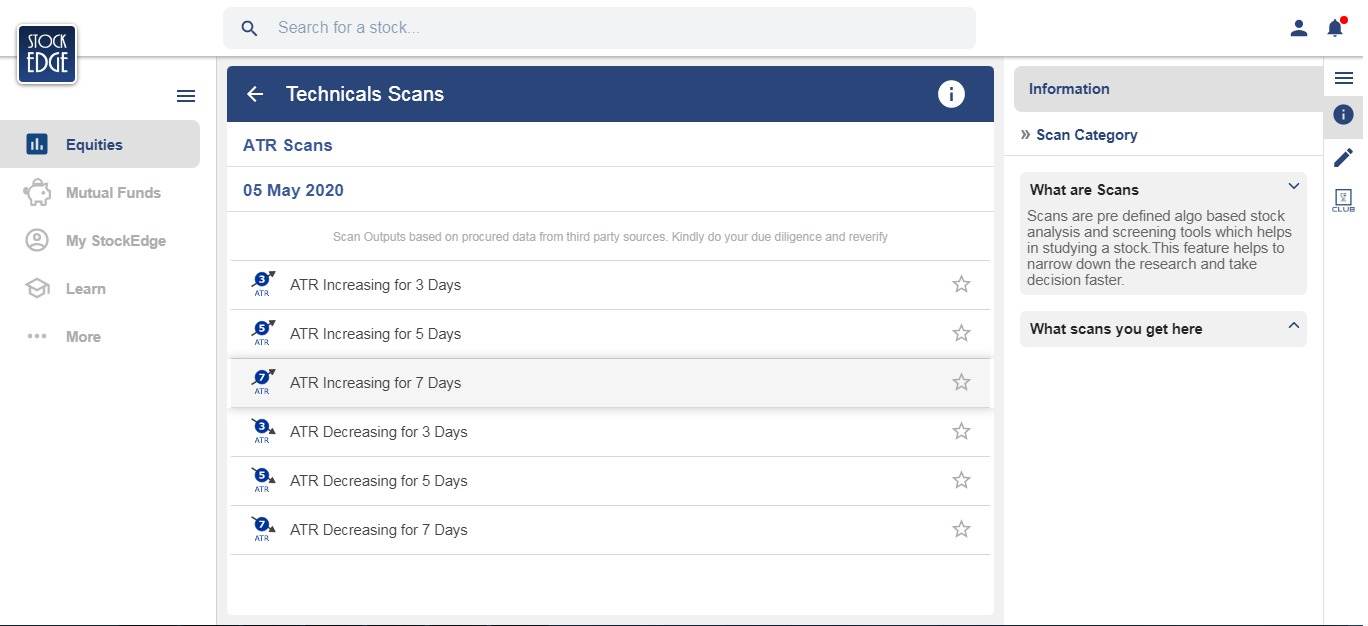
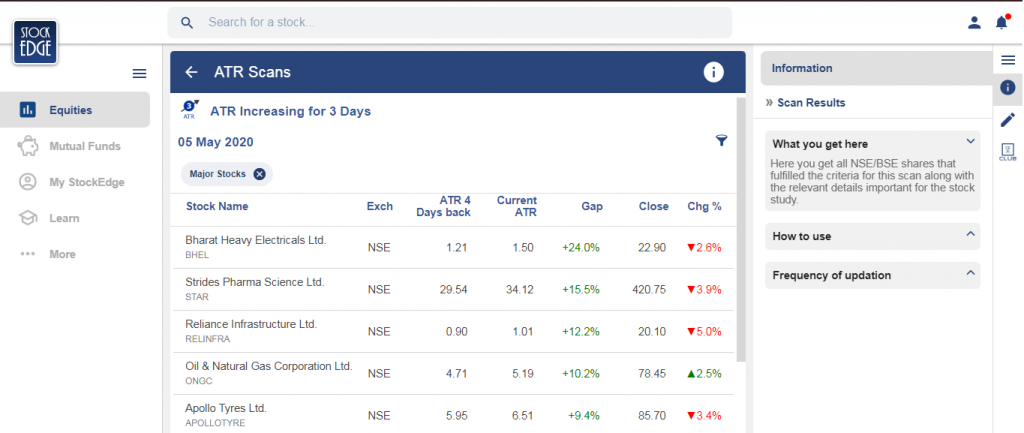
• After choosing the ATR scan, you will get a list of stocks with the details as shown below:
Watch the below video to know more about this indicator:
Limitations of Average True Range:
There are mainly two limitations of average true range indicator.
Firstly, ATR is open to interpretation. Not a single ATR value will tell you with any certainty if the trend is going to reverse or not.
Secondly ATR only measures volatility and not change in the direction of an asset’s price.
For example, a sudden increase in the ATR may make some traders think that the ATR is confirming the old trend but this may not actually be the case.
Will you use this technical indicator in your trading setup? Tell us by commenting below:
Happy Learning!


