Elearnmarkets - Financial Market Learning
  • Categories
    • Basic Finance
    • Derivatives
    • Financial Planning
    • Fundamental Analysis
    • Technical Analysis
    • Marketshala
    • Miscellaneous
  • Language
    • English
    • Hindi
    • Bengali
No Result
View All Result
  • Courses
  • Webinars
  • Learn On Elearnmarkets
Elearnmarkets - Learn Stock Market, trading, investing for Free
No Result
View All Result
Home Technical Analysis Charts, Patterns & Indicators
डार्क क्लाउड कवर के साथ ट्रेड कैसे करें: कैंडलस्टिक पैटर्न 1

डार्क क्लाउड कवर के साथ ट्रेड कैसे करें: कैंडलस्टिक पैटर्न

Elearnmarkets by Elearnmarkets
June 29, 2020
in Charts, Patterns & Indicators, Technical Analysis
Reading Time: 4 mins read
0
3.3k
VIEWS
Share on FacebookShare on TwitterShare on WhatsApp

English: Click here to read this article in English.

मूल बातें:

  • डार्क क्लाउड कवर एक बेयरिश (मंद) रिवर्सल कैंडलस्टिक पैटर्न है जो एक अपट्रेंड के अंत में बनता है।
  • यह दो कैंडलस्टिक्स से बना है। पहला कैंडलस्टिक बुलिश कैंडलस्टिक है और दूसरा बेयरिश कैंडलस्टिक है।
  • ट्रेडर्स को यह पैटर्न महत्वपूर्ण लगता है क्योंकि यह अपट्रेंड के उत्क्रमण को डाउनट्रेंड में बदलने का संकेत देता है।
  • यदि इस कैंडल के निर्माण के दौरान इसकी वॉल्यूम अधिक है, तो इसके रिवर्स होने की अधिक संभावना है।
  • इसके अलावा, अन्य टेक्निकल एनालिसिस के साथ इस पैटर्न द्वारा दिए गए संकेतों की पुष्टि करना न भूलें।

डार्क क्लाउड कवर एक बेयरिश (मंद) रिवर्सल कैंडलस्टिक पैटर्न है जो एक अपट्रेंड के अंत में बनता है।

यह अपट्रेंड में संभावित कमजोरी का संकेत देता है।

Table of Contents
एक डार्क क्लाउड कवर क्या है?
डार्क क्लाउड कवर का गठन
इस पैटर्न का उपयोग कैसे करें
ट्रेडिंग में डार्क क्लाउड कवर का महत्व

यह दो कैंडलस्टिक्स से बना है। पहला कैंडलस्टिक बुलिश कैंडलस्टिक है और दूसरा बेयरिश कैंडलस्टिक है। 

दूसरा कैंडलस्टिक एक बेयरिश कैंडलस्टिक सिग्नल रिवर्सल है और अपट्रेंड का अंत भी है।

यह कैंडलस्टिक पैटर्न पियर्सिंग पैटर्न के समान है।

Join TMP Join TMP Join TMP

अंतर केवल इतना है कि पियर्सिंग पैटर्न डाउनट्रेंड के अंत में होता है जबकि इस कैंडलस्टिक पैटर्न का एक अपट्रेंड के अंत में होता है।

आइए विस्तार में चर्चा करते हैं कि डार्क क्लाउड कवर के साथ कैसे ट्रेड करें:

एक डार्क क्लाउड कवर क्या है?

इस पैटर्न में पिछले दिन की कैंडल के पार “डार्क क्लाउड” बनाने वाली एक लार्ज ब्लैक कैंडल शामिल है।

मार्केट एक्सपर्ट्स से कैंडलस्टिक विश्लेषण की मूल बातें सीखें

खरीदार शुरू में कीमत को अधिक बढ़ाते हैं, लेकिन फिर विक्रेता बाद के सत्र में कीमतों को नीचे ले जाते हैं।

यह खरीदने से बेचने तक के सिग्नल्स है जो आगामी डाउनसाइड में कीमत रिवर्सल का कारण बन सकते है।

ज्यादातर ट्रेडर्स डार्क क्लाउड कवर पैटर्न को तभी उपयोगी मानते हैं जब यह अपट्रेंड के अंत में होता है

जैसे ही कीमतें बढ़ती हैं, पैटर्न डाउनसाइड की ओर रिवर्सल होने के लिए और अधिक महत्वपूर्ण हो जाता है।

यदि मूल्य गति अस्थिर है, तो पैटर्न कम महत्वपूर्ण है क्योंकि इस पैटर्न के बाद मूल्यअस्थिर रहता है

डार्क क्लाउड कवर का गठन:

इस पैटर्न में बुलिश ट्रेंड के बाद लार्ज बेयरिश कैंडल शामिल है। यह बड़ी बेयरिश वाली कैंडल पिछले दिन की कैंडल के ऊपर डार्क क्लाउड  बनाती है।

हम नीचे दी गई छवि से देख सकते हैं कि यह पैटर्न कैसे बनता है:

डार्क क्लाउड कवर

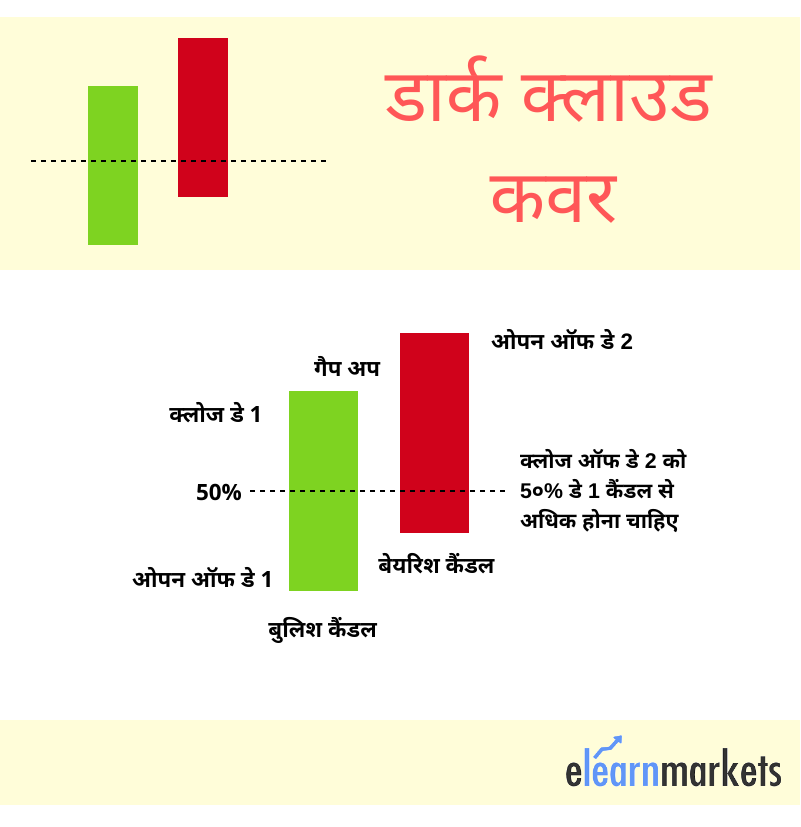
एक दिन के अंतराल के बाद, यह एक अपट्रेंड में बुलिश कैंडल के साथ शुरू होता है।

अगले दिन की कैंडलस्टिक एक बेयरिश कैंडल बन जाती है। इस बेयरिश कैंडल का समापन पिछले दिन की कैंडल के मध्य बिंदु के नीचे है।

इस कैंडलस्टिक पैटर्न में बुलिश और बेयरिश की कैंडलस्टिक्स में बहुत कम या बिना छाया वाले बड़े वास्तविक शरीर होते हैं।

इस पैटर्न के गठन की पुष्टि इस पैटर्न के अंत में एक बेयरिश कैंडलस्टिक के रूप में की जाती है।

इस पैटर्न का उपयोग कैसे करें ?

जब निवेशक डार्क क्लाउड कवर पैटर्न के साथ ट्रेड करते हैं तो कुछ विशेषताओं को देखना चाहिए:

  • सबसे पहले, ट्रेंड एक अपट्रेंड होना चाहिए, क्योंकि डार्क क्लाउड कवर पैटर्न एक बेयरिश रिवर्सल पैटर्न है।
  • दूसरी बात, कैंडलस्टिक की लंबाई बल को निर्धारित करने में महत्वपूर्ण भूमिका निभाती है जिसके साथ रिवर्सल होगा।
  • तीसरी बात, बुलिश और बेयरिश कैंडलस्टिक्स के बीच का अंतर बताता है कि ट्रेंड रिवर्सल कितना शक्तिशाली होगा।
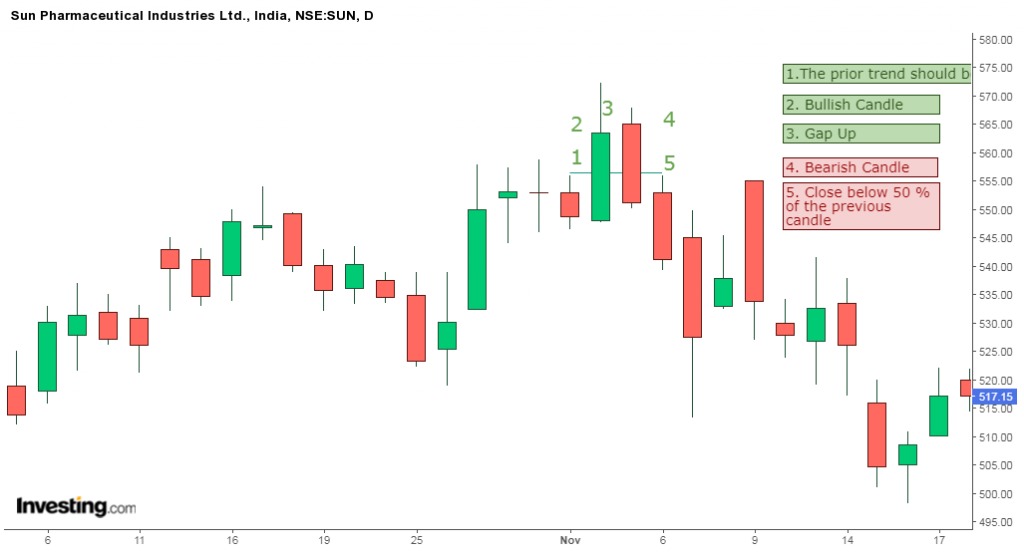
  • चौथा, बेयरिश कैंडलस्टिक को पिछले बुलिश कैंडलस्टिक के मध्य बिंदु से अधिक पर बंद करना चाहिए।
  • अंत में, बेयरिश के साथ ही बुलिश कैंडलस्टिक में बड़े बॉडीज होने चाहिए।

सन फार्मास्युटिकल इंडस्ट्रीज लिमिटेड के दैनिक चार्ट में पियर्सिंग पैटर्न का एक उदाहरण नीचे दिया गया है।

सन फार्मास्युटिकल पैटर्न

ट्रेडिंग में डार्क क्लाउड कवर का महत्व:

ट्रेडर्स को यह पैटर्न महत्वपूर्ण लगता है क्योंकि यह अपट्रेंड के डाउनट्रेंड में उलटफेर का संकेत देता है।

इस पैटर्न के लिए दैनिक चार्ट देखना चाहिए क्योंकि कम समय-सीमा वाले चार्ट में यह पैटर्न कम महत्वपूर्ण है।

एक और कारण है कि ट्रेडर्स इस पैटर्न के साथ ट्रेड करना पसंद करते हैं, यह पैटर्न प्रतिरोध(रेजिस्टेंस) स्तर के पास होता है।

इस कैंडल के निर्माण के दौरान यदि वॉल्यूम अधिक है, तो इसके रिवर्स होने की अधिक संभावना है।

इसके अलावा, अन्य टेक्निकल एनालिसिस के साथ इस पैटर्न द्वारा दिए गए संकेतों की पुष्टि करना न भूलें।

आप स्टॉकएज ऐप का उपयोग करके अगले दिन ट्रेडिंग के लिए स्टॉक को फ़िल्टर करने के लिए टेक्निकल स्कैन का उपयोग कर सकते हैं, जो अब वेब वर्शन में भी उपलब्ध है।

आप हमारे टेक्निकल एनालिसिस पाठ्यक्रमों के माध्यम से विभिन्न टेक्निकल तकनीकों और संकेतकों के बारे में भी जान सकते हैं।

Tags: candlestick patternchart patterndark cloud coverhinditechnical analysistechnical basics
ShareTweetSend
Previous Post

Should you Invest in the Rights Issue of Shares?

Next Post

The Ultimate Guide to Trading using Average True Range

Elearnmarkets

Elearnmarkets

Elearnmarkets (ELM) is a complete financial market portal where the market experts have taken the onus to spread financial education. ELM constantly experiments with new education methodologies and technologies to make financial education effective, affordable and accessible to all. You can connect with us on Twitter @elearnmarkets.

Related Posts

Technical Analysis in Stock Trading 2
Technical Analysis

Technical Analysis in Stock Trading

May 31, 2023
6.2k
The Ultimate guide to Trading Divergences 3
Technical Analysis

The Ultimate guide to Trading Divergences

May 26, 2023
1k
Trading Psychology: Guide to Master Your Mind in 5 Steps 4
Technical Analysis

Trading Psychology: Guide to Master Your Mind in 5 Steps

May 24, 2023
3.1k
Trading Psychology: 7 Keys to Successful Trading 5
Technical Analysis

Trading Psychology: 7 Keys to Successful Trading

May 22, 2023
3k

Leave a Reply Cancel reply

Your email address will not be published. Required fields are marked *

Follow Us

Facebook-f Twitter Instagram Linkedin-in Youtube Telegram

Register on Elearnmarkets

Continue your financial learning by creating your own account on Elearnmarkets.com

Register Free Account

Download App

Categories

  • Basic Finance
  • Derivatives
  • Financial Planning
  • Fundamental Analysis
  • Technical Analysis
  • Marketshala
  • Miscellaneous

Popular On Elearnmarkets

  • Market Superheroes:
  • Vivek Bajaj
  • Chetan Panchamia
  • Ashish Kyal
  • Premal Parekh
  • Abhijit Paul
  • Jegan
  • Sivakumar Jayachadran
  • Vishal Malkan
  • Jyoti Budhia
  • Vivek Gadodia
  • Vishal Mehta
  • Piyush Chaudhry
  • Santosh Pasi
  • Gomathi Shankar
  • Market Superheroes:
  • Vivek Bajaj
  • Chetan Panchamia
  • Ashish Kyal
  • Premal Parekh
  • Abhijit Paul
  • Jegan
  • Sivakumar Jayachadran
  • Vishal Malkan
  • Jyoti Budhia
  • Vivek Gadodia
  • Vishal Mehta
  • Piyush Chaudhry
  • Santosh Pasi
  • Gomathi Shankar
  • Courses:​
  • Options Trading
  • Dow Theory
  • Momentum Trading
  • Stock Investing
  • Stock Market for Beginners
  • Harmonic Chart Patterns
  • Algo Trading
  • Elliot Wave Theory
  • Advanced Excel
  • Cryptocurrency
  • NSE Certification Course
  • Courses:​
  • Options Trading
  • Dow Theory
  • Momentum Trading
  • Stock Investing
  • Stock Market for Beginners
  • Harmonic Chart Patterns
  • Algo Trading
  • Elliot Wave Theory
  • Advanced Excel
  • Cryptocurrency
  • NSE Certification Course
  • Webinars:
  • Bank Nifty Scalping
  • Intraday Trading Strategies
  • Options Trading Strategies
  • Options selling
  • Price Action
  • Relative Strength
  • Tax Planning
  • Options Buying
  • Growth Stocks
  • Portfolio Management
  • Relative Strength Index
  • Risk Management
  • Renko Charts
  • Crude Oil
  • Traders Psychology
  • Moving Average
  • Multibagger Stocks
  • Free Learning Modules:
  • Intraday Trading
  • Options Scalping
  • Swing Trading
  • Financial Modelling
  • RSI Indicator
  • Bollinger Bands
  • Pricing of Futures
  • Personal Finance
  • Initial Public Offerings (IPO)
  • Value Investing
  • Technical Indicators
  • Candlesticks
  • Chart Patterns
  • Option Greeks
  • ELSS Funds
  • Banking and Insurance
  • Real Estate
  • Gold
  • Book Summaries:
  • Rich Dad Poor Dad
  • Psychology of Money
  • The Intelligent Investor
  • The Richest Man in Babylon
  • Think and Trade Like a Champion
  • Value Investing and Behavioural Finance
  • Trading in the Zone
  • Learn to Earn
  • Book Summaries:
  • Rich Dad Poor Dad
  • Psychology of Money
  • The Intelligent Investor
  • The Richest Man in Babylon
  • Think and Trade Like a Champion
  • Value Investing and Behavioural Finance
  • Trading in the Zone
  • Learn to Earn
  • Tools:
  • CAGR Calculator
  • SIP Calculator
  • eLearnOptions
  • Future Value Calculator
  • Present Value Calculator
  • Atal Pension Yojana
  • Cost of Delay Calculator
  • Become a Crorepati
  • Tools:
  • CAGR Calculator
  • SIP Calculator
  • eLearnOptions
  • Future Value Calculator
  • Present Value Calculator
  • Atal Pension Yojana
  • Cost of Delay Calculator
  • Become a Crorepati

© 2023 Elearnmarkets. All Rights Reserved

  • Visit Elearnmarkets
  • Courses
  • Webinars
  • Financial Guides
  • Get Free Counselling
  • Visit Elearnmarkets
  • Courses
  • Webinars
  • Financial Guides
  • Get Free Counselling

Get Elearnmarkets App

No Result
View All Result
  • Article Categories
    • Basic Finance
    • Derivatives
    • Financial Planning
    • Fundamental Analysis
    • Technical Analysis
    • Marketshala
    • Miscellaneous
  • Language
    • Hindi
    • Bengali
    • English
  • Courses
  • Webinars

© 2020 Elearnmarkets All Rights Reserved