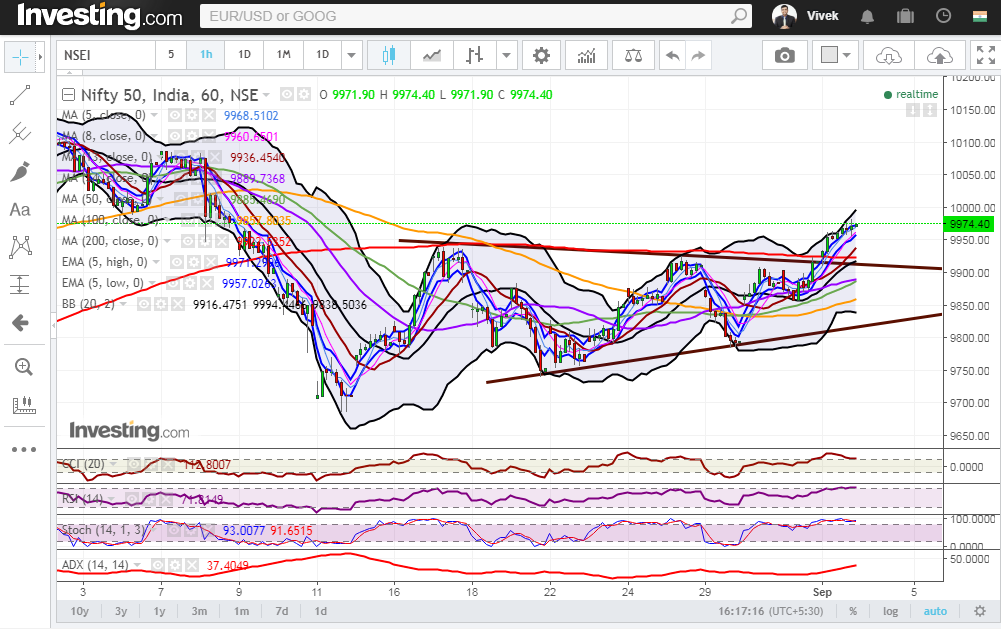
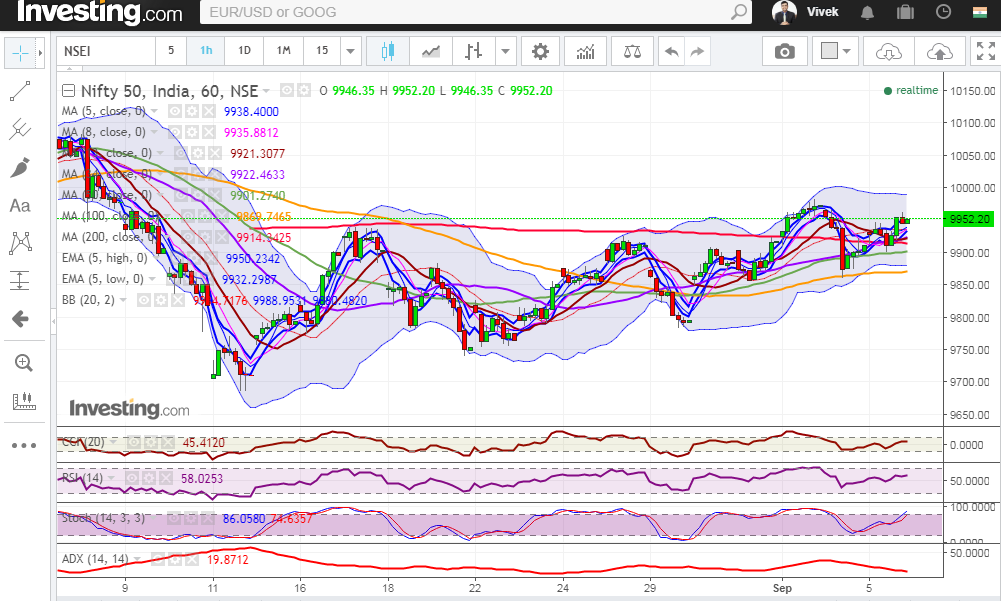
5 Powerful Bearish Candlestick Patterns
May 22, 2025
Top 9 Must Read Fundamental Analysis Books
May 27, 2025
Forex vs Stocks: Which Market Should You Trade First
May 13, 2025
How to Use Collar Option Strategy?
May 2, 2025
Parabolic SAR is a price and time based technical analysis tool which works very well in the trending market and also identifies potential reversal and stops. It is plotted on the price chart which appears as a dot just above...
CANSLIM is a techno- fundamental strategy developed by investor William O’ Neil which helps in picking quality stocks and promises potentially better returns in the future This strategy is ideal for investors who cannot hold the stocks for longer periods...
Heikin Ashi is a form of charting tool developed by Munehisa Homma in Japan in the 1700s. These candlesticks are an offshoot of Japanese candlesticks. These are visually appealing balanced candle so that you can easily filter the price of...
This triple screen trading system was developed by Dr Alexander Elder. This is a mechanism which goes through the practical examination of a stock in three different stages. In order to qualify for trading, a stock must pass through all three...
ROC Technical indicator is a non-banded oscillator. It tracks if the speed of a trend is accelerating, slowing down or maintaining the same speed. Table of Contents What is ROC Indicator? Calculation of ROC Indicator Trading Rules and Interpretation Trading...
Williams % R for Trading Strategies is a very simple but effective is a technical analysis oscillator described by Lary Williams in the year 1973. It measures the capacity of bulls and bears to close prices each day near the...
शेयर बाज़ार में ट्रेडिंग के लिए बहुत सी रणनीतियाँ (stock trading strategies) है बाजार में परन्तु यह आपको तय करना पड़ेगा की कौन सी रणनीति आपके लिए अच्छा काम करती है। ट्रेडिंग में कुछ भी सही या गलत नहीं होता,...
Key Takeaways: Developed by J. Welles Wilder, Jr. during the 1970s, helps to quantify the changes in price and their momentum. A failure swing bottom takes place when the price makes a lower low but RSI fails to make a...
The CCI indicator (oscillator) developed by Donald Lambert is a versatile and widely used indicator in technical analysis which helps in identifying overbought and oversold conditions and reversals and divergences. It also helps in taking momentum based trades. In momentum-based...
The Stochastic Indicator, developed by George C. Lane in the late 1950’s is one of the most popular members of the Oscillator family in technical analysis. It is a leading indicator as it gives us advanced signals before it is...
ভূমিকা : - আহ্নিক গতির জন্য যেমন পৃথিবীতে দিন রাত্রি হয়, সূর্যোদয়ের সাথে নতুন দিনের সূচনা হয় এবং সূর্যাস্তের সাথে আধার নেমে দিনের যবনিকা ফেলে দিয়ে রাত্রের সূচনা হয় তেমনি শেয়ার বাজারেও চাহিদা অর্থাৎ ডিমান্ড এবং সাপ্লাই অথবা যোগানের ওপর...
ভূমিকা : বিশ্ব ব্রম্ভাণ্ডের এই বিশাল জগৎ সংসারে জাগতিক নিয়মানুসারে কোনো কিছুই চিরস্থায়ী নয় |ধ্রুব সত্য যেমন পৃথিবী পশ্চিম থেকে পূর্বে ঘোরে , রোজ সকালে পূর্ব দিকে সূর্য্য ওঠে এই প্রকার বিষয়বস্তু বাদ দিয়ে সকল কিছুই নশ্বর | বিষয়বস্তু ও...
Elearnmarkets (Kredent InfoEdge Pvt. Ltd.) is a SEBI-registered Research Analyst (RA) entity (SEBI Registration No.: INH300007493). The information provided in this article is for educational and informational purposes only and should not be considered as an offer to buy or sell any securities or investment products.
The stocks, securities, and investment instruments mentioned herein are not recommendations under SEBI (Research Analysts) Regulations, 2014. Readers are advised to conduct their own due diligence and seek independent financial advice before making any investment decisions.
Investments in securities markets are subject to market risks. Please read all related documents carefully before investing. Investing in Equity Shares,
Derivatives, Mutual Funds, or other instruments carry inherent risks, including potential loss of capital. Elearnmarkets (Kredent InfoEdge Pvt. Ltd.) does not provide any guarantee or assurance of returns on any investments. Past performance is not indicative of future performance.