
Decoding BSE Groups
November 4, 2025
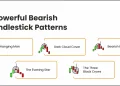
5 Powerful Bearish Candlestick Patterns
July 7, 2026
Straddle vs Strangle: Which Options Strategy Fits a Volatile Market?
September 18, 2026
Intraday trading is generally high-risk trading. Many traders believe that intraday trading is only about the right ideas and trades.Some common mistakes that are committed by the intraday traders are averaging your positions, not doing research, overtrading, following too much...
The Directional Movement Index is a technical indicator that is usually shown below the price chart and compares the recent price with the previous price range.
Point and Figure Charting is a kind of technical chart that was developed in the late 1800s. Traders can trade and also do technical analysis by using Point and Figure Charting other than the bar and candlestick charts.
Trend trading is a type of trading style which attempts to gain profits through the analysis of the ongoing trend in a particular direction.
Technical analysis refers to the analysing of the past data of the price movement and forecasting future price movements.
Bar Patterns are short term patterns that are useful for timing our trades and finding logical stop loss points. The bar patterns are similar to the candlesticks patterns and every price action trader should know the same.
Breadth Indicators help in understanding the internal strength of the market. Sometimes you will not be able to understand the direction of the market trend by just looking at the prices of the market alone.
Technical indicators are technical tools that help in analyzing the movement in the stock prices whether the ongoing trend is going to continue or reverse. It helps the traders to make entry and exit decisions of a particular stock. Technical...
The Donchian Channel is developed by Richard Donchian that is constructed by plotting a line at the high and low price of a security over a particular period of time.
Trend Analysis is an important part of technical analysis. Without understanding how to do trend analysis traders cannot do technical analysis.
Keltner Channels are a popular technical indicator that is used by day traders for analyzing the current trend and also providing trading signals.
Trend analysis is a method in Technical Analysis that helps in predicting the future movement of that is based on the current ongoing trend data.
Elearnmarkets (StockEdge Fintech Private Limited – formerly known as Kredent InfoEdge Private Limited) is a SEBI-registered Research Analyst (RA) entity (SEBI Registration No.: INH300007493). The information provided in this article is for educational and informational purposes only and should not be considered as an offer to buy or sell any securities or investment products.
The stocks, securities, and investment instruments mentioned herein are not recommendations under SEBI (Research Analysts) Regulations, 2014. Readers are advised to conduct their own due diligence and seek independent financial advice before making any investment decisions.
Investments in securities markets are subject to market risks. Please read all related documents carefully before investing. Investing in Equity Shares,
Derivatives, Mutual Funds, or other instruments carry inherent risks, including potential loss of capital. Elearnmarkets (StockEdge Fintech Private Limited – formerly known as Kredent InfoEdge Private Limited) does not provide any guarantee or assurance of returns on any investments. Past performance is not indicative of future performance.
Deliver breaking news, insightful commentary, and exclusive reports. Targeting readers who rely on our platform to stay ahead.
Contact Benzinga© 2024 Elearnmarkets All Rights Reserved