
Point and Figure Charting is a kind of technical chart that was developed in the late 1800s.
Traders can trade and also do technical analysis by using Point and Figure Charting other than the bar and candlestick charts.
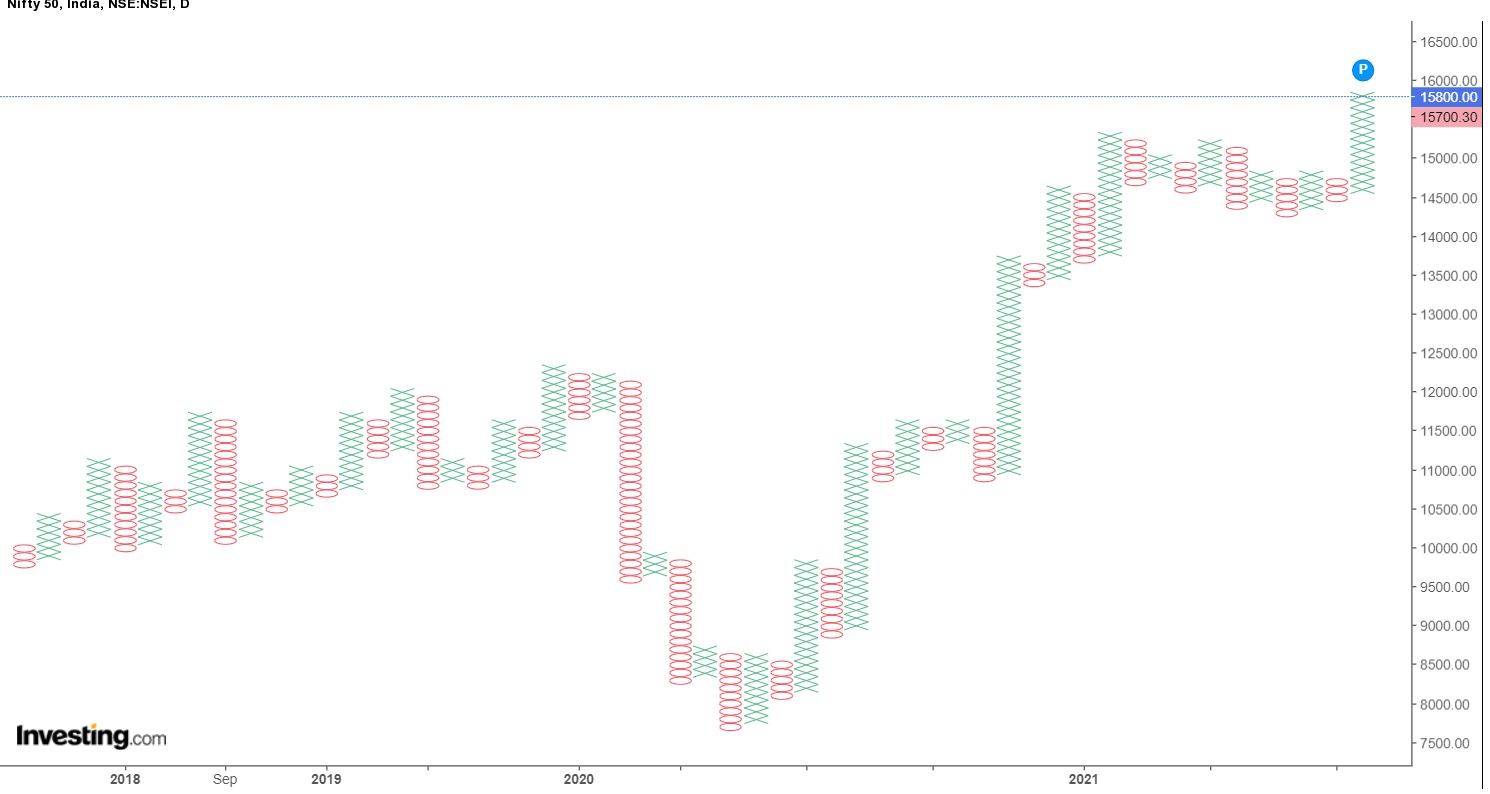
A point-and-figure chart plots movements of the prices such as stocks, commodities, or futures without considering the time.
As compared to other technical charts like candlesticks, which plot the price movement of the financial assets over set time periods, point-and-figure chart plots prices in the columns which consist of stacked X’s or O’s, each of which represents a fixed amount of price movement.
The X’s show the rising prices, while O’s shows a falling price.
- What Is a Point-and-Figure (P&F) Chart?
- How to construct a Point-and-Figure Chart?
- How to analyse a Point-and-Figure Chart?
- Point and Figure Chart Patterns:
- 2. Bearish Patterns:
- Difference between Renko and a Point-and-Figure Charting:
- Advantages of a Point-and-Figure Chart:
- Limitations of a Point-and-Figure Chart:
- Bottomline:
In this blog we will discuss about the basics of Point and Figure Charting and how traders can trade using this type of technical chart:
What Is a Point-and-Figure (P&F) Chart?
Point and Figure is a type of technical chart which is one of the oldest tools used in trading.
It was first written in the Wall Street Journal in the early 1900s by a writer and there is not one person who can claim to be known as the discoverer of this chart.
Traders used various methods for recording the price action in the early trading days. The point and figure were developed for the purpose of removing the unnecessary noise in the market.
This figure chart that showed the prices of an asset was the first to be used.
Now let us discuss how the Point and Figure Chart can be constructed:
How to construct a Point-and-Figure Chart?
The point-and-figure chart plots prices in the columns consisting of X’s or O’s, each of which represents a fixed amount of price movement.
The X’s show the rise in the prices, whereas the O’s shows a falling price as shown below:
To construct Point and Figure chart, we need three main components:
1. A box size parameter:
The box size can be a specific amount, such as, a percentage, like 3% of the current price, or can be based on an average true range (ATR) which means the box size will fluctuate based on volatility.
The box size can be determined by:
- Percentage box scaling that uses box sizes which are a fixed percentage of the stock’s price. For example, if a chart uses 3% scaling and the stock’s price is Rs. 100, then the box size will be Rs. 3.00.
- Average True Range that uses the box size based on the daily Average True Range (ATR). The default is usually set at 20 days.
- User-Defined box scaling allows users to set the box size. Larger box size will result in more price movements and also fewer reversals. A smaller box size will result in fewer price movements and more reversals.
2. Reversal Parameter:
The reversal amount is usually three times the box size. For example, if the box size is Rs 1, then the reversal amount is Rs. 3. The reversal amount can be set at any amount which the trader desires, such as one time or 5.5 times the box size.
3. The Price Data:
Traders can also set high and low prices or use closing prices. By using high and low prices it will mean the creation of more X’s and O’s, whereas using only closing prices will mean fewer X’s and O’s are created.
How to analyse a Point-and-Figure Chart?
Just like the candlesticks and bar charts we can use technical indicators like moving averages, supports, resistance and chart patterns to analyse the price movements on the Point and Figure Charts.
Traders should look for four things on a Point & Figure chart:
- Support levels
- Resistance levels
- Upward trend lines
- Downward trend lines
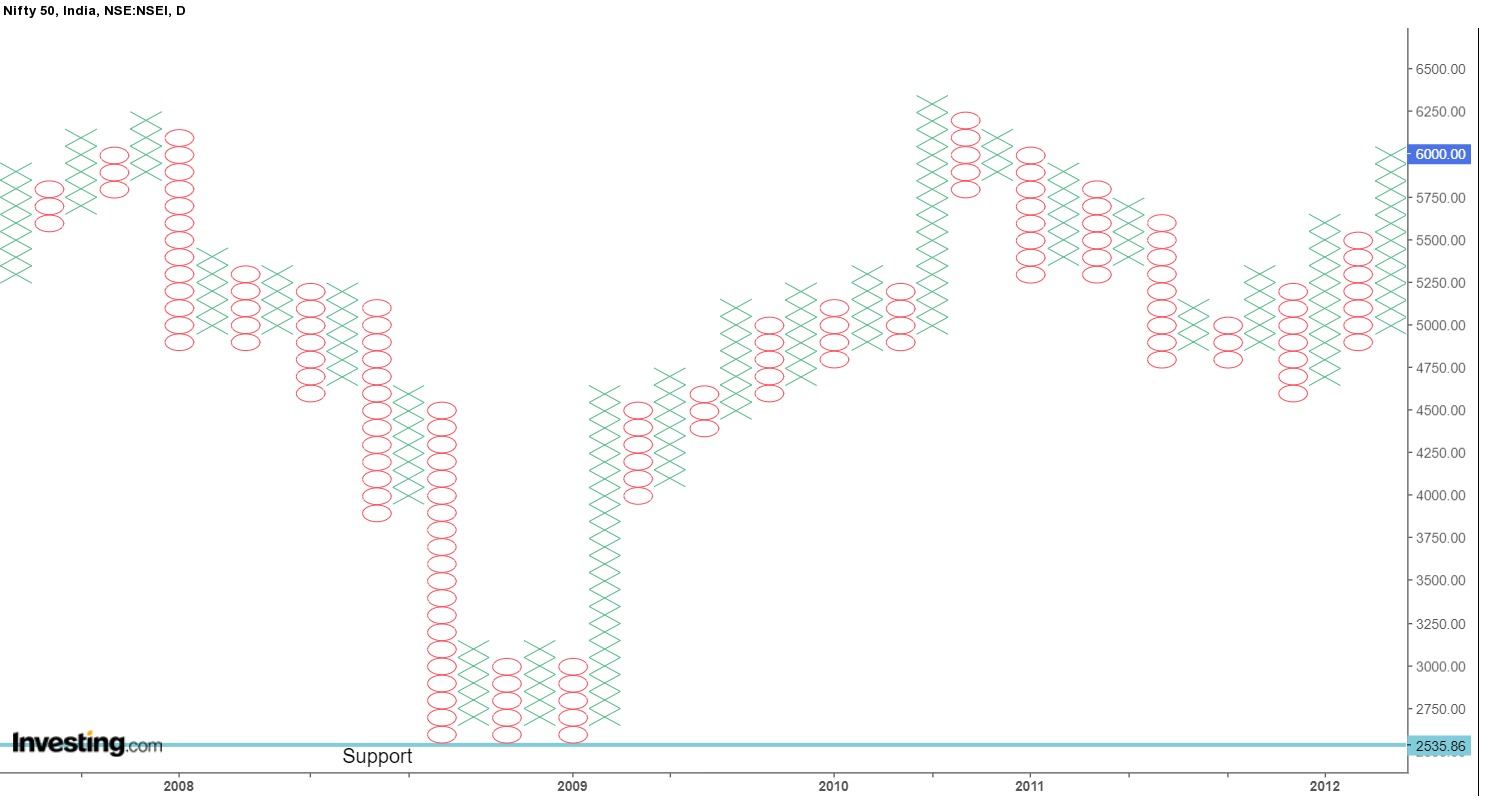
Support levels are easy to spot on Point and Figure charts. Traders can draw a horizontal line at the low of a sequence of O-Columns with equal lows.
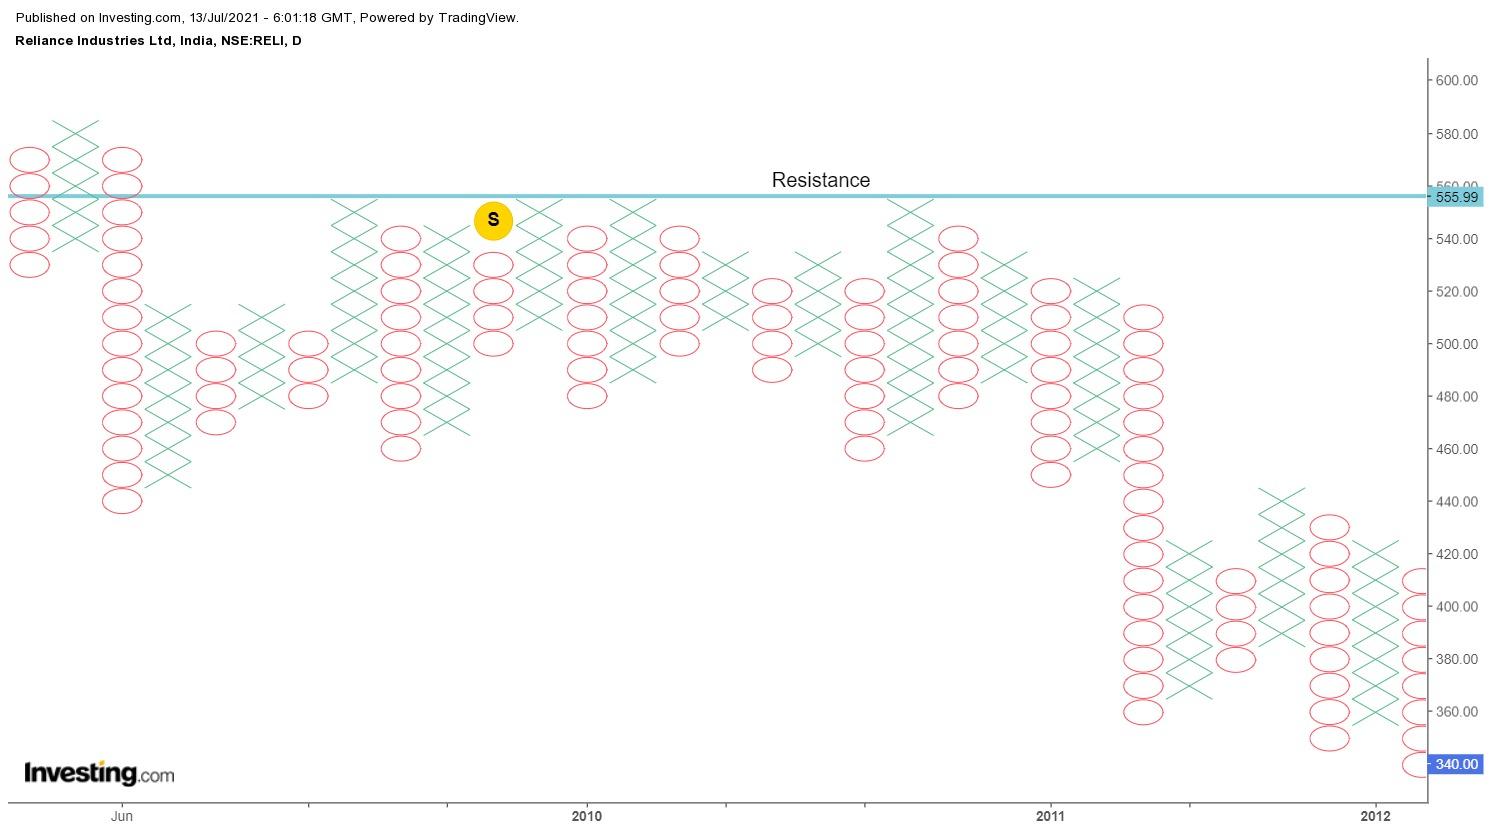
Traders can draw a horizontal Resistance line at the high of a sequence of X-Columns with equal highs.
In Point and figure charts, an upward-sloping trend line is known as the Bullish Support Line, whereas a downward-sloping trend line is known as the Bearish Resistance Line as shown below:
Point and Figure Chart Patterns:
The Point and Figure charts patterns can be bullish or bearish chart patterns:
1. Bullish Patterns:
Below are the main bullish patterns which help to analyse breakout on the Point and Figure charts:
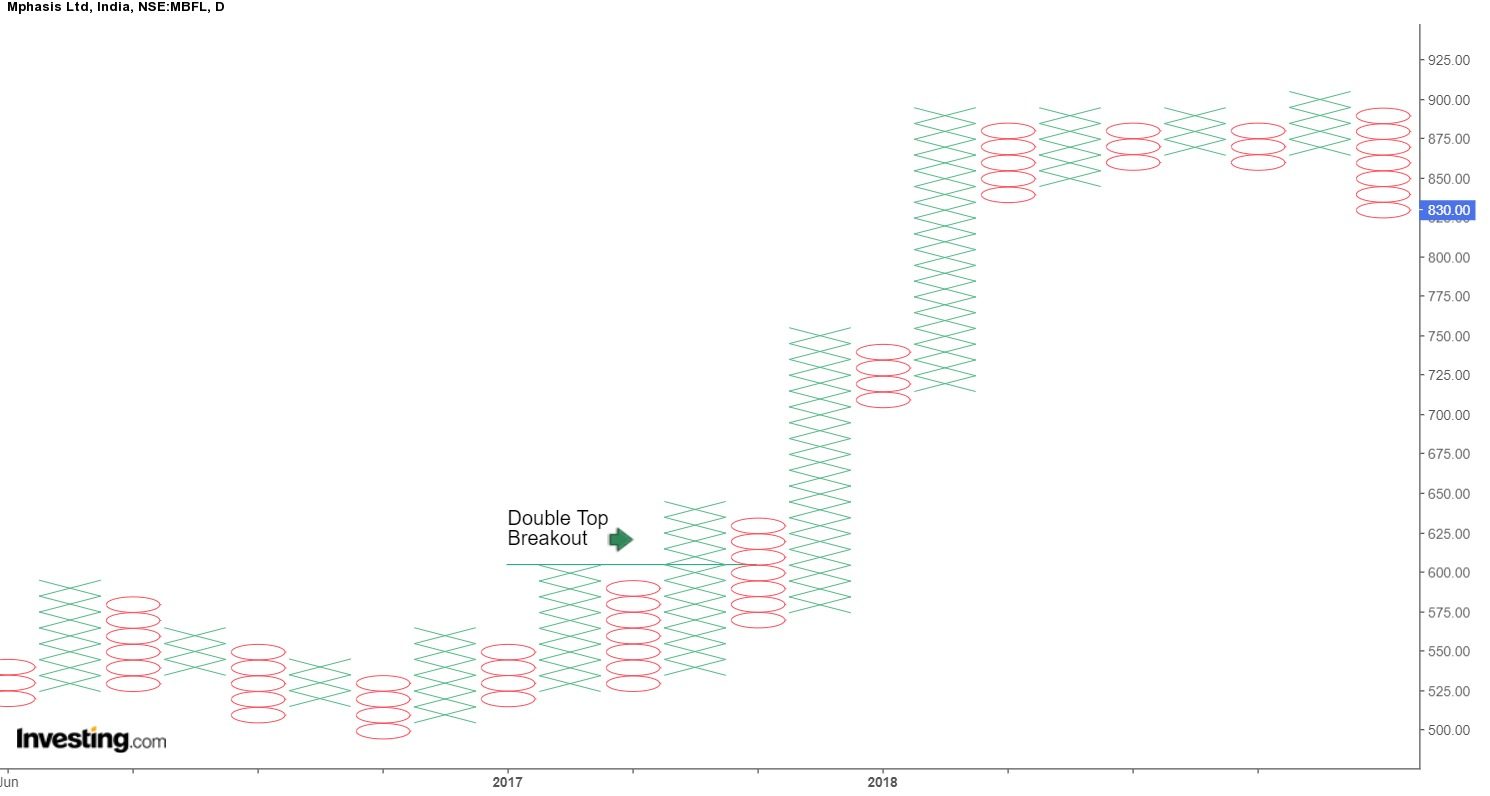
1. Double Top Breakout:
In the Point and Figure charts, Double Top Breakouts are bullish whereas with the bar charts Double Top Breakouts are bearish patterns.
In the Point and Figure chart, the buy signal is when an X-Column breaks above the high of the prior X-Column. These two columns are separated by an O-Column as shown below:
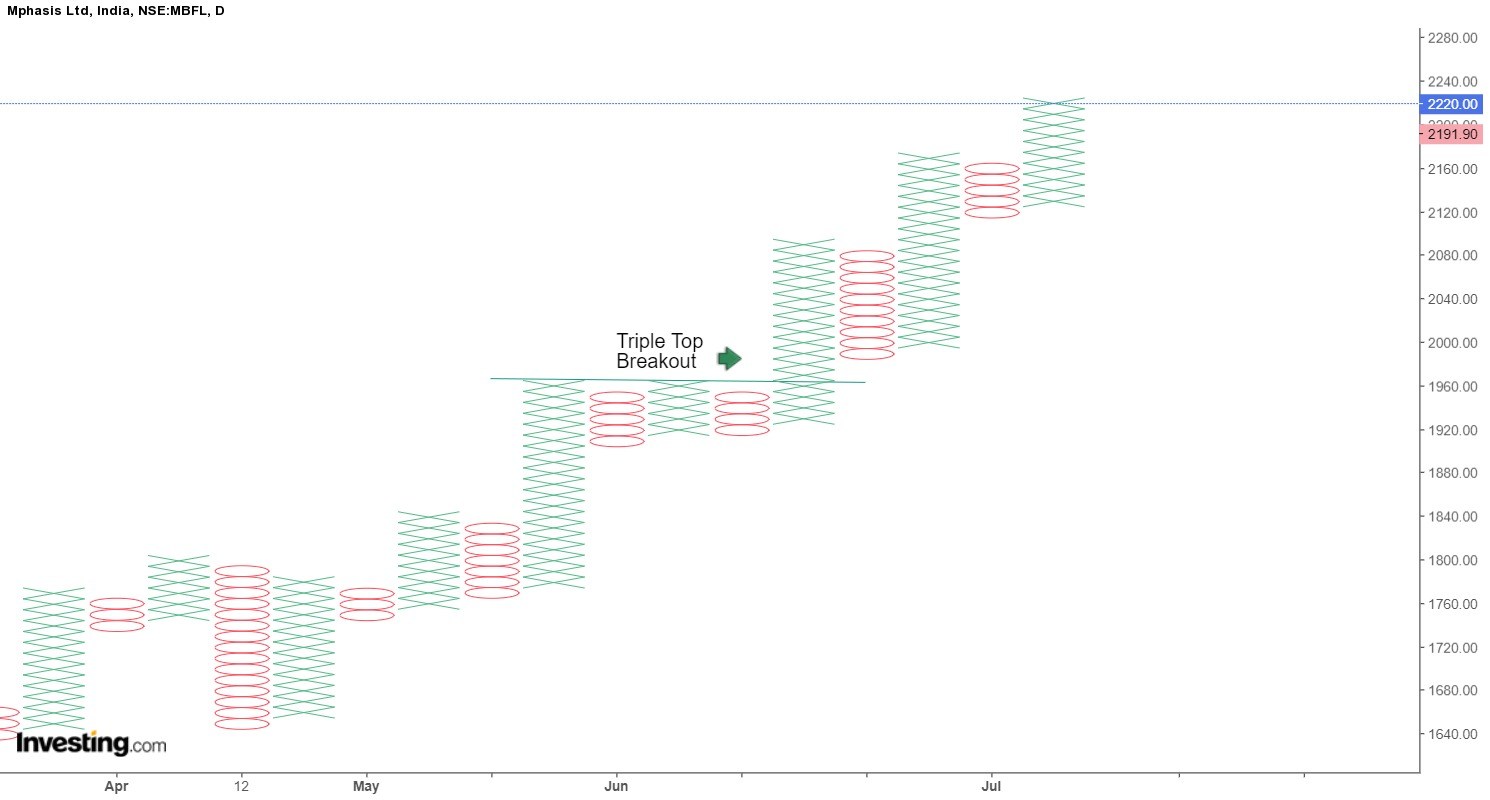
2. Triple Top Breakout:
In the Triple Top Breakout, there is one more column of X as compared to the Double Top Breakout. The third X-Column breaks above the prior two X-Columns to make the Triple Top Breakout as shown below:
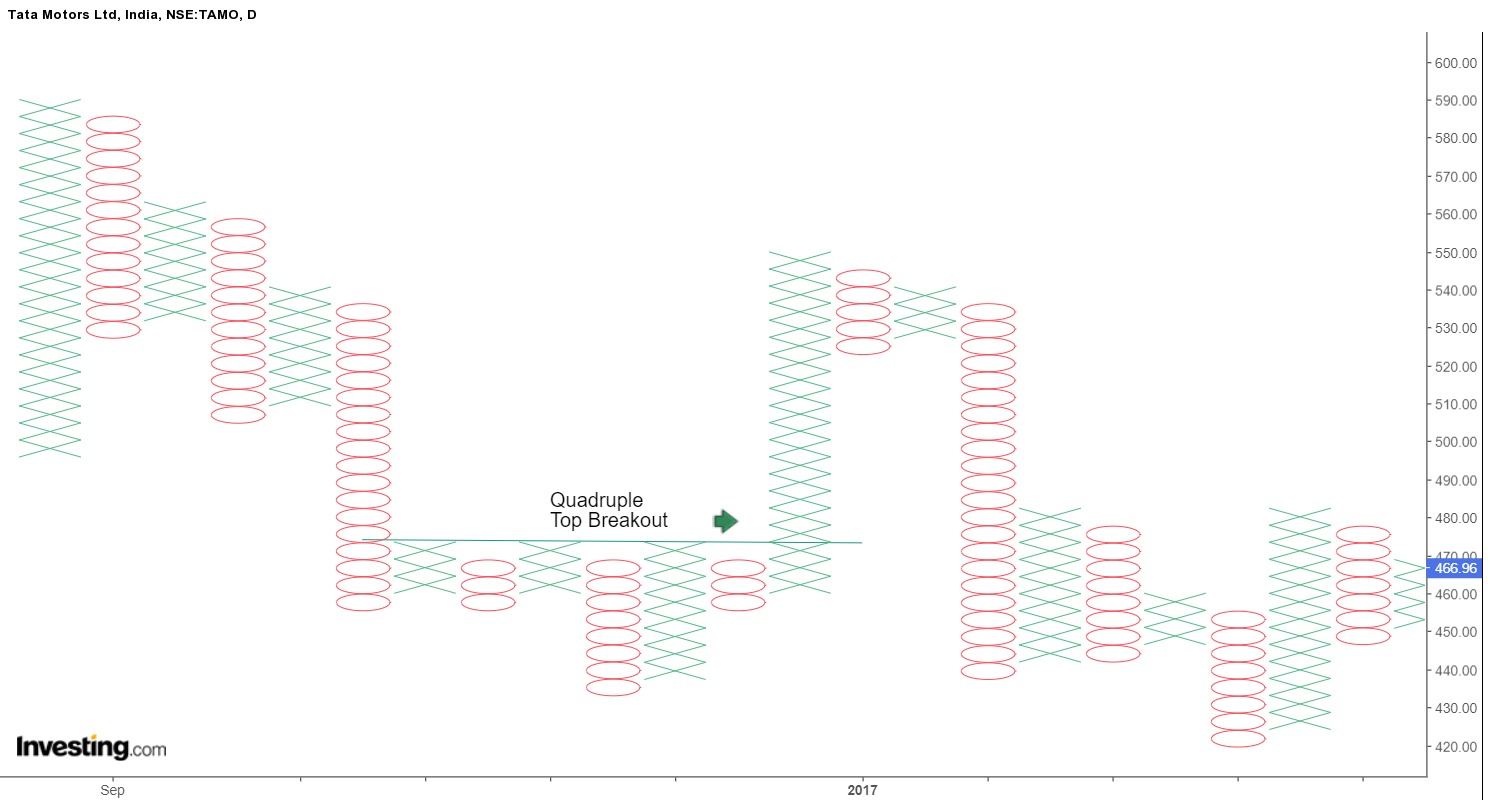
3. Quadruple Top Breakout:
The Quadruple Top Breakout is the same as the Triple Top Breakout, only with an extra X-Column and an O-Column for widening the pattern. The breakout from the fourth column of X confirms the Quadruple Top Breakout as shown below:
2. Bearish Patterns:
Below are the main bearish patterns which help to analyse breakout on the Point and Figure charts:
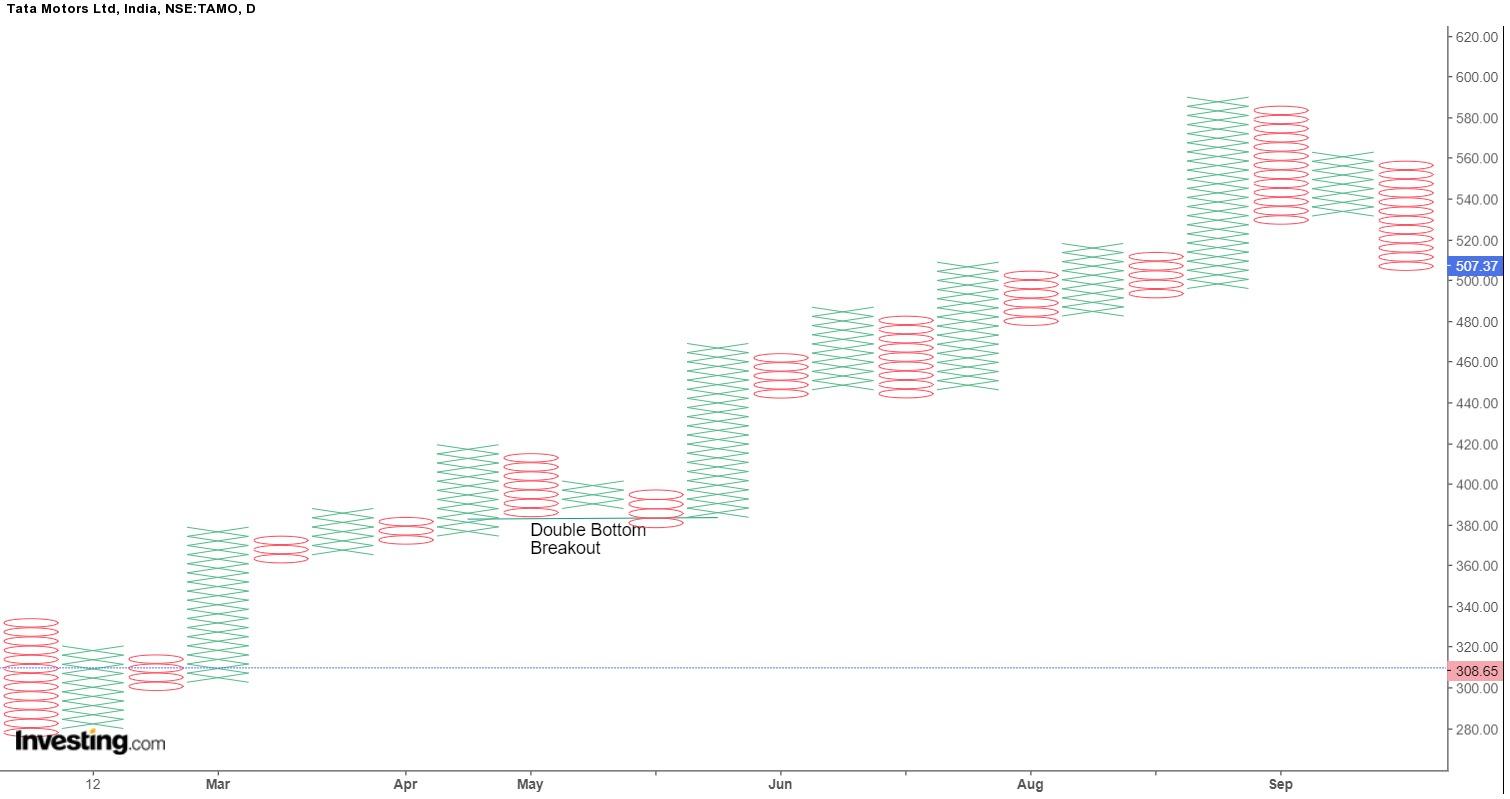
1. Double Bottom Breakout:
In the Point and Figure charts, Double Bottom Breakouts are bearish whereas with the bar charts Double Bottom Breakouts are bullish patterns.
In the Point and Figure chart, the sell signal is when the O-Column breaks below the low of the prior O-Column. These two columns are separated by X-Column as shown below:
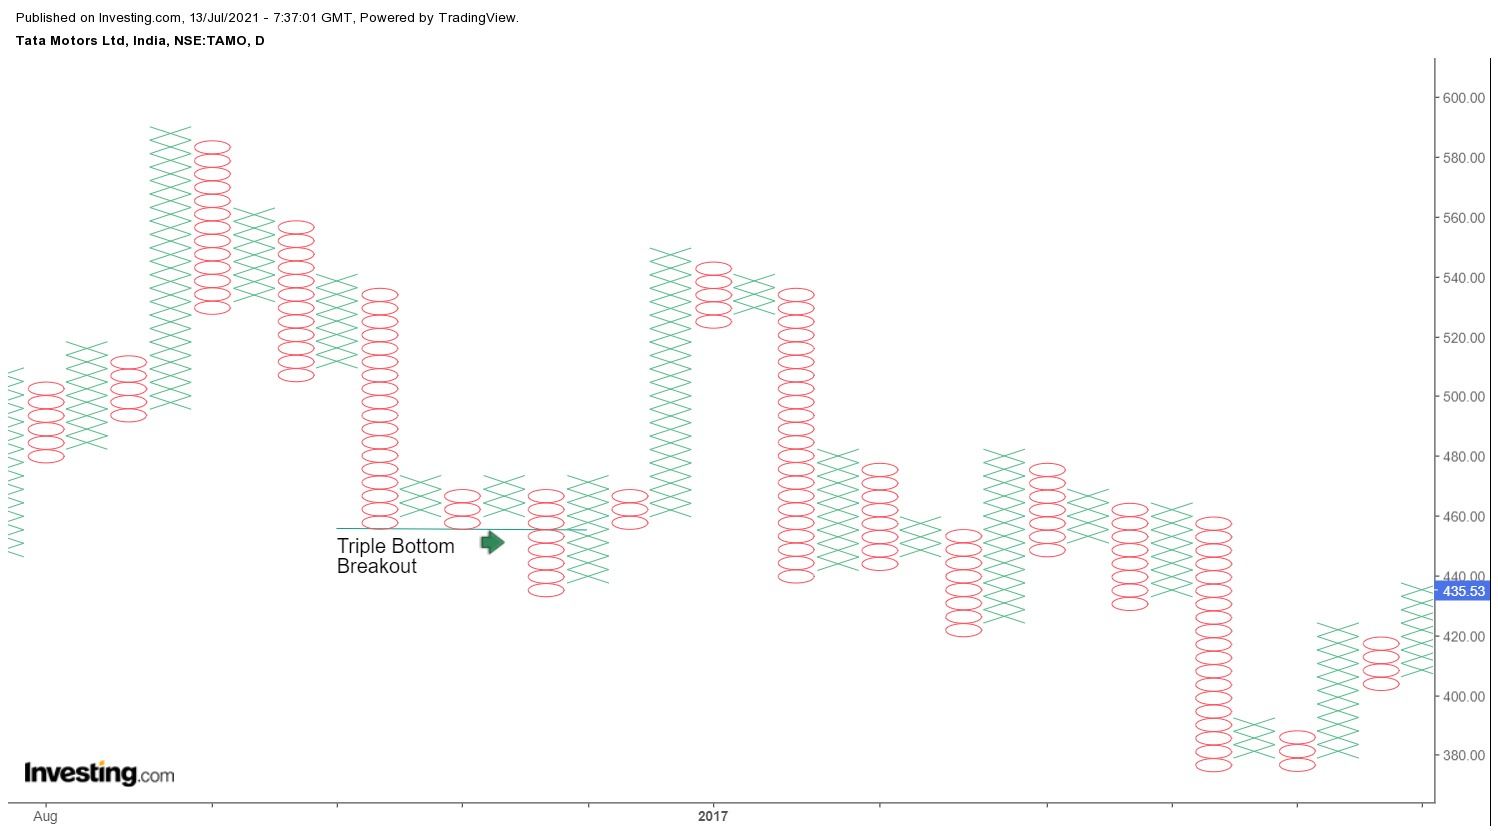
2. Triple Bottom Breakout:
In the Triple Top Breakout, there is one more column of O as compared to the Triple Bottom Breakout. The third O-Column breaks below the prior two O-Columns to make the Triple Bottom Breakout as shown below:
3. Quadruple Bottom Breakout:
The Quadruple Bottom Breakout is the same as the Triple Bottom Breakout, only with an extra O-Column and an X-Column for widening the pattern. The breakout from the fourth column of X confirms the Quadruple Bottom Breakout.
Difference between Renko and a Point-and-Figure Charting:
Renko Charts also uses box size, and when the price moves by the specific box size it creates an up or down brick that moves at a 45-degree angle.
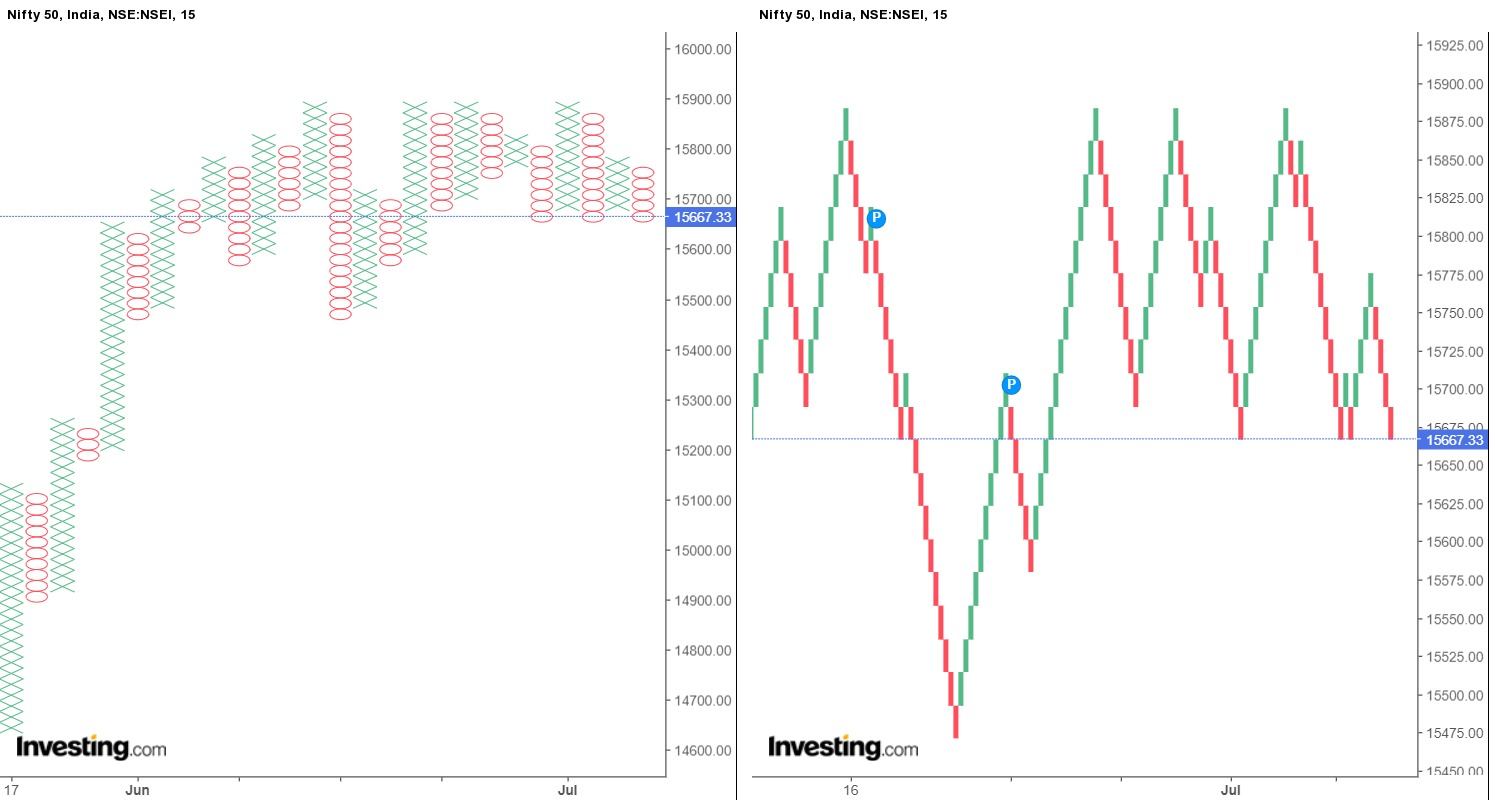
The main difference between the Point and Figure and the Renko charts is the chart type. Point and Figures charts have side-by-side columns of X’s and O’s, whereas a Renko chart is created by a series of boxes which are spread out over time at 45-degree angles as shown below:
Advantages of a Point-and-Figure Chart:
As the Point and Figure charts are one-dimensional i.e. focused only on price changes and not time, it offers many benefits to the traders as well as the analysts.
Below are its benefits:
- It helps in filtering out market noise from the charts.
- It provides easy visualization of support and resistance levels.
- It is a timeless tool for price movement analysis.
- It also helps a trader in focusing on the important price movements.
Limitations of a Point-and-Figure Chart:
One of the main limitations of Point and Figure charts is that it reacts slowly to the price changes.

For example, a breakout must move the box amount for signalling a breakout to occur. This may benefit some traders as it reduces false breakout signals, but the price has already moved the box amount (or more) beyond the breakout point.
So, for some traders, getting the signal after the price has moved may not be that effective for their trading.
Bottomline:
Point and Figure charts are good for analysing strong trends, as a lot of small counter-trend movements are cut out. When traders use Point and Figure charts, they should also watch the actual price of the asset for reducing risk. This can be done by analysing candlestick or bar charts.
Happy Investing!
For more stock related queries visit web.stockedge.com


