Elearnmarkets - Financial Market Learning
  • Categories
    • Basic Finance
    • Derivatives
      • Futures
      • Options
    • Financial Planning
    • Fundamental Analysis
    • Technical Analysis
    • Marketshala
    • Miscellaneous
  • Language
    • English
    • Hindi
    • Bengali
No Result
View All Result
  • Courses
  • Webinars
  • Stories
Elearnmarkets - Learn Stock Market, trading, investing for Free
No Result
View All Result
Home Technical Analysis
778_ELM_Blog Image_01

How can I make Profit from Technical Analysis of Stocks consistently?

Elearnmarkets by Elearnmarkets
November 19, 2021
in Technical Analysis, Charts, Patterns & Indicators
Reading Time: 5 mins read
0
4.1k
VIEWS
Share on FacebookShare on XShare on WhatsApp

Are you worried that technical analysis of stocks may be too difficult and “technical” for you? That its only for the experts and professionals?

The answer is No.

Table of Contents
What is Technical Analysis of Stocks?
Apply various types of Technical Indicators
Identify High Probability Trading Opportunities
Identify Master Chart and Bar Patterns
Trading Psychology
Money Management
Bottomline

Technical analysis is not so complex or it cannot be done only by experts or professionals. Anyone can make money out of the technical analysis. In this article let us discuss how one can make profits from technical analysis of stocks consistently.

What is Technical Analysis of Stocks?

It is important to understand the indicators, the positioning of various patterns, and various tools. It is even more important to become aware about the importance of adopting money management practices and also dealing with psychology.

Most traders fail to profit from the technical analysis because they are in a hurry in implementing the indicators and patterns rather than having the patience to first understand those patterns and indicators. Learning about the Technical Analysis of stocks will help the investors to understand the core logic behind its mechanism and also help you to identify which patterns to trade and which ones to avoid.

Apply various types of Technical Indicators

One should always choose a combination of 2-3 technical indicators. We should not rely on only one indicator as sometimes the indicator gives us a false signal. We should remember that technical indicators only confirm the price movements. These false signals given by these indicators can be avoided by using price actions and other technical indicators.

Identify High Probability Trading Opportunities

 Every investor wants to find high profitability trading setups, but the thing is they don’t know-how. Instead of looking at the prices, you are looking at indicators without understanding their purpose.

RelatedPosts

5 Powerful Bearish Candlestick Patterns 1

5 Powerful Bearish Candlestick Patterns

November 30, 2023
98k
5 Powerful Bullish Candlestick Patterns 2

5 Powerful Bullish Candlestick Patterns

November 30, 2023
135.2k
All 35 Candlestick Chart Patterns in the Stock Market-Explained 3

All 35 Candlestick Chart Patterns in the Stock Market-Explained

November 27, 2023
2.1M

Instead of following trends, you are predicting market reversals. Instead of proper risk management, you are putting huge bet as the trade feels good.

Learn trading Psychology with Trading for Living in just 2 hours by Market Experts

If you are doing any of the above then it will be difficult to find high profitability trade. One of the simplest ways to identify high profitability trading setups is to follow the trend.

“Trade in the direction of the general market. If it’s rising you should belong, if it’s falling you should be short.”  – Jesse Livermore

When the price is in an uptrend, one should stay long. When the price is in a downtrend one should be short.

nifty 50

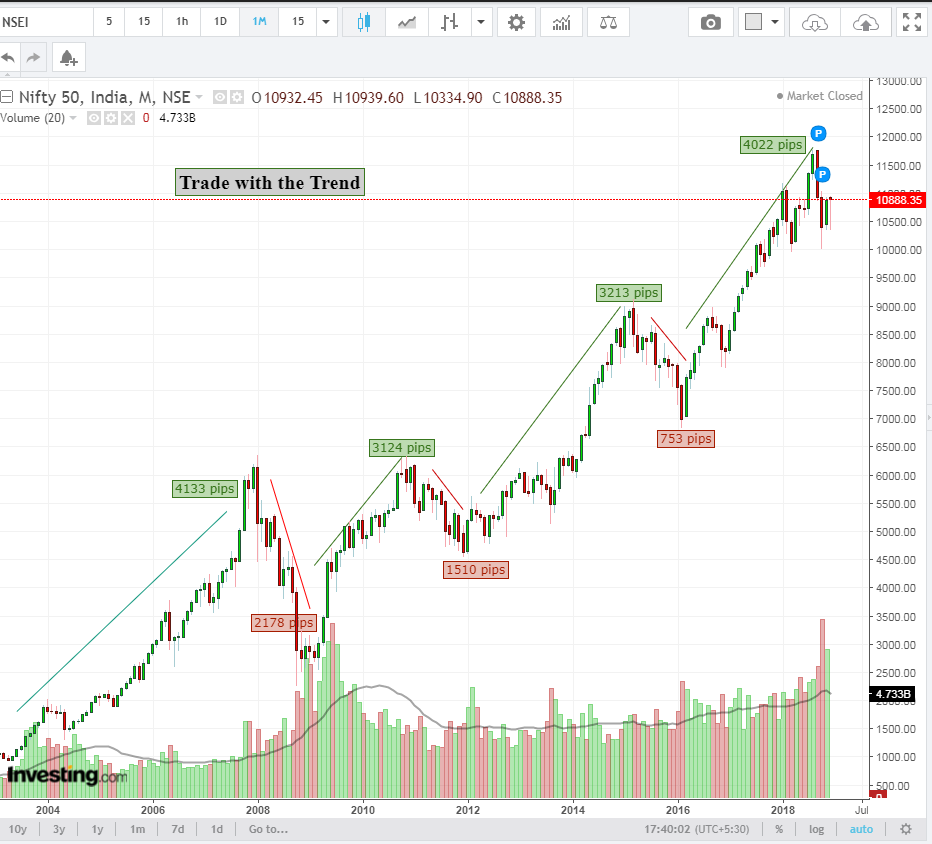
By trading with trends we can see that the bullish move (green) goes much in our favor compared to the corrective move (red).

Identify Master Chart and Bar Patterns

Every day we have to choose among a hundred trading opportunities. This is because a wide range of factors affects the market. Therefore it is important to use technical analysis to succeed in trading with the candlestick and other patterns.

Chart patterns form an important part of trading. These patterns provide a clear picture and also give us trading signs of future price movements. The best patterns are those which form the backbone of a profitable trading strategy.

RSI, volume, support, and resistance levels confirm these patterns. Stock chart patterns play a crucial role in identifying breakouts and trend reversals. This is because history has a habit to repeat itself and the financial markets are no exception.

navin technical analysis of stocks

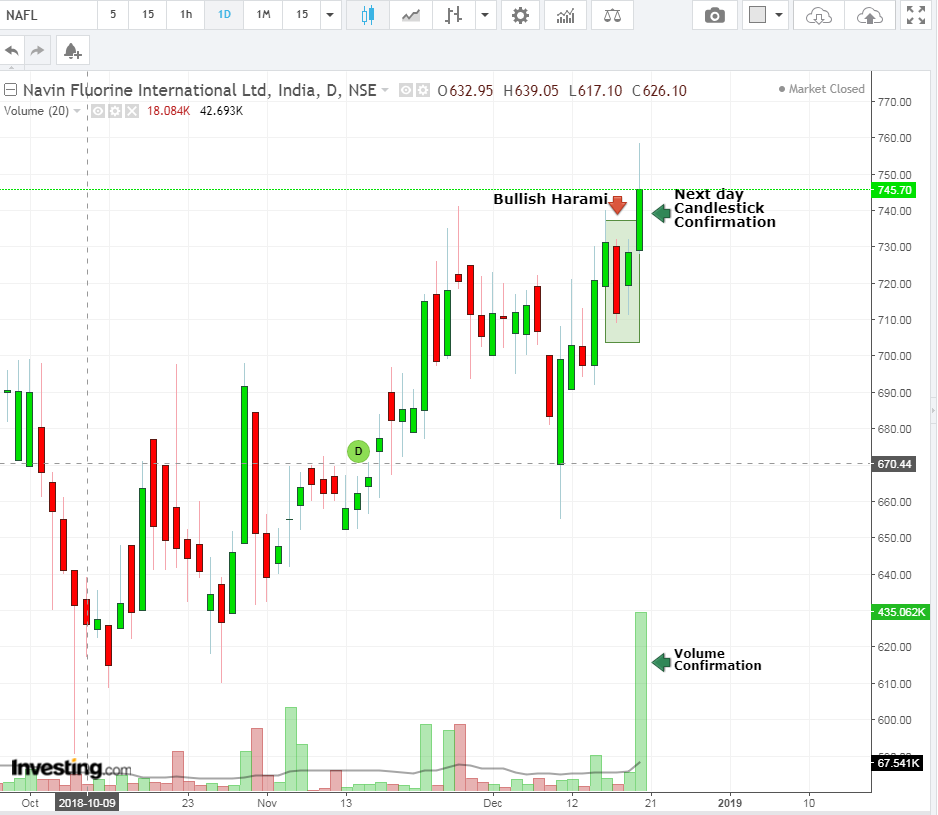
From the chart above we can see how a candlestick pattern, “Bullish Harami” gave a bullish signal with volume confirmation.

Trading Psychology:

Trading psychology is very important for traders due to their quick decisions often dart in and out of stocks on short notice.  In order to accomplish this, they need a certain peace of mind.  They need discipline so that they stick to their established trading plans and know when to book profits and losses.

Money Management:

Money management is an important element in trading after trading psychology. But novice traders often neglect and only focus on technical analysis. But in order to survive in the stock market, you must know the basics of the share market and to manage capital.

Capital is the determining factor of our trading. The more we have the more possibilities we have to develop and the more we can spread out the risks. Our capital should be considered in the same way as business capital.

Bottomline

As discussed above we can see how simple candlestick patterns and trends can give us signals. If we learn about technical analysis and implement it in a simple way, we can consistently make profits from technical analysis.

Tags: candlestick patternenglishtechnical analysistechnical indicators
ShareTweetSend
Get Kotak Offer Get Kotak Offer Get Kotak Offer
Previous Post

Problems in Technical Analysis and How to Overcome Them

Next Post

Learn, How to Read Balance Sheet

Elearnmarkets

Elearnmarkets

Elearnmarkets (ELM) is a complete financial market portal where the market experts have taken the onus to spread financial education. ELM constantly experiments with new education methodologies and technologies to make financial education effective, affordable and accessible to all. You can connect with us on Twitter @elearnmarkets.

Related Posts

5 Powerful Bearish Candlestick Patterns 4
Technical Analysis

5 Powerful Bearish Candlestick Patterns

November 30, 2023
98k
5 Powerful Bullish Candlestick Patterns 5
Technical Analysis

5 Powerful Bullish Candlestick Patterns

November 30, 2023
135.2k
All 35 Candlestick Chart Patterns in the Stock Market-Explained 6
Charts, Patterns & Indicators

All 35 Candlestick Chart Patterns in the Stock Market-Explained

November 27, 2023
2.1M
Super Successful Techno Funda Stock Market Strategy 7
Fundamental Analysis

Super Successful Techno Funda Stock Market Strategy

November 28, 2023
1.4k

Leave a Reply Cancel reply

Your email address will not be published. Required fields are marked *

Elearnmarkets Logo

Follow Us

Facebook-f Twitter Instagram Linkedin-in Youtube Telegram

Register on Elearnmarkets

Continue your financial learning by creating your own account on Elearnmarkets.com

Register Free Account

Download App

Playstore logo
Download on app store

Categories

  • Basic Finance
  • Derivatives
  • Financial Planning
  • Fundamental Analysis
  • Technical Analysis
  • Marketshala
  • Miscellaneous

Popular On Elearnmarkets

  • Market Superheroes:
  • Vivek Bajaj
  • Chetan Panchamia
  • Ashish Kyal
  • Premal Parekh
  • Abhijit Paul
  • Jegan
  • Sivakumar Jayachadran
  • Vishal Malkan
  • Jyoti Budhia
  • Vivek Gadodia
  • Vishal Mehta
  • Piyush Chaudhry
  • Santosh Pasi
  • Gomathi Shankar
  • Market Superheroes:
  • Vivek Bajaj
  • Chetan Panchamia
  • Ashish Kyal
  • Premal Parekh
  • Abhijit Paul
  • Jegan
  • Sivakumar Jayachadran
  • Vishal Malkan
  • Jyoti Budhia
  • Vivek Gadodia
  • Vishal Mehta
  • Piyush Chaudhry
  • Santosh Pasi
  • Gomathi Shankar
  • Courses:​
  • Options Trading
  • Dow Theory
  • Momentum Trading
  • Stock Investing
  • Stock Market for Beginners
  • Harmonic Chart Patterns
  • Algo Trading
  • Elliot Wave Theory
  • Advanced Excel
  • Cryptocurrency
  • NSE Certification Course
  • Courses:​
  • Options Trading
  • Dow Theory
  • Momentum Trading
  • Stock Investing
  • Stock Market for Beginners
  • Harmonic Chart Patterns
  • Algo Trading
  • Elliot Wave Theory
  • Advanced Excel
  • Cryptocurrency
  • NSE Certification Course
  • Webinars:
  • Bank Nifty Scalping
  • Intraday Trading Strategies
  • Options Trading Strategies
  • Options selling
  • Price Action
  • Relative Strength
  • Tax Planning
  • Options Buying
  • Growth Stocks
  • Portfolio Management
  • Relative Strength Index
  • Risk Management
  • Renko Charts
  • Crude Oil
  • Traders Psychology
  • Moving Average
  • Multibagger Stocks
  • Free Learning Modules:
  • Intraday Trading
  • Options Scalping
  • Swing Trading
  • Financial Modelling
  • RSI Indicator
  • Bollinger Bands
  • Pricing of Futures
  • Personal Finance
  • Initial Public Offerings (IPO)
  • Value Investing
  • Technical Indicators
  • Candlesticks
  • Chart Patterns
  • Option Greeks
  • ELSS Funds
  • Banking and Insurance
  • Real Estate
  • Gold
  • Book Summaries:
  • Rich Dad Poor Dad
  • Psychology of Money
  • The Intelligent Investor
  • The Richest Man in Babylon
  • Think and Trade Like a Champion
  • Value Investing and Behavioural Finance
  • Trading in the Zone
  • Learn to Earn
  • Book Summaries:
  • Rich Dad Poor Dad
  • Psychology of Money
  • The Intelligent Investor
  • The Richest Man in Babylon
  • Think and Trade Like a Champion
  • Value Investing and Behavioural Finance
  • Trading in the Zone
  • Learn to Earn
  • Tools:
  • CAGR Calculator
  • SIP Calculator
  • eLearnOptions
  • Future Value Calculator
  • Present Value Calculator
  • Atal Pension Yojana
  • Cost of Delay Calculator
  • Become a Crorepati
  • Tools:
  • CAGR Calculator
  • SIP Calculator
  • eLearnOptions
  • Future Value Calculator
  • Present Value Calculator
  • Atal Pension Yojana
  • Cost of Delay Calculator
  • Become a Crorepati

© 2023 Elearnmarkets. All Rights Reserved

  • Visit Elearnmarkets
  • Courses
  • Webinars
  • Financial Guides
  • Get Free Counselling
  • Visit Elearnmarkets
  • Courses
  • Webinars
  • Financial Guides
  • Get Free Counselling

Get Elearnmarkets App

No Result
View All Result
  • Article Categories
    • Basic Finance
    • Derivatives
    • Financial Planning
    • Fundamental Analysis
    • Technical Analysis
    • Marketshala
    • Miscellaneous
  • Language
    • Hindi
    • Bengali
    • English
  • Courses
  • Webinars
  • Stories

© 2020 Elearnmarkets All Rights Reserved

A Handbook of Technical Analysis
To start your trading journey as a seasoned technical analyst
Download Now
Guidebook On Chart Patterns
Take Your Trading To The Next Level With Strategies Shared In This Ebook
Download Now