Elearnmarkets - Financial Market Learning
  • Courses
  • Webinars
  • Stories
  • Language
    • English
    • Hindi
    • Bengali
No Result
View All Result
Get Free Course
  • Basic Finance
  • Derivatives
    • Futures
    • Options
  • Financial Planning
  • Fundamental Analysis
  • Technical Analysis
  • Mutual Funds
  • Marketshala
  • Miscellaneous
Elearnmarkets - Learn Stock Market, trading, investing for Free
  • Courses
  • Webinars
  • Stories
  • Language
    • English
    • Hindi
    • Bengali
No Result
View All Result
Get Free Course
Elearnmarkets - Learn Stock Market, trading, investing for Free
No Result
View All Result
Home Technical Analysis
5 Tools to Spot Trend Reversals in Stocks 1

5 Tools to Spot Trend Reversals in Stocks

Vivek Bajaj by Vivek Bajaj
April 26, 2024
in Technical Analysis
Reading Time: 7 mins read
0
11.5k
VIEWS
Share on FacebookShare on XShare on WhatsApp

A trend is a significant market state, so every trader must understand trends thoroughly. No trend lasts forever: there will always be a point at which the direction you are trading reverses, and a new trend begins. Technical analysis can tell a trader if a trend is about to change direction or confirm a trend reversal.

A trader needs to be aware of an impending reversal for two reasons. If a trader already has a position on a trend, they want to exit it before it reverses. Second, a reversal occurs when a new trend emerges. You can join if you correctly read the market and spot it quickly.

The likelihood of a reversal is heavily influenced by the strength of the current trend: if the trend is weak, the reversal is more likely. There are several methods for estimating the strength of a trend. We can suggest two approaches: visual analysis and technical indicators.

So, in today’s blog, let us discuss some methods that will help you identify trend reversals in stocks:

Table Of Contents
  1. 5 Tools to Spot Trend Reversals in Stocks
    • 1. Visual Analysis 
    • 2. Moving AveragesIchimoku 
    • 3. Average Directional Index
    • 4. Volume Indicators
    • 5. Sushi Roll Reversal Pattern
  2. How do you find the trend reversal of a stock?
  3. How to identify trend reversal in Nifty?
  4. What are the indicators for stock price reversal?

5 Tools to Spot Trend Reversals in Stocks

1. Visual Analysis 

One should examine the highs and lows of a trend. The trend is strong if the corrections are brief and the consolidations form in narrow ranges. Price strictly respects the first support formed at the previous highs in a strong bullish trend:

5 Tools to Spot Trend Reversals in Stocks 2

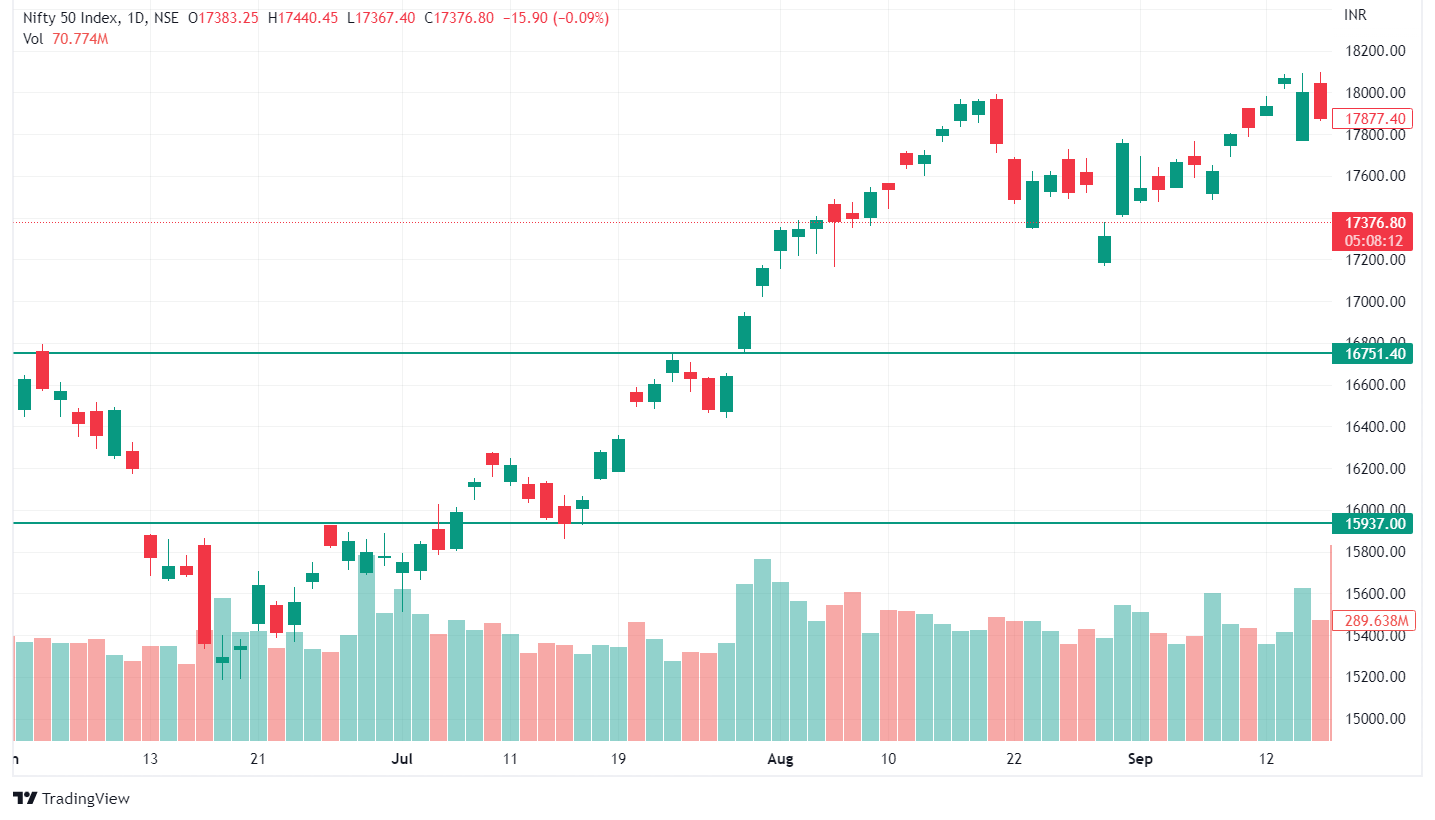
During a slow uptrend, the price may fall below the previous high (the initial support) but remain above the previous low.

trend reversal

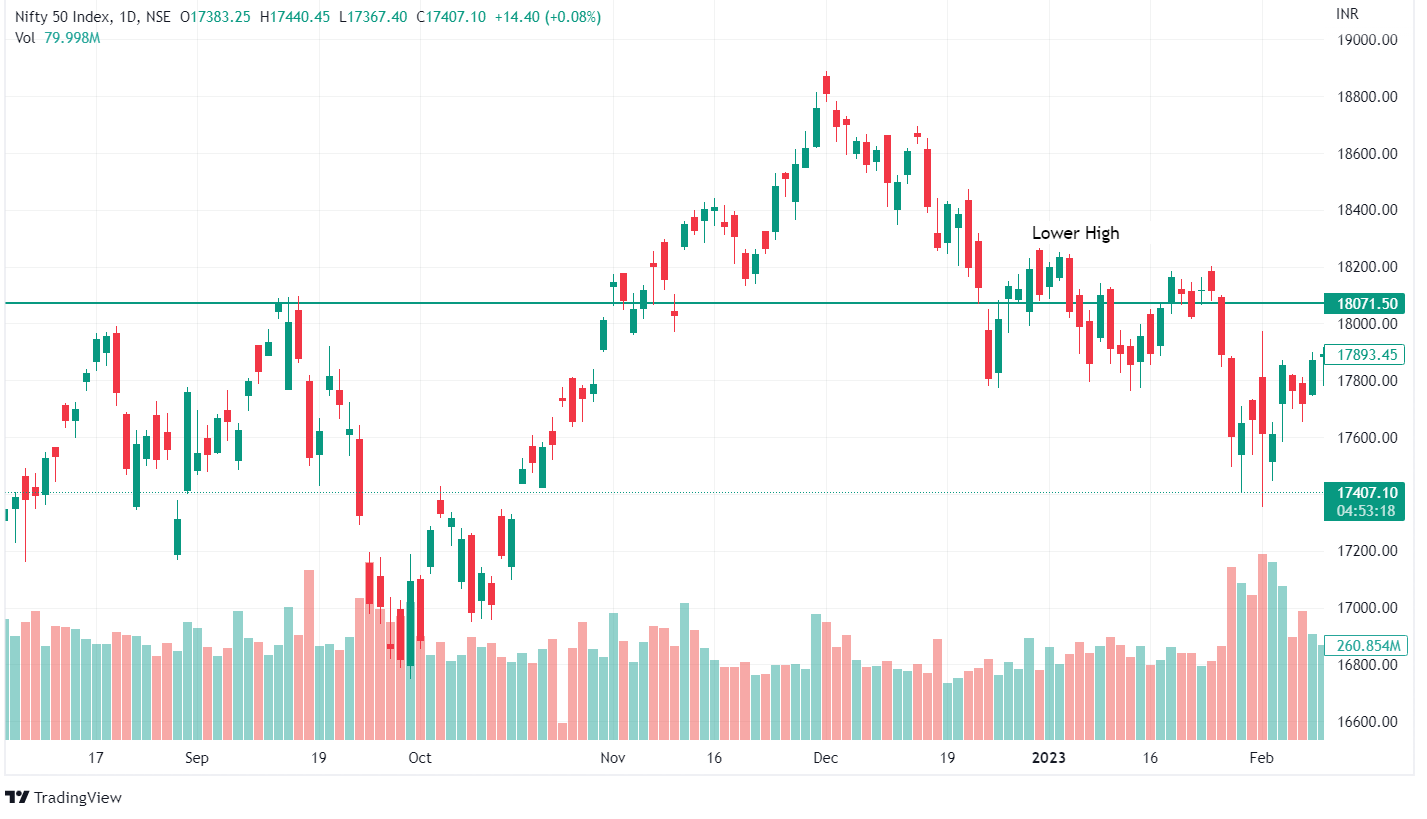
The presence of a lower high indicates a weak uptrend. Traders will be concerned about the formation of the “Head and shoulders” pattern and a potential market reversal to the downside in this situation.

5 Tools to Spot Trend Reversals in Stocks 3

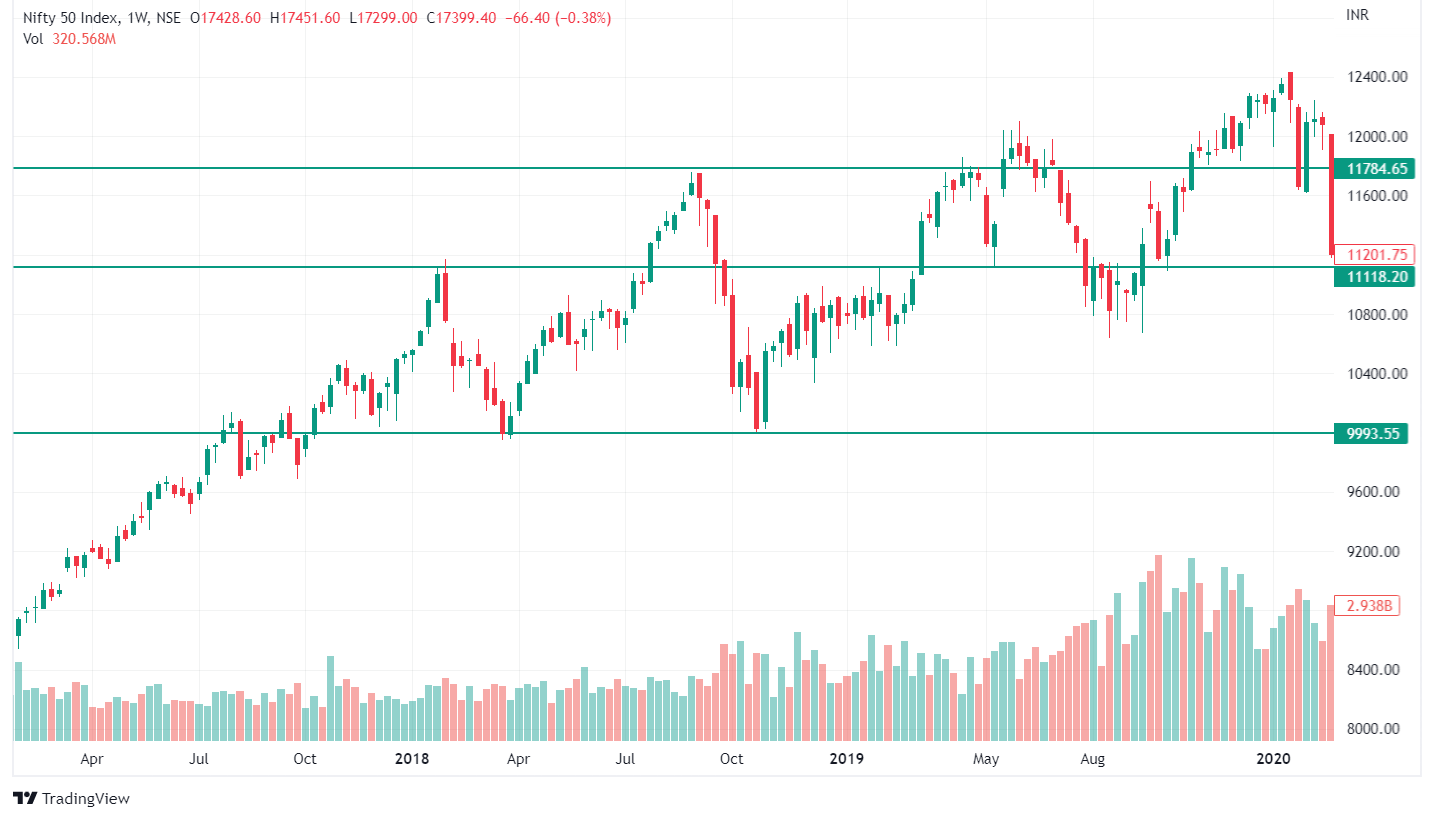
Furthermore, if the price begins to revisit a support line too frequently, it indicates that the uptrend is weakening.

5 Tools to Spot Trend Reversals in Stocks 4

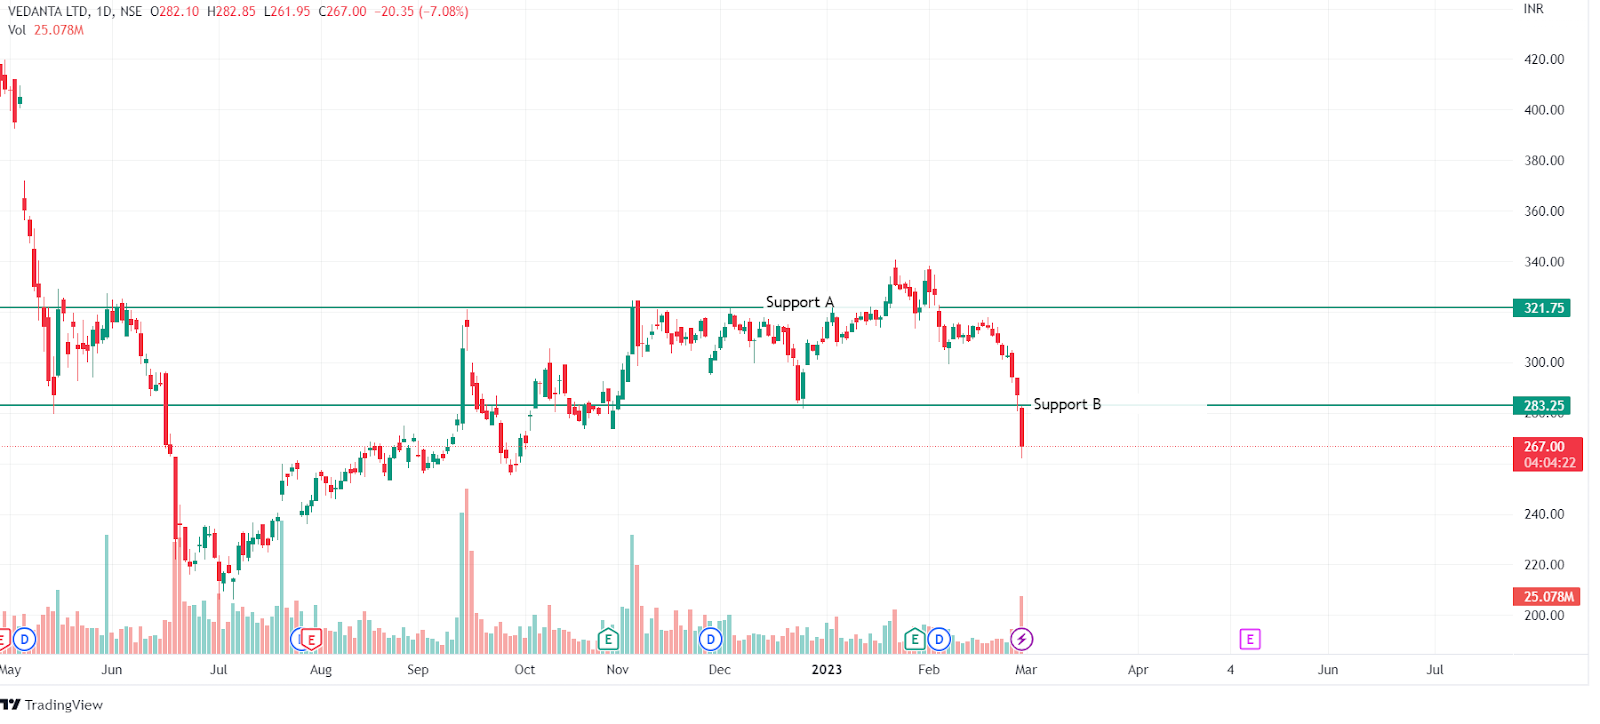
As the preceding explanations demonstrate, it is necessary to distinguish between support A (previous high during an uptrend) and support B. (previous low during an uptrend). When the price breaks support B, a reversal occurs, confirming that the price did indeed break below support/above resistance before declaring a reversal is critical. Examine the Japanese candlesticks carefully: the breakthrough candlestick should close below the support/above the resistance. 

When the broken line is retested, but the price does not return above or below it, this is ideal. Technical indicators and volume may also confirm a breakthrough.

2. Moving Averages\Ichimoku 

To begin with, Moving Averages of various periods can provide support/resistance levels beyond which traders will see a reversal or intersect, signaling a trend change.

The Ichimoku indicator also includes a set of lines that indicate when the market shifts from bullish to bearish and vice versa.

3. Average Directional Index

Second, ADX is a leading indicator of the strength of a trend. When the trend becomes stronger, the indicator’s main line rises. The ADX magnitude ranges between 0 and 100. The trend is distinct and strong if the indicator is greater than 25. 

When the ADX rises above 25, it can be used to confirm a breakout and trend reversal. In addition, the two other lines of the indicator may indicate the direction of the reversal.

It’s also worth keeping an eye on how ADX is trending. If the indicator forms a series of higher peaks, the trend is strong, and a reversal is unlikely.

4. Volume Indicators

Volume indicators can also be used to estimate trend strength and confirm reversals. If a lower high was formed in an uptrend and volume was also lower, it is a strong indication of a reversal to the downside.

5. Sushi Roll Reversal Pattern

The term sushi roll candlestick pattern was first coined by the British writer Mark Fischer in ‘The Logical Trader’, a book he authored. Sushi Roll is a candlestick pattern comprised of ten bars. 

The first five bars are called the inside bars because they are confined within a slim or narrow range of highs and lows. The remaining five bars, known as the outside bars, have lower lows and higher highs than the first five bars.

5 Tools to Spot Trend Reversals in Stocks 5

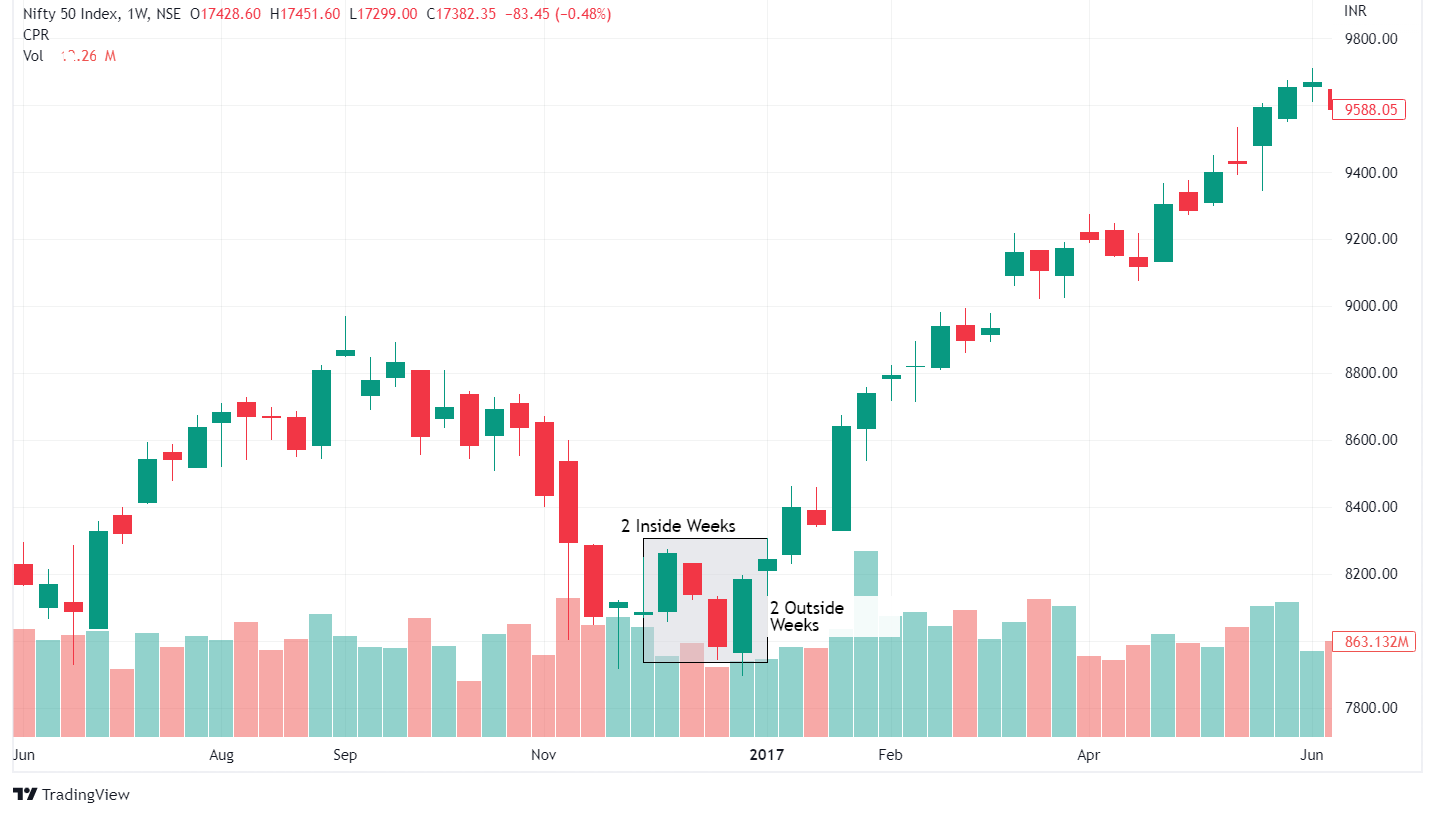
As a result, a pattern resembling a literal sushi roll is created. When the sushi roll pattern appears during a dominant trend, it indicates that a trend reversal is imminent. In many ways, this pattern is similar to bearish and bullish engulfing patterns. The main distinction here is that, instead of a pattern made up of two single bars, the sushi roll pattern is made up of several bars.

You can also watch our webinar in Smart reversal price action strategy

Bottomline

We hope you found this blog informative and use the information to its maximum potential in the practical world. Also, show some love by sharing this blog with your family and friends and helping us spread financial literacy

Frequently Asked Questions (FAQs)

How do you find the trend reversal of a stock?

Moving averages, trend lines, and other indicators can be used to spot trend reversals. Additionally, using support and resistance, breakouts, and pullbacks established on the chart, traders can trade trend reversals. During a transaction, accurate analysis and entry locations can aid traders in maintaining equilibrium.

How to identify trend reversal in Nifty?

Moving averages are employed to reduce price turbulence and spot patterns. When the short-term moving average crosses above or below the long-term moving average, a trend reversal is frequently suggested.

What are the indicators for stock price reversal?

However, if a stock’s price high is greater than its RSI high, this could indicate sluggish momentum and an oncoming reversal. On the other hand, if a stock records a lower price low but a higher RSI low, the downtrend might be ready to terminate.

Tags: basicenglishtechnical analysistrend reversal
ShareTweetSend
Get Kotak Offer Get Kotak Offer Get Kotak Offer
Previous Post

How to Invest in Shares: A Beginner’s Guide

Next Post

How to Identify Thief Companies in the Stock Market?

Vivek Bajaj

Vivek Bajaj

Mr. Vivek Bajaj has over 18 years of trading experience in equities, options, currencies, and commodity markets. He is the co-founder of Stockedge and Elearnmarkets and is passionate about data, analytics, and technology. He serves on various exchange committees and has played a significant role in the evolution of India's derivative market. He has been a speaker at various colleges and higher institutions, including IIT and IIMs.

Related Posts

Understand Slippage in Trading
Technical Analysis

What is Slippage in Trading? Meaning & Examples

March 28, 2025
294
Breakout trading strategies
Technical Analysis

Top 5 Breakout Trading Strategies

March 12, 2025
1.1k
5 stocks for today
Technical Analysis

5 Stocks to Buy Today That Could Beat the NIFTY in 2025!

May 5, 2025
395
Image describing What is marginal trading facility
Technical Analysis

 What is a Margin Trading Facility? Advantages & Risks

April 4, 2025
661

Leave a Reply Cancel reply

Your email address will not be published. Required fields are marked *

Disclaimer

Elearnmarkets (Kredent InfoEdge Pvt. Ltd.) is a SEBI-registered Research Analyst (RA) entity (SEBI Registration No.: INH300007493). The information provided in this article is for educational and informational purposes only and should not be considered as an offer to buy or sell any securities or investment products.

The stocks, securities, and investment instruments mentioned herein are not recommendations under SEBI (Research Analysts) Regulations, 2014. Readers are advised to conduct their own due diligence and seek independent financial advice before making any investment decisions.

Investments in securities markets are subject to market risks. Please read all related documents carefully before investing. Investing in Equity Shares,
Derivatives, Mutual Funds, or other instruments carry inherent risks, including potential loss of capital. Elearnmarkets (Kredent InfoEdge Pvt. Ltd.) does not provide any guarantee or assurance of returns on any investments. Past performance is not indicative of future performance.

Elearnmarkets Logo

Follow Us

Facebook-f X-twitter Instagram Linkedin-in Youtube Telegram

Register on Elearnmarkets

Continue your financial learning by creating your own account on Elearnmarkets.com

Register Free Account

Download App

Playstore logo
Download on app store

Categories

  • Basic Finance
  • Derivatives
  • Financial Planning
  • Fundamental Analysis
  • Technical Analysis
  • Mutual Funds
  • Miscellaneous

Popular On Elearnmarkets

  • Market Superheroes:
  • Vivek Bajaj
  • Chetan Panchamia
  • Ashish Kyal
  • Premal Parekh
  • Abhijit Paul
  • Jegan
  • Sivakumar Jayachadran
  • Jyoti Budhia
  • Vivek Gadodia
  • Vishal Mehta
  • Piyush Chaudhry
  • Santosh Pasi
  • Gomathi Shankar
  • Market Superheroes:
  • Vivek Bajaj
  • Chetan Panchamia
  • Ashish Kyal
  • Premal Parekh
  • Abhijit Paul
  • Jegan
  • Sivakumar Jayachadran
  • Jyoti Budhia
  • Vivek Gadodia
  • Vishal Mehta
  • Piyush Chaudhry
  • Santosh Pasi
  • Gomathi Shankar
  • Courses:​
  • Options Trading
  • Dow Theory
  • Momentum Trading
  • Stock Investing
  • Harmonic Chart Patterns
  • Algo Trading
  • Elliot Wave Theory
  • Advanced Excel
  • Cryptocurrency
  • NSE Certification Course
  • Courses:​
  • Options Trading
  • Dow Theory
  • Momentum Trading
  • Stock Investing
  • Harmonic Chart Patterns
  • Algo Trading
  • Elliot Wave Theory
  • Advanced Excel
  • Cryptocurrency
  • NSE Certification Course
  • Webinars:
  • Bank Nifty Scalping
  • Intraday Trading Strategies
  • Options Trading Strategies
  • Options selling
  • Price Action
  • Relative Strength
  • Tax Planning
  • Options Buying
  • Growth Stocks
  • Portfolio Management
  • Risk Management
  • Renko Charts
  • Crude Oil
  • Traders Psychology
  • Moving Average
  • Multibagger Stocks
  • Free Learning Modules:
  • Intraday Trading
  • Options Scalping
  • Swing Trading
  • Financial Modelling
  • RSI Indicator
  • Bollinger Bands
  • Pricing of Futures
  • Personal Finance
  • Initial Public Offerings (IPO)
  • Value Investing
  • Technical Indicators
  • Candlesticks
  • Chart Patterns
  • Option Greeks
  • ELSS Funds
  • Banking and Insurance
  • Real Estate
  • Gold
  • Book Summaries:
  • Rich Dad Poor Dad
  • Psychology of Money
  • The Intelligent Investor
  • The Richest Man in Babylon
  • Think and Trade Like a Champion
  • Value Investing and Behavioural Finance
  • Trading in the Zone
  • Learn to Earn
  • Book Summaries:
  • Rich Dad Poor Dad
  • Psychology of Money
  • The Intelligent Investor
  • The Richest Man in Babylon
  • Think and Trade Like a Champion
  • Value Investing and Behavioural Finance
  • Trading in the Zone
  • Learn to Earn
  • Tools:
  • CAGR Calculator
  • SIP Calculator
  • eLearnOptions
  • Future Value Calculator
  • Present Value Calculator
  • Atal Pension Yojana
  • Cost of Delay Calculator
  • Become a Crorepati
  • Tools:
  • CAGR Calculator
  • SIP Calculator
  • eLearnOptions
  • Future Value Calculator
  • Present Value Calculator
  • Atal Pension Yojana
  • Cost of Delay Calculator
  • Become a Crorepati

© 2025 Elearnmarkets. All Rights Reserved

  • Visit Elearnmarkets
  • Courses
  • Webinars
  • Financial Guides
  • Get Free Counselling
  • Visit Elearnmarkets
  • Courses
  • Webinars
  • Financial Guides
  • Get Free Counselling

Download Our App

No Result
View All Result
  • Article Categories
    • Basic Finance
    • Derivatives
    • Financial Planning
    • Fundamental Analysis
    • Technical Analysis
    • ETFs & Mutual Funds
    • Marketshala
    • Miscellaneous
  • Language
    • Hindi
    • Bengali
    • English
  • Courses
  • Webinars
  • Stories
Get Free Course

© 2024 Elearnmarkets All Rights Reserved

A Handbook of Technical Analysis
To start your trading journey as a seasoned technical analyst
Download Guide For FREE
Trading Day 2025