
Momentum indicators help traders understand the speed at which the price of a particular stock changes. These indicators help us in understanding the strength of price movements.
Sometimes the stock prices fall fast, but at other times they might fall slow. We can analyze the speed of the fall or rise in particular stocks by using momentum indicators.
Momentum indicators are widely used technical indicators which measure the rate at which the price of a specific stock fluctuates. They also complement other indicators like volume and volatility well.
Traders should remember these indicators are more useful when the market is rising rather than falling. Below is a guide on what are these indicators and how we should use them when trading in the market:
Table of Contents
What are Momentum Indicators?
As we have discussed above momentum indicators help us in analysing the rate of speed at which the stock prices fall or rise.
The formula for this indicator compares the most recent closing price with the previous closing price of any time frame.
Most of the time, the momentum indicator is shown as a single line below the price chart rather than on the price line or bars.
How to trade with Momentum Indicators?
The momentum indicators are used in providing trade signals, but it is better used to help confirm the validity of trades based on price actions such as breakouts or pullbacks.
There are a few ways in which traders can trade with these indicators:
1. Crossovers
Trade signals are generated by the momentum indicators when they cross the middle line or other lines.
For example, when we use Moving Average Convergence Divergence (MACD) a buying signal is generated when the MACD line crosses the signal line from above or below.
2. Concept of Divergence
A bullish divergence occurs when the price moves lower lows but the momentum indicator is moving higher. It indicates that while the price is falling, the momentum behind the selling is slowing and the trend may reverse to an uptrend.
When the price moves higher highs but the momentum indicator is moving lower, then it is known as a bearish divergence.
This indicates that while the price is rising, the momentum behind the buying is slowing and the trend may reverse to the downside.
Top 5 Momentum Indicators
Below are some of the popular momentum indicators which help traders in gauging the speed of the prices:
1. Moving Average Convergence Divergence (MACD)
MACD is a momentum indicator that shows the relationship between the two moving averages i.e. 26 EMA and 12 EMA.
It consists of the MACD line and the signal line. The MACD line is the difference between the 26 EMA and 12 EMA and the signal line is 9 EMA.
The buying signal is generated by MACD when the MACD line crosses the signal line from below, and the selling signal is generated when the MACD line crosses the signal line from above as shown below:
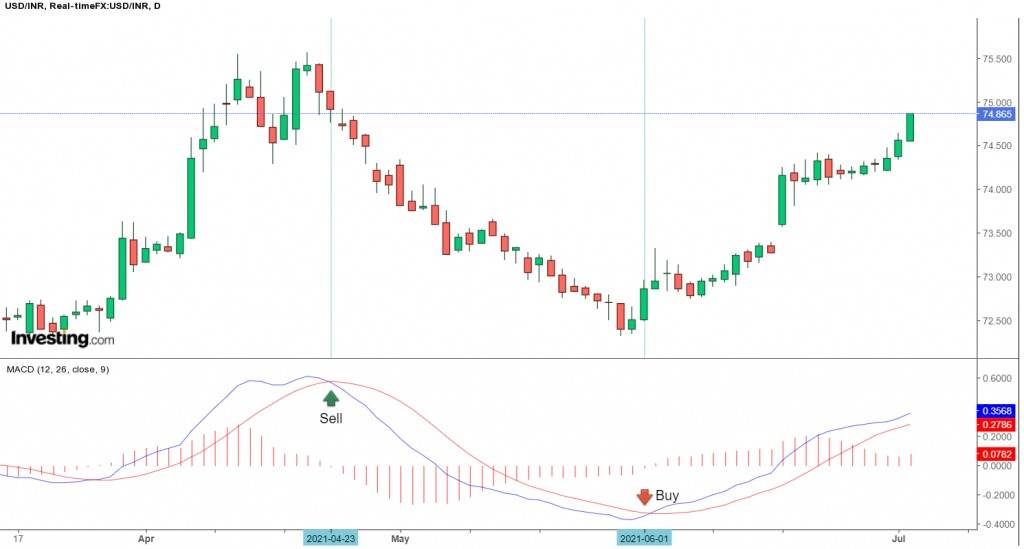
The buy and sell signals are also generated by MACD by bullish and bearish divergences.
2. Rate of Change
The rate of change is the speed at which the price changes over time. This indicator is expressed as a ratio between a change in one variable relative to the change in another.
A stock having high momentum has a positive ROC, whereas a low-momentum stock has a negative ROC and is likely to decline in value, which indicates a sell signal.
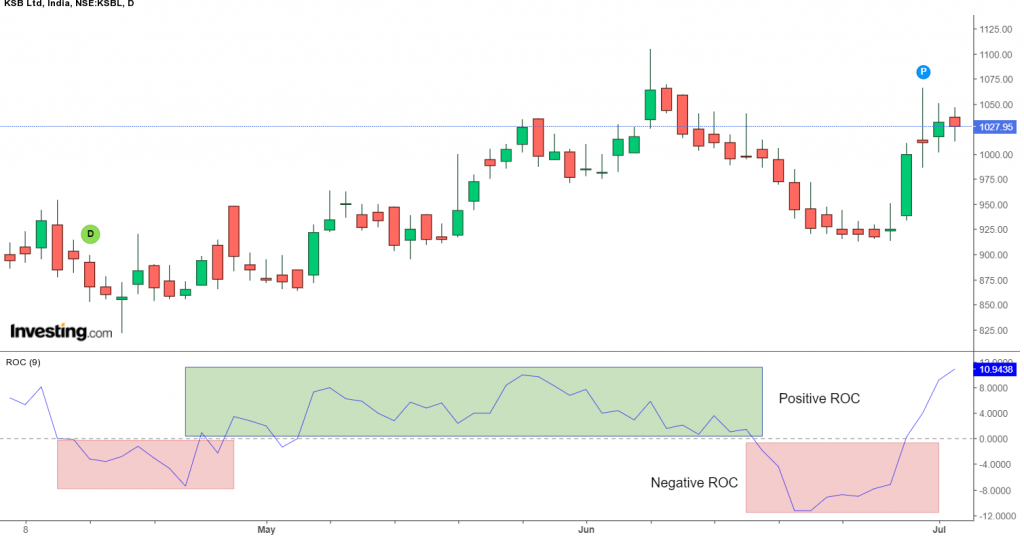
The buy and sell signals are also generated by the divergence between the prices and indicators.
3. Stochastic Oscillator
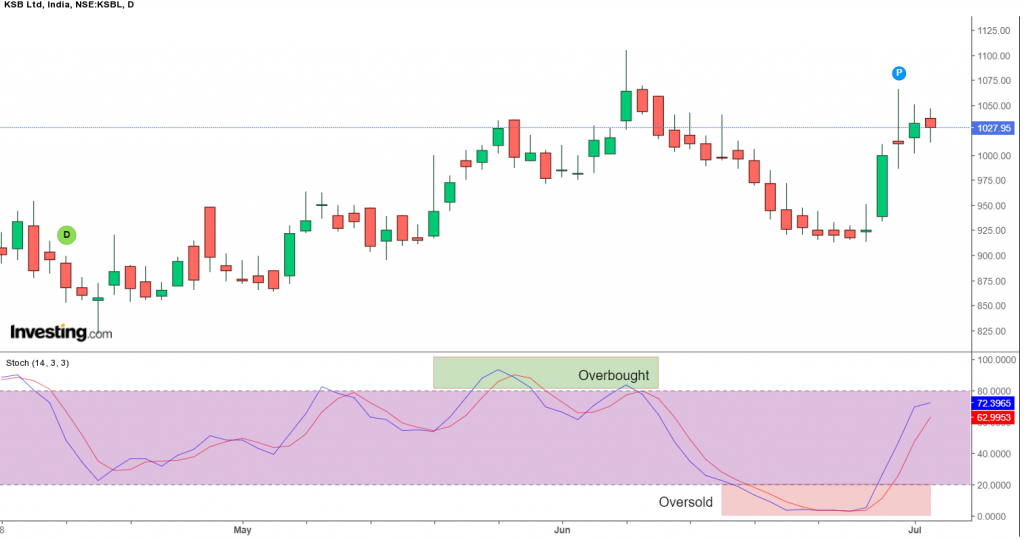
This momentum indicator is used by traders to compare the current closing price of a stock over a particular period of time.
It tracks the momentum as well as the speed of the market and does not consider volume and price.
Stochastics help in identifying the overbought and oversold zones and oscillates in the range of 0 and 100. When this indicator is above 80, then it is considered to be an overbought zone and when it is below 20, then it shows an oversold zone:
4. Relative Strength Index (RSI)
The Relative Strength Index (RSI) is another popular momentum indicator that acts as a metric for changes in the prices as well the speed at which they change for a particular period.
The indicator oscillates between zero and 100. Signals can be spotted by traders when they look for divergences and when the indicator crosses over the centreline which is 50.
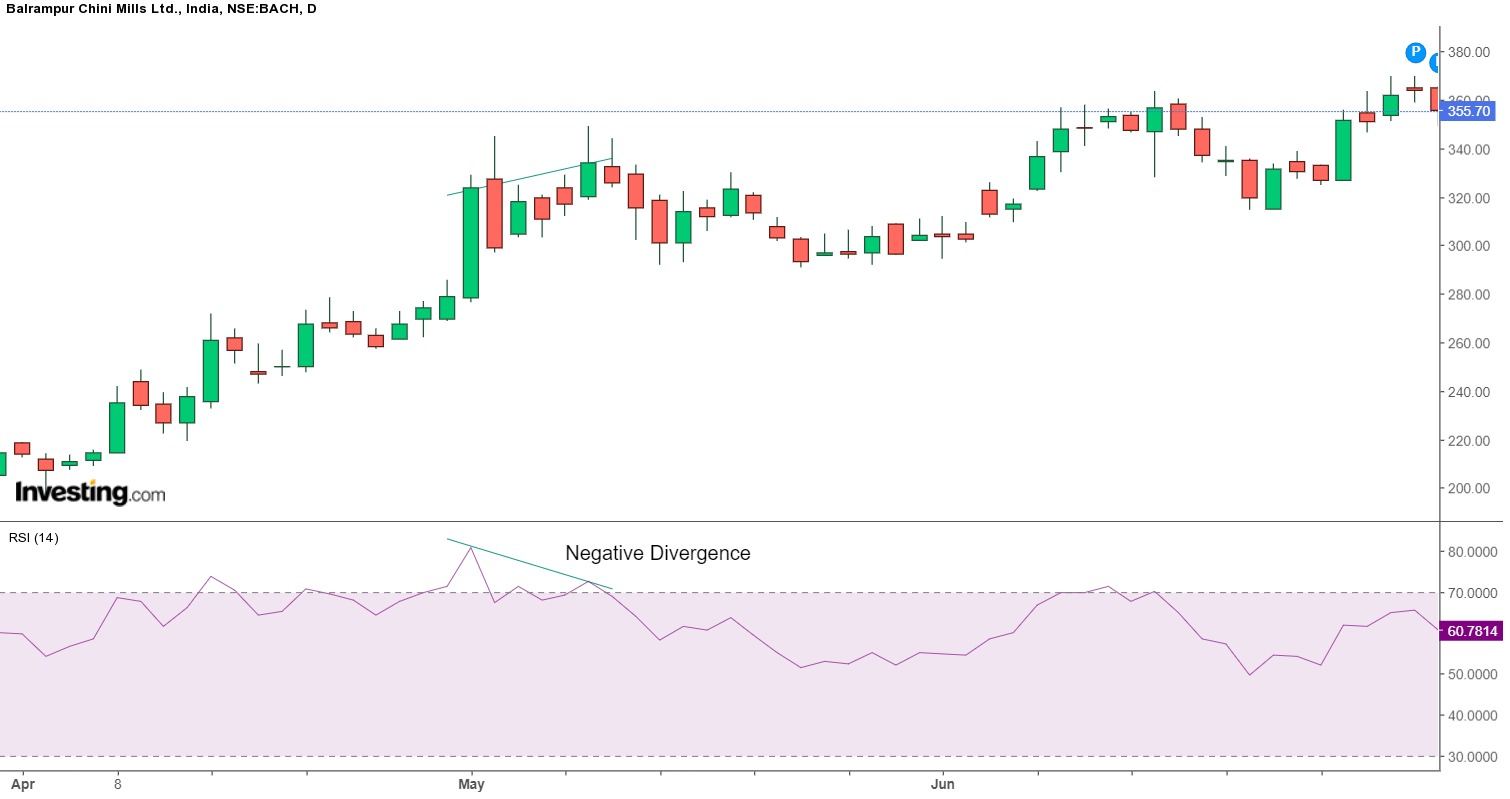
When RSI crosses above 50 signals positive and uptrend momentum, though, if the RSI hits 70 or above, then it is an indication of overbought conditions.
On the other hand, RSI readings that cross below 50 show negative and downtrend momentum. If the RSI is below 30, though, it indicates oversold conditions.
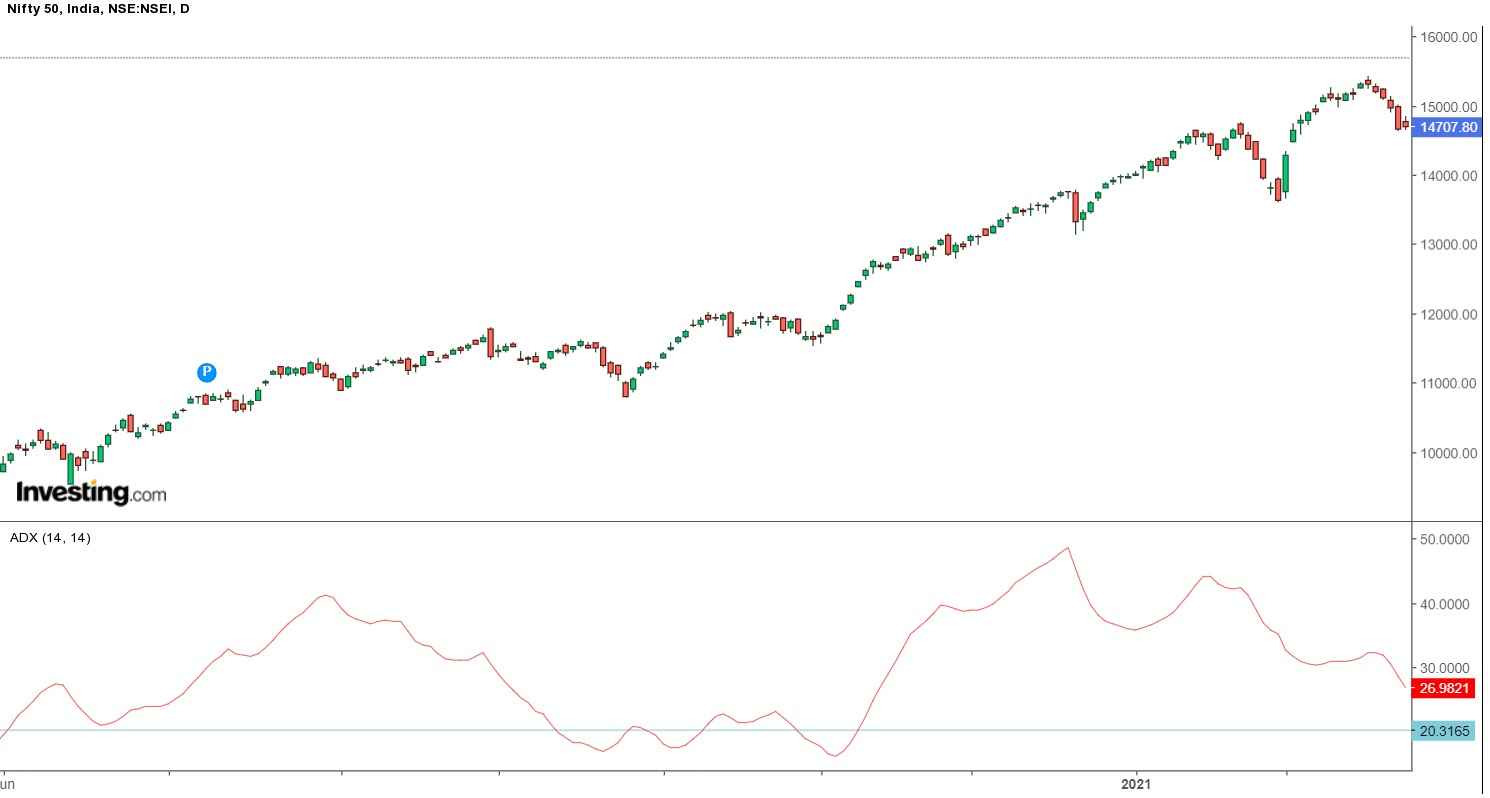
5. Average Directional Index (ADX)
Finally, the Average Directional Index (ADX) created by Welles Wilder established the Directional Movement System which consists of the ADX, the Minus Directional Indicator (-DI), and the Plus Directional Indicator (+DI).
These indicators as a group are used to help in measuring both the momentum as well as the direction of price movements.
Traders should note that the ADX values of 20 or higher indicate that the market is trending and for any reading less than 20, the market is viewed as “directionless” or consolidated.
Advantages of trading with Momentum Indicators
The momentum indicators are useful for spotting shifts in the buying or selling of stocks, mainly through divergence.
The indicator is best used to confirm a price action trading strategy, instead of using it to find trade signals on its own.
You can also learn from our Masterclass on Short-term Momentum Trading
Disadvantages
One should try to use momentum indicators with other indicators like volume or volatility or with the price actions as sometimes it may give false indicators.
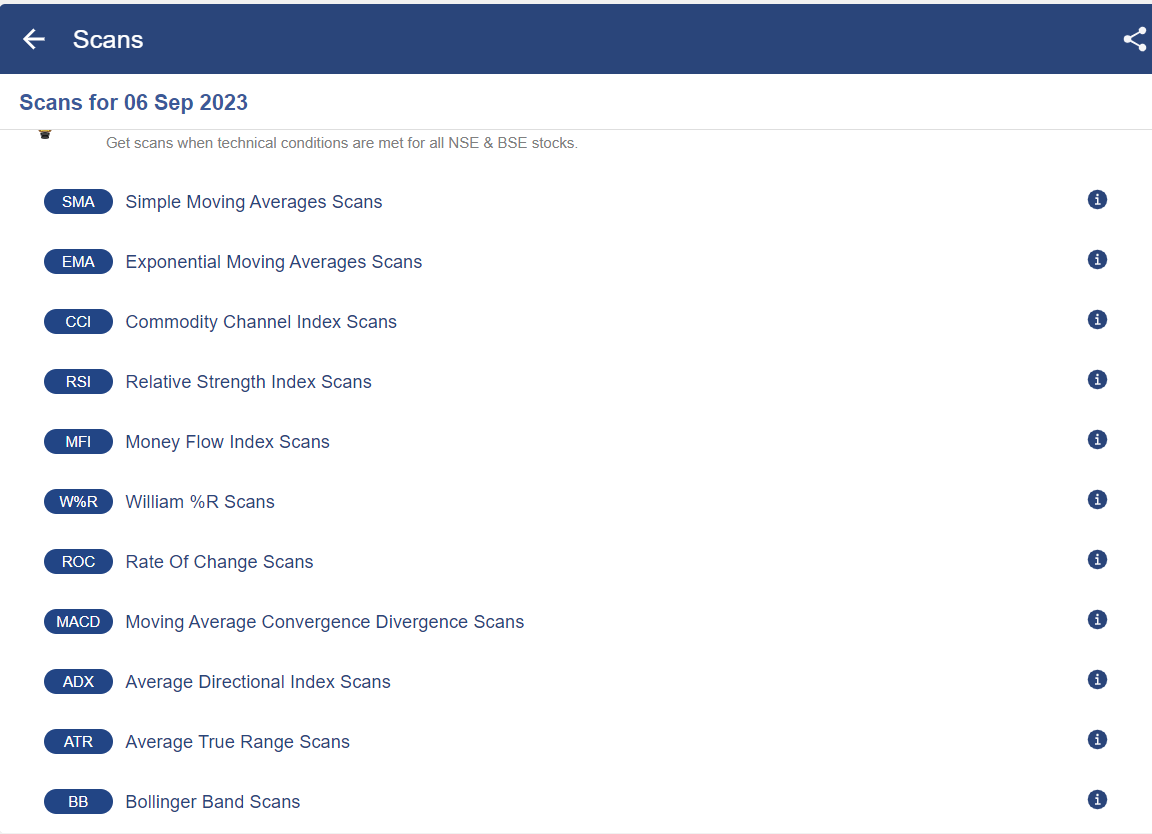
Using Momentum Indicator Scans In StockEdge
There are technical momentum indicator scans available in StockEdge through which one can filter out stocks as shown below:
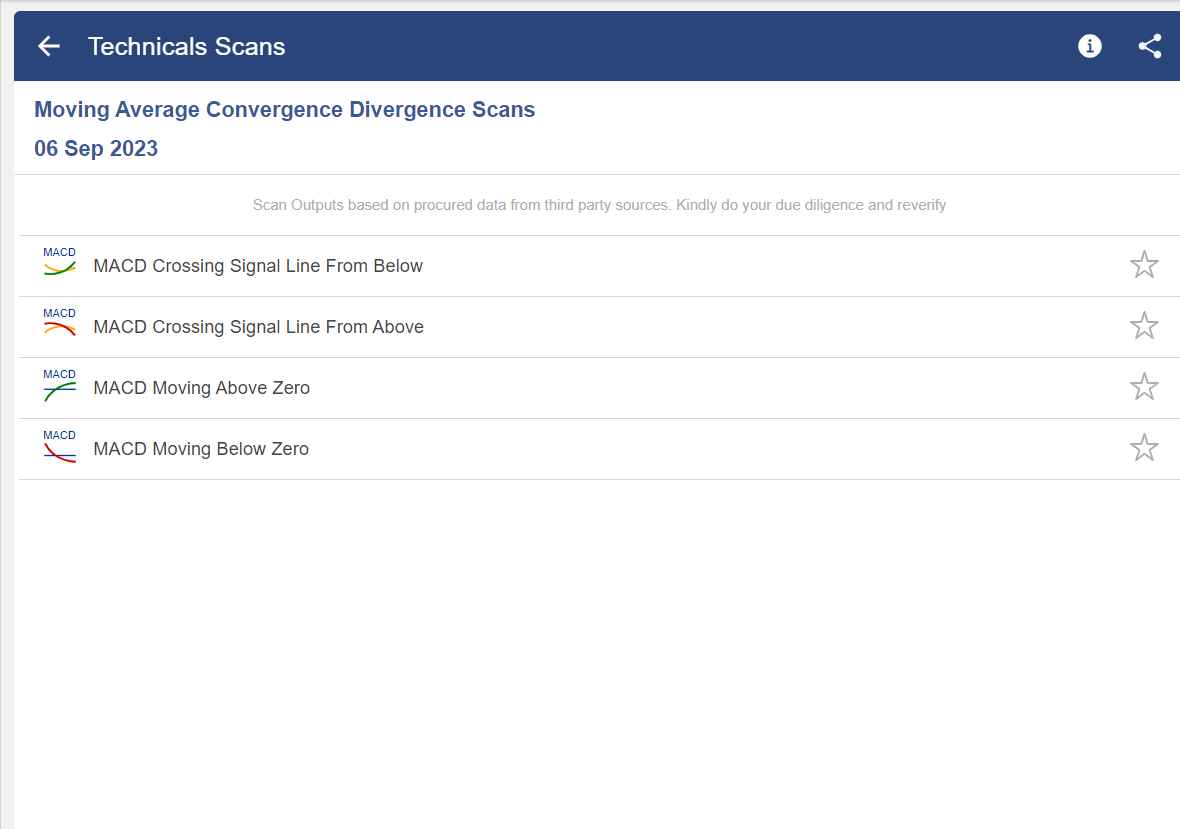
After clicking on any of the technical indicator scans one will get a sub-list of scans:
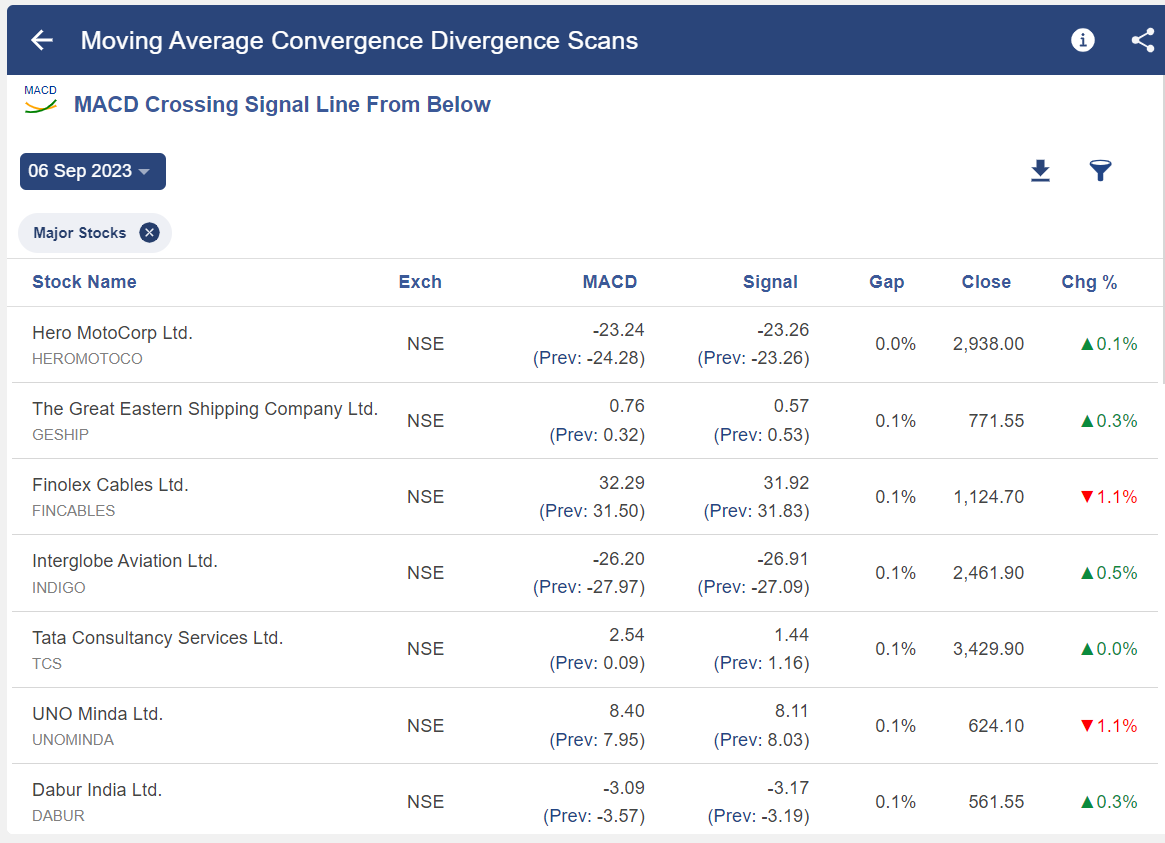
You get a list of stocks that fulfils the criteria:
You can also watch our video
Bottomline
Momentum indicators are important tools for the trader, but they are rarely used in isolation. It is more used with other technical indicators which reveal the directions of trends as discussed above.
Once the direction is determined, the momentum indicators are valuable as they indicate the strength of trends and when they are going to reverse.
Ready to master market momentum? Enroll in our Momentum Masterclass today and analyze trend strength with our Top 5 Indicators!
Frequently Asked Questions (FAQs)
Which is best indicator for momentum?
MACD is a trend-following indicator and is frequently regarded as the best momentum indicator. It shows how the price of a financial product relates to two moving averages. Indicating momentum, MACD alternates between moving averages.
What are the three momentum indicators?
Simple Moving Average, Exponential Moving Average, Weighted Moving Average, Bollinger Bands, Moving Average Convergence Divergence (MACD), Relative Strength Index, Intraday Momentum Index, and Supertrend Indicator are some of the most important momentum or trend indicators.

What is the difference between momentum and ADX indicator?
Momentum indicators include the ADX, the negative directional indicator (-DI), and the positive directional indicator (+DI). Investors can evaluate trend strength using the ADX, and trend direction using the -DI and +DI.
Is Supertrend a momentum indicator?
A trend tracking indicator akin to moving averages is a super trend. Alternatively, you might install this indicator on a higher period, move it to a lower one, and use it there to signify entry and exit points. Supertrend provides exact timing for its signals.
Utilizing the powerful insights provided by the Super Trend indicator can greatly enhance your trading strategy, guiding you towards profitable opportunities in volatile markets.


Went through the 5 main indicators for trading in the market. Also saw there are similar write ups which are useful and would also go through them . Sir do we have a training course for the same and what is actually the simplified theory for a normal trader and investor.
Hi,
Thank you for reading our blog!
Yes, there are many technical courses on technical analysis that you can check by clicking here.
Keep Reading!
Explanation is god one. It will more better if you show with chart examples. Thank you for your efforts.
Hi,
We really appreciated that you liked our blog, we have given the chart examples for each of the indicators in the blog.
Thank you for your feedback.
Keep Reading!
Incredible, Thanks for sharing Article.
Hi,
We really appreciated that you liked our blog.
Keep Reading!!