Elearnmarkets - Financial Market Learning
  • Courses
  • Webinars
  • Stories
  • Language
    • English
    • Hindi
    • Bengali
No Result
View All Result
Get Free Course
  • Basic Finance
  • Derivatives
    • Futures
    • Options
  • Financial Planning
  • Fundamental Analysis
  • Technical Analysis
  • Mutual Funds
  • Marketshala
  • Miscellaneous
Elearnmarkets - Learn Stock Market, trading, investing for Free
  • Courses
  • Webinars
  • Stories
  • Language
    • English
    • Hindi
    • Bengali
No Result
View All Result
Get Free Course
Elearnmarkets - Learn Stock Market, trading, investing for Free
No Result
View All Result
Home Technical Analysis
How to Filter Market Phases through MACD Indicator 1

How to Filter Market Phases through MACD Indicator

Elearnmarkets by Elearnmarkets
October 27, 2021
in Technical Analysis, Charts, Patterns & Indicators
Reading Time: 7 mins read
0
14.4k
VIEWS
Share on FacebookShare on XShare on WhatsApp

Hindi: आप इस लेख को हिंदी में भी पढ़ सकते है|

The Moving Average Convergence Divergence that is the MACD indicator is a popular trend following and momentum indicator which is based on the information of moving averages and acts as an additional momentum tool as well as a momentum filter for trading.

“There is only one side of the market and it is not the bull side or the bear side, but the right side.” – Jesse Livermore

To completely understand this indicator one needs to first understand the concept of  Technical Analysis. In this blog, we will explain what the indicator does, how it helps to analyze the price, and how to use it in your trading :

Table of Contents
Components of the MACD indicator
MACD Indicator basics
What is Trend Following Entry?
MACD Divergences as Early Entries
MACD vs. Relative Strength
Limitations of MACD

Components of the MACD indicator:

MACD Line:  This line is an important part of the indicator and by default, it is the difference between the 12 period EMA and the 26 EMA period. This means the MACD line is basically a complete moving average crossover system by itself.

Signal Line:  This is the 9 period EMA of the MACD line.

MACD Indicator basics :

As we have discussed above, the MACD is based on moving averages which means that it is ideal for analyzing momentum, finding trend following entries, and stays in trend until momentum dies off.

There are usually 2 MACD signals in particular which we will explore in this article and explain how to use MACD in order to find trades:

  • The MACD line cross 0

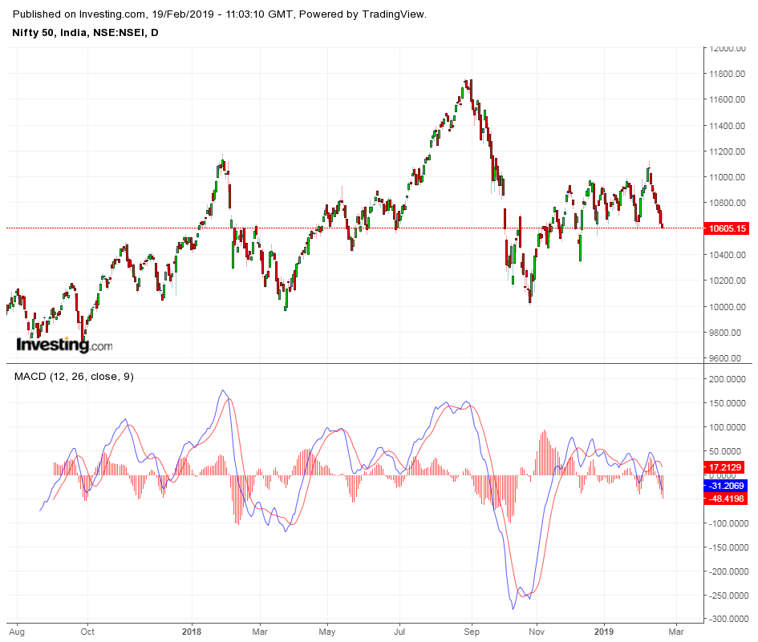
 I have also plotted the two moving averages, 12 and 26 EMA on the chart beside the MACD lines in order to explain how the MACD works.

When the 12 EMA crosses with 26 EMA below or above, the MACD also crosses 0 as well. Like said above, the MACD is itself its own moving average crossover system in just one line.

Learn to trade with market trend via MACD Indicator in just 2 hours by Market Experts

macd line cross 0
  • The Signal Line

When we see that the two MACD indicator lines move away from each other, it means that the momentum is rising and the trend is getting stronger. When these two lines come closer to each other then it shows that the price is losing strength.

Note: As long as the price is above the 12 and 26 EMAs and the MACD lines are above 0 then the trend is still going on.

the signal line

Trend Following Entry

Let us see how one can enter different phases of the market by understanding the Interpretation of  MACD:

  • Consolidation:

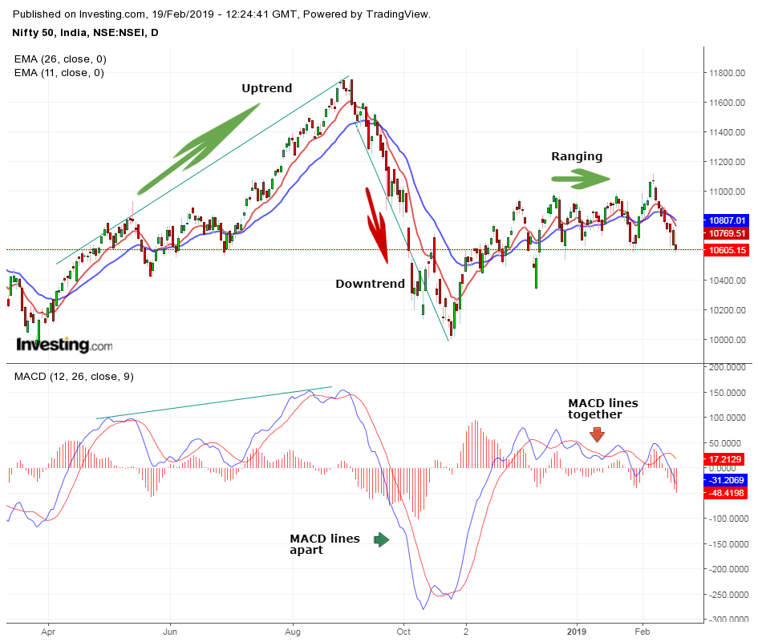
During ranges, the two MACD lines are very close together and they hover around 0, as we can see from the chart below. This means that there is neither momentum nor strength.

At point #1, the price also formed a narrow range. During a consolidation like a point 1, the MACD contracts sharply as well, and traders wait for the breakout of the wedge for a new trend to start.

  • Uptrend:

When the price breaks out the wedge, EMA 26 crosses EMA 12 from below, MACD lines also separate with each other and move above 0. From the chart below we can see that at point #2 the two moving averages have separated from each other and crossed 0. That is the beginning of the new uptrend.

Also Read: What could be the leading indicator in technical analysis?

  • Downtrend:

The divergence at #3 is a signal which we will explore below and it gave the early sign for the reversal. During downtrend #4 the price then again stayed below the moving averages and the MACD lines stay below 0.

trend following entry

MACD Divergences as Early Entries:

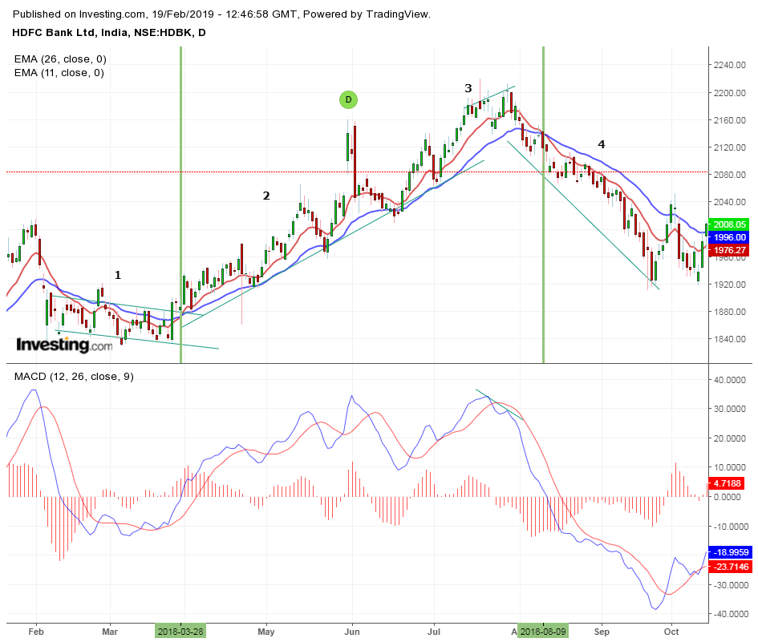
MACD divergences are a great way to analyze and find early trends following entries or exits.

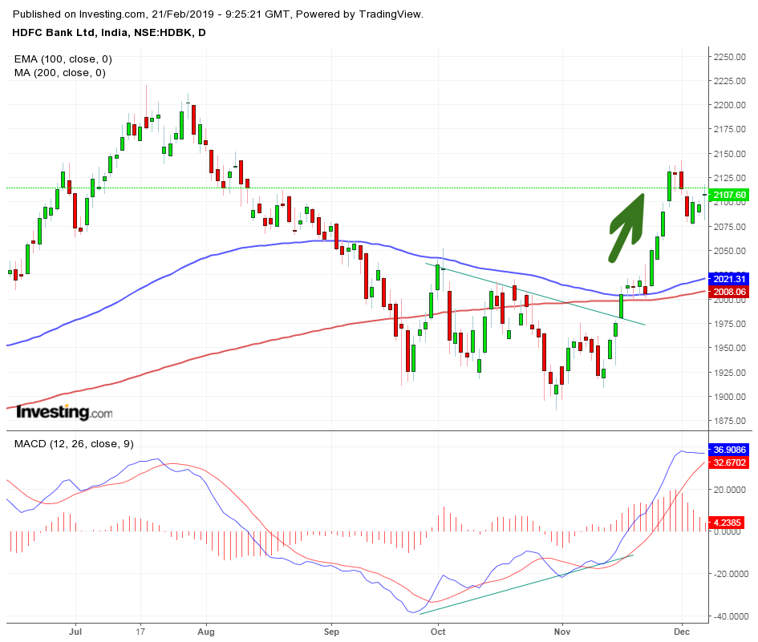
You can see from the chart below how the price was moving lower very slowly over a long period of time. At the same time, the MACD moved higher showing there was no selling strength behind the slow grind.

Suddenly price broke above the moving averages while the MACD lines crossed above 0 and also separated further. This can be a signal of a new uptrend.

macd divergences

MACD vs. Relative Strength:

The relative strength indicator (RSI) aims to signal if a market is considered to be overbought or oversold in relation to recent price levels.

Whereas, MACD measures the relationship between two EMAs, while the RSI measures price change in relation to recent price highs and lows.

These two indicators are used together to provide analysts with a more complete technical picture of a market.

Limitations of MACD:

Divergence often signals a possible reversal but It may sometimes also produces a false positive.

The other problem is that divergence predicts too many reversals that don’t occur and not enough real price reversals.

Also, A slowdown in the momentum will cause the MACD to pull away from its prior extremes.

As with most of the indicators, we probably don’t need them when we read momentum information directly from the charts. But indicators can be a great tool for building confidence and creating objectivity in our trading.

However, never let anyone tell you that indicators don’t work. Yes, they do! It depends upon you how you use them.

Key Takeaways:

  • The Moving Average Convergence Divergence that is MACD indicator is a popular trend following and momentum indicator
  • MACD is based on moving averages which means that it is ideal for analyzing momentum, finding trend following entries, and stays in the trend until momentum dies off.
  • When we see that the two MACD indicator lines move away from each other, it means that the momentum is rising and the trend is getting stronger

Happy Learning!

Tags: basicenglishmacdmacd indicatortechnical indicators
Share2TweetSend
Get Kotak Offer Get Kotak Offer Get Kotak Offer
Previous Post

Assets and Liabilities – Types, Differences and Valuation

Next Post

How to apply Hidden RSI Divergence for Swing Trading?

Elearnmarkets

Elearnmarkets

Elearnmarkets (ELM) is a complete financial market portal where the market experts have taken the onus to spread financial education. ELM constantly experiments with new education methodologies and technologies to make financial education effective, affordable and accessible to all. You can connect with us on Twitter @elearnmarkets.

Related Posts

Understand Slippage in Trading
Technical Analysis

What is Slippage in Trading? Meaning & Examples

March 28, 2025
305
Breakout trading strategies
Technical Analysis

Top 5 Breakout Trading Strategies

March 12, 2025
1.1k
5 stocks for today
Technical Analysis

5 Stocks to Buy Today That Could Beat the NIFTY in 2025!

May 5, 2025
401
Image describing What is marginal trading facility
Technical Analysis

 What is a Margin Trading Facility? Advantages & Risks

April 4, 2025
663

Leave a Reply Cancel reply

Your email address will not be published. Required fields are marked *

Disclaimer

Elearnmarkets (Kredent InfoEdge Pvt. Ltd.) is a SEBI-registered Research Analyst (RA) entity (SEBI Registration No.: INH300007493). The information provided in this article is for educational and informational purposes only and should not be considered as an offer to buy or sell any securities or investment products.

The stocks, securities, and investment instruments mentioned herein are not recommendations under SEBI (Research Analysts) Regulations, 2014. Readers are advised to conduct their own due diligence and seek independent financial advice before making any investment decisions.

Investments in securities markets are subject to market risks. Please read all related documents carefully before investing. Investing in Equity Shares,
Derivatives, Mutual Funds, or other instruments carry inherent risks, including potential loss of capital. Elearnmarkets (Kredent InfoEdge Pvt. Ltd.) does not provide any guarantee or assurance of returns on any investments. Past performance is not indicative of future performance.

Elearnmarkets Logo

Follow Us

Facebook-f X-twitter Instagram Linkedin-in Youtube Telegram

Register on Elearnmarkets

Continue your financial learning by creating your own account on Elearnmarkets.com

Register Free Account

Download App

Playstore logo
Download on app store

Categories

  • Basic Finance
  • Derivatives
  • Financial Planning
  • Fundamental Analysis
  • Technical Analysis
  • Mutual Funds
  • Miscellaneous

Popular On Elearnmarkets

  • Market Superheroes:
  • Vivek Bajaj
  • Chetan Panchamia
  • Ashish Kyal
  • Premal Parekh
  • Abhijit Paul
  • Jegan
  • Sivakumar Jayachadran
  • Jyoti Budhia
  • Vivek Gadodia
  • Vishal Mehta
  • Piyush Chaudhry
  • Santosh Pasi
  • Gomathi Shankar
  • Market Superheroes:
  • Vivek Bajaj
  • Chetan Panchamia
  • Ashish Kyal
  • Premal Parekh
  • Abhijit Paul
  • Jegan
  • Sivakumar Jayachadran
  • Jyoti Budhia
  • Vivek Gadodia
  • Vishal Mehta
  • Piyush Chaudhry
  • Santosh Pasi
  • Gomathi Shankar
  • Courses:​
  • Options Trading
  • Dow Theory
  • Momentum Trading
  • Stock Investing
  • Harmonic Chart Patterns
  • Algo Trading
  • Elliot Wave Theory
  • Advanced Excel
  • Cryptocurrency
  • NSE Certification Course
  • Courses:​
  • Options Trading
  • Dow Theory
  • Momentum Trading
  • Stock Investing
  • Harmonic Chart Patterns
  • Algo Trading
  • Elliot Wave Theory
  • Advanced Excel
  • Cryptocurrency
  • NSE Certification Course
  • Webinars:
  • Bank Nifty Scalping
  • Intraday Trading Strategies
  • Options Trading Strategies
  • Options selling
  • Price Action
  • Relative Strength
  • Tax Planning
  • Options Buying
  • Growth Stocks
  • Portfolio Management
  • Risk Management
  • Renko Charts
  • Crude Oil
  • Traders Psychology
  • Moving Average
  • Multibagger Stocks
  • Free Learning Modules:
  • Intraday Trading
  • Options Scalping
  • Swing Trading
  • Financial Modelling
  • RSI Indicator
  • Bollinger Bands
  • Pricing of Futures
  • Personal Finance
  • Initial Public Offerings (IPO)
  • Value Investing
  • Technical Indicators
  • Candlesticks
  • Chart Patterns
  • Option Greeks
  • ELSS Funds
  • Banking and Insurance
  • Real Estate
  • Gold
  • Book Summaries:
  • Rich Dad Poor Dad
  • Psychology of Money
  • The Intelligent Investor
  • The Richest Man in Babylon
  • Think and Trade Like a Champion
  • Value Investing and Behavioural Finance
  • Trading in the Zone
  • Learn to Earn
  • Book Summaries:
  • Rich Dad Poor Dad
  • Psychology of Money
  • The Intelligent Investor
  • The Richest Man in Babylon
  • Think and Trade Like a Champion
  • Value Investing and Behavioural Finance
  • Trading in the Zone
  • Learn to Earn
  • Tools:
  • CAGR Calculator
  • SIP Calculator
  • eLearnOptions
  • Future Value Calculator
  • Present Value Calculator
  • Atal Pension Yojana
  • Cost of Delay Calculator
  • Become a Crorepati
  • Tools:
  • CAGR Calculator
  • SIP Calculator
  • eLearnOptions
  • Future Value Calculator
  • Present Value Calculator
  • Atal Pension Yojana
  • Cost of Delay Calculator
  • Become a Crorepati

© 2025 Elearnmarkets. All Rights Reserved

  • Visit Elearnmarkets
  • Courses
  • Webinars
  • Financial Guides
  • Get Free Counselling
  • Visit Elearnmarkets
  • Courses
  • Webinars
  • Financial Guides
  • Get Free Counselling

Download Our App

No Result
View All Result
  • Article Categories
    • Basic Finance
    • Derivatives
    • Financial Planning
    • Fundamental Analysis
    • Technical Analysis
    • ETFs & Mutual Funds
    • Marketshala
    • Miscellaneous
  • Language
    • Hindi
    • Bengali
    • English
  • Courses
  • Webinars
  • Stories
Get Free Course

© 2024 Elearnmarkets All Rights Reserved

A Handbook of Technical Analysis
To start your trading journey as a seasoned technical analyst
Download Guide For FREE
Guidebook On Chart Patterns
Take Your Trading To The Next Level With Strategies Shared In This Ebook
Download Guide For FREE
Trading Mentorship Program