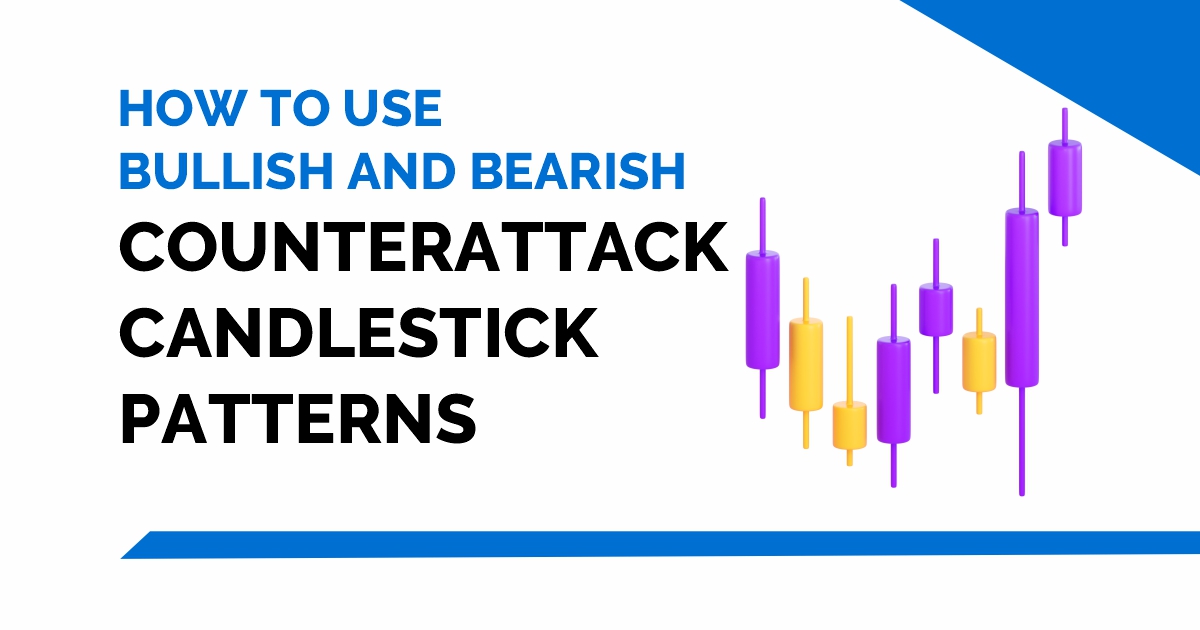
How to Use Bullish and Bearish Counterattack Candlestick Patterns
Today's blog will discuss everything you need to know about Counterattack Candlestick Patterns, which indicate a trend reversal.
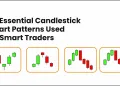
Candlestick analysis is a powerful tool used by traders to predict market trends and make informed trading decisions. Learn the basics of candlestick analysis and start improving your trading strategy today!
Today's blog will discuss everything you need to know about Counterattack Candlestick Patterns, which indicate a trend reversal.
The inverted hammer is a candlestick pattern in financial chart analysis that typically signals a potential reversal in the prevailing ...
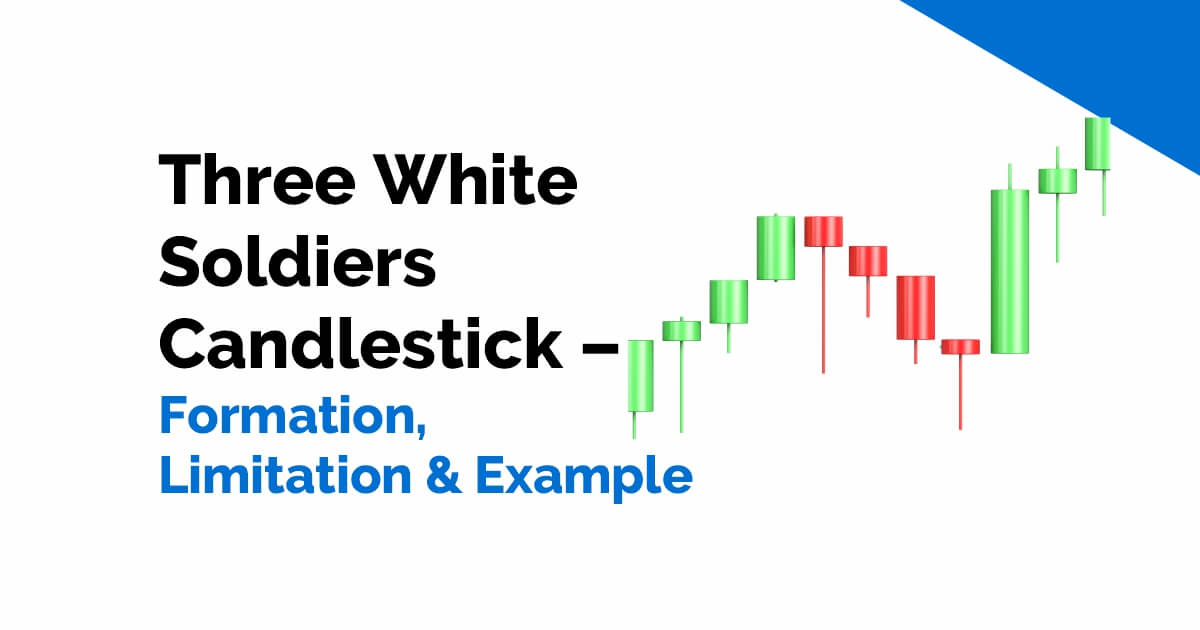
Three white soldiers is a multiple candlestick pattern that is used for analyzing charts of stocks, currencies, commodities, etc. Also ...
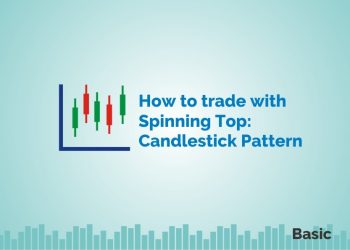
A spinning top, like any other candlestick patterns, does not give us a trading signal for entering or exiting.A spinning ...
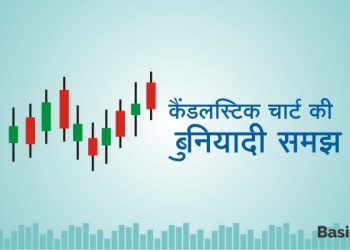
तकनीकी विश्लेषण (Technical Analysis) के तहत, कैंडलस्टिक चार्ट किसी सिक्योरिटी की कीमतों में परिवर्तन का विश्लेषण करने के सबसे कुशल ...
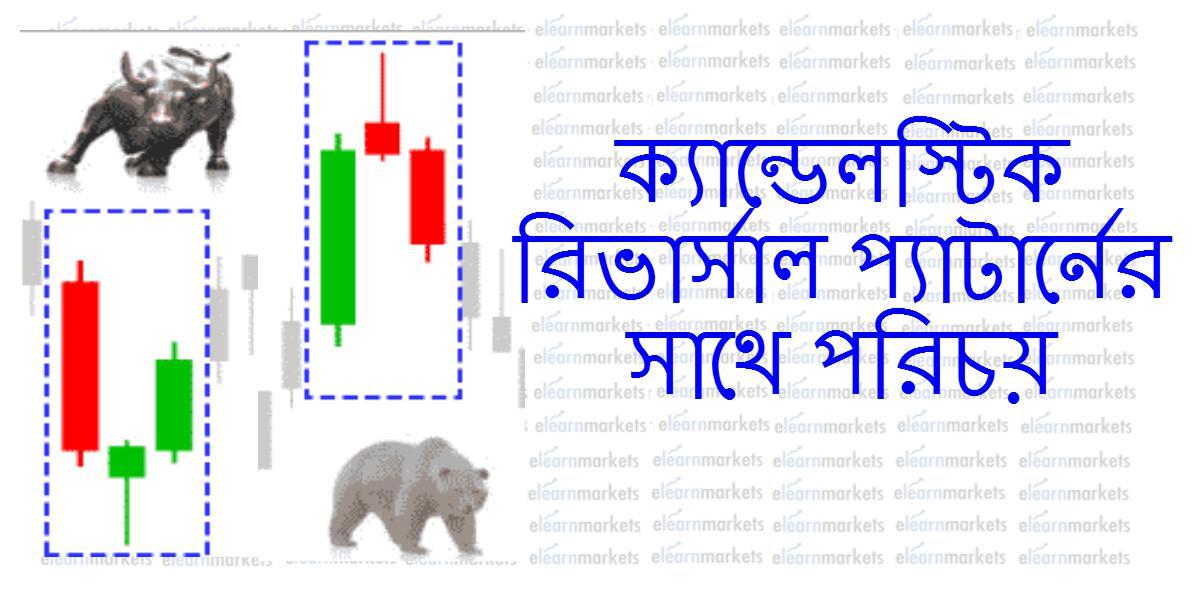
ভূমিকা : বিশ্ব ব্রম্ভাণ্ডের এই বিশাল জগৎ সংসারে জাগতিক নিয়মানুসারে কোনো কিছুই চিরস্থায়ী নয় |ধ্রুব সত্য যেমন পৃথিবী পশ্চিম থেকে ...
ভূমিকা : - আমরা মানুষ, মনুষ্যত্ব থাকার কারণেই আমরা মানুষ নামের অধিকারী | জীবনে চলার ক্ষেত্রে বিচার , বিবেচনা , ...
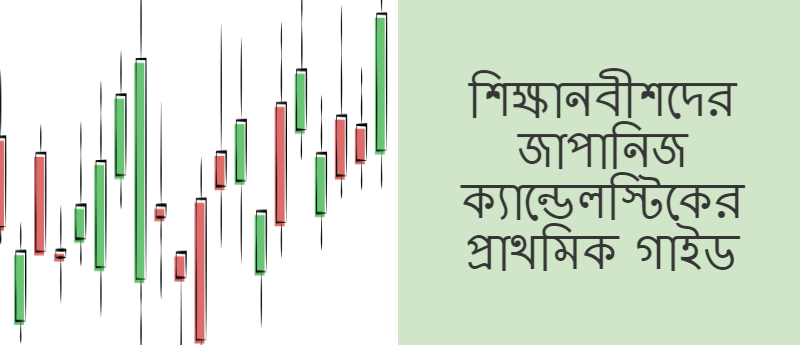
Candlestick charts are a very useful tool for analyzing trader’s psychology and undercurrents in price momentum. Every aspect of a ...