Key Takeaways:
- Three White Soldiers is a bullish reversal pattern formed after a downtrend with three strong green candles
- Each candle opens within the previous body and closes higher, showing consistent buying pressure
- The pattern signals a trend reversal when candles have small or no shadows and appear near support
- All three candles should close higher successively with the second and third opening within the previous real body
- It is the opposite of Three Black Crows, which signals bearish reversal with three red candles
Three white soldiers candlestick is a multiple candlestick pattern used to analyse charts of stocks, currencies, commodities, etc.
Also known as the Three Advancing White Soldiers, this candlestick pattern is used for predicting reversal from a downtrend to an uptrend.
This candlestick pattern is formed after a long downtrend when the bullish forces are more than the bearish forces for three consecutive days.
Here is a complete guide on how to trade with Three White Soldiers Candlestick Pattern:
- What is Three White Soldiers Candlestick Pattern?
- Formation of Three White Soldiers Candlestick Pattern:
- Conditions of trading Three White Soldiers Candlestick Pattern:
- Difference between Three White Soldiers and Three Black Crows:
- How to use Three White Soldiers in StockEdge:
- Limitations of Using Three White Soldiers:
- Bottomline
- Frequently Asked Questions (FAQs)
What is Three White Soldiers Candlestick Pattern?
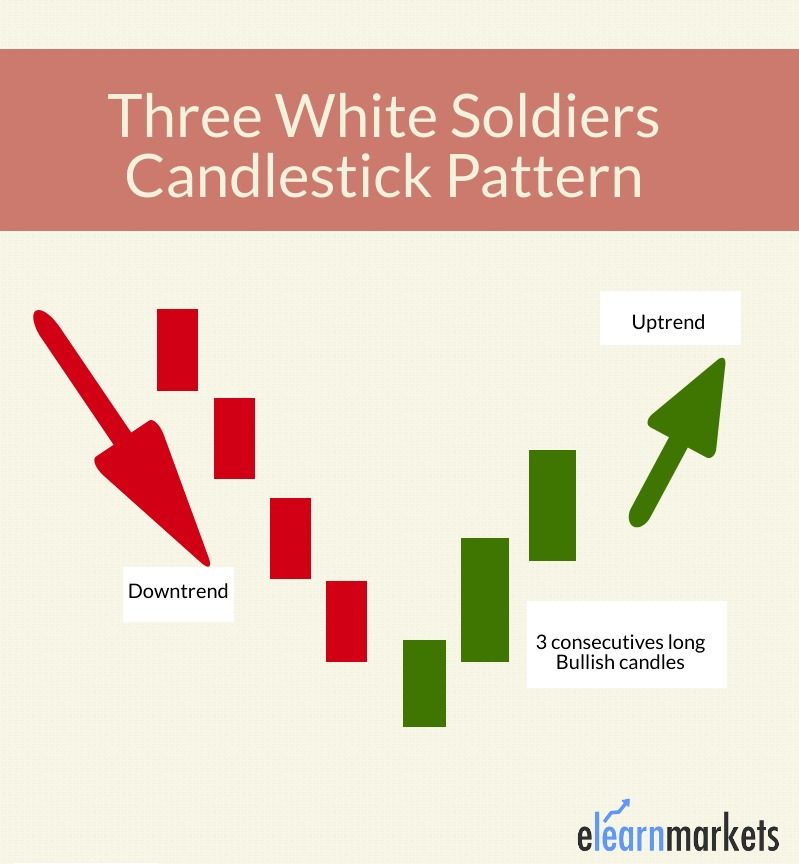
The three white soldiers pattern is a bullish reversal candlestick pattern that occurs at the bottom of a downtrend.
As the name suggests, this pattern consists of three candlesticks that are green in color.
This candlestick pattern signals an upcoming uptrend because of the strong buying pressure.
These candlesticks do not have long shadows and open within the real body of the previous candle in the pattern.
Formation of Three White Soldiers Candlestick Pattern:
Here is the formation of Three White Soldiers Candlestick Pattern:
Conditions of trading Three White Soldiers Candlestick Pattern:
Below are some of the conditions that need to be fulfilled for identifying this pattern on the candlestick charts:
Condition 1:
The first candle seems like the continuation of the downtrend.
It is a bullish candlestick meaning the closing price should be more than the opening price and indicates that the bulls are back into the action.
Condition 2:
The second candlestick should also be bullish.
The opening price should be within the real body of the first candlestick most preferably between the midpoint and closing price of the previous candlestick.
The closing price should be above the previous candle’s closing price and should be higher than the previous candle’s closing price.
Condition 3:
The third candlestick should also be a bullish candlestick having no or small shadow.
The opening price should be within the real body of the second candlestick most preferably between the midpoint and closing price of the second candlestick.
The closing price should be above the previous candle’s closing price and should be higher than the previous candle’s closing price.
The conditions of the third candlestick are almost the same as the second candlestick.

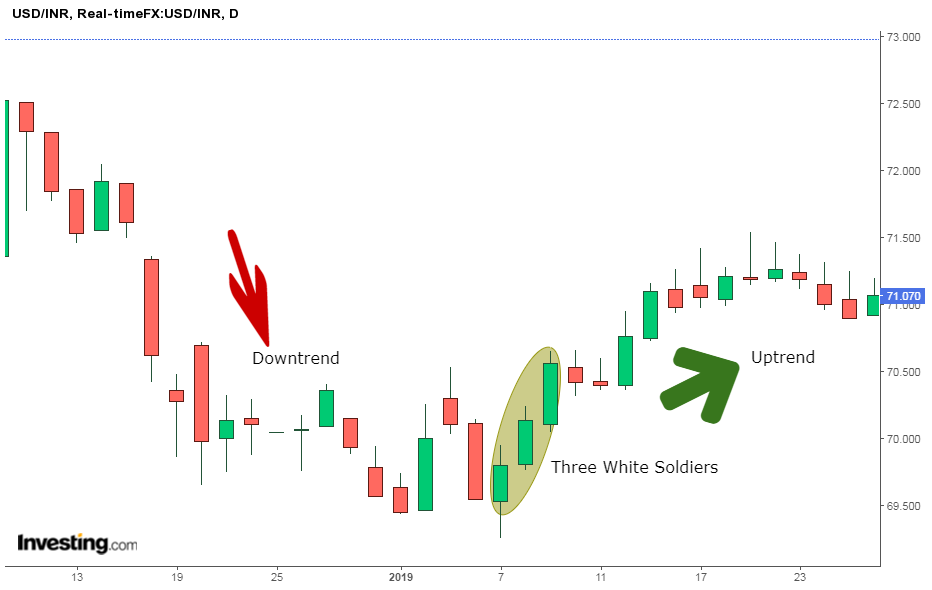
Trading Example
Below is an example of daily chart of USD/INR that shows us how Three Soldiers Candlesticks is formed after a downtrend and the trend got reversed after the formation of candlestick pattern.
Difference between Three White Soldiers and Three Black Crows:
The three black crows candlestick pattern is the opposite of the three white soldiers.
Three black crows is made of three consecutive bearish candlesticks.
On the other hand, three white soldiers indicate a shift from the bears to the bulls and is made of three consecutive bullish candlesticks.
Read More- All 35 Candlestick Chart Patterns in the Stock Market
How to use Three White Soldiers in StockEdge:
You can also use the Three White Soldiers Candlestick scans in StockEdge web version:
Steps to use Three White Soldiers scans in StockEdge:
Under the “Candlestick Scans” we can see Bullish Reversal scans as shown below:
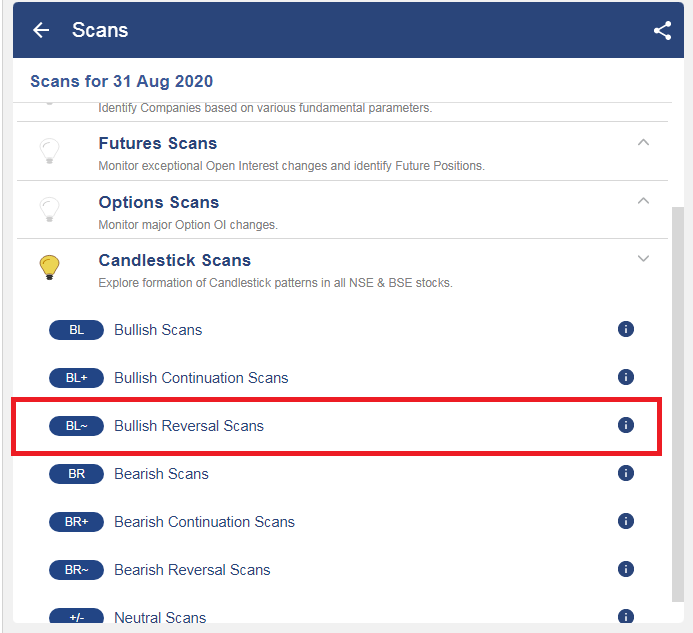
When we click on the “Bullish Reversal scans” we can see “Three White Soldiers” scan, click on that:
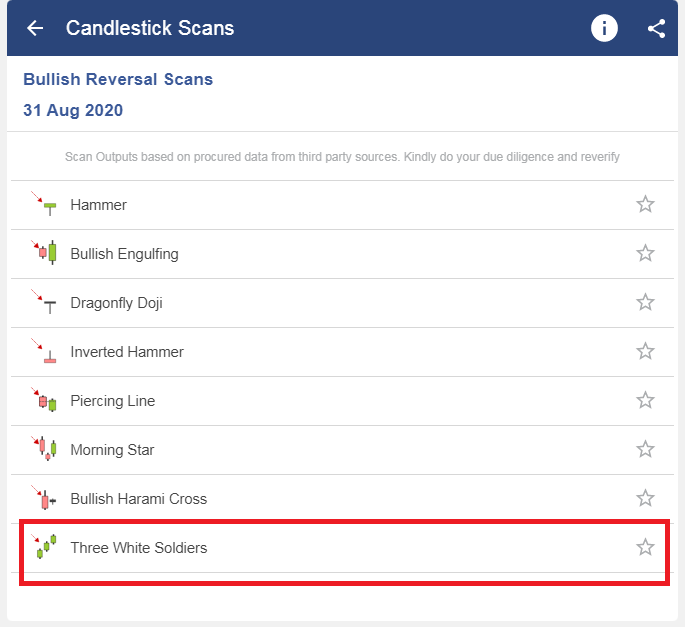
After selecting on it, you will get a list of stocks in which the “Three White Soldiers” pattern is formed.
Limitations of Using Three White Soldiers:
Three white soldiers sometimes also appear during consolidation, that is an easy way to get stuck in the consolidation
One should also watch if the volume is supporting the formation of three white soldiers.
To reduce the limitation of visual patterns, traders should use the three white soldiers candlestick pattern with other technical indicators like trend lines, moving averages, and bollinger bands.
Bottomline
Three white soldiers signal reversal from a downtrend to an uptrend because of the strong buying pressure. This candlestick pattern is formed after a long downtrend when the bullish forces are more than the bearish forces for three consecutive days. There are some conditions that need to be fulfilled to identify this pattern on the candlestick charts. One should watch if the volume is supporting the formation of three white soldier.
Frequently Asked Questions (FAQs)
What is 3 white soldiers candlestick?
A bullish candlestick pattern known as “three white soldiers” is used to forecast when the present decline in a price chart will reverse. Three long-bodied candlesticks in a row that open inside the actual body of the preceding candle and close higher than the height of the previous candle make up the design.
How accurate is the three white soldiers?
The three white soldiers is one of the most reliable trend reversal patterns. Based on studies, the bullish reversal pattern provides s accurate signals 80% to 90% of the time.
What is the difference between 3 white soldiers and 3 black crows?
The close happens above the close of the preceding candlestick, and the open happens inside its actual body. A simple visual pattern that denotes the reversal of an uptrend is represented by three black crows and the reversal of a downtrend by three white soldiers.


