As the famous trader Alexander Elder once said, “The market is a creature of time. It reveals different facets on different timeframes.”
Multi-timeframe analysis allows traders to gain a broader perspective by examining the same asset across different timeframes, from short-term to long-term. This will help traders make more informed trading decisions.
In this blog, we’ll discuss the Top 5 Proven Strategies for helping traders see the bigger picture and capture swings in price movements.
Table of Contents
Importance of Multi-TimeFrame Analysis
Trading across multi timeframes helps traders review and vigilantly monitor an asset to ensure timely trade execution.
Here are some points that will help you understand why analysing multi-timeframe charts is important for traders-
1. Better Entry and Exit Timings
When we analyse different timeframes, it becomes easier to find better entry and exit points with the help of stock market technical analysis.
Let us take an example to understand this-
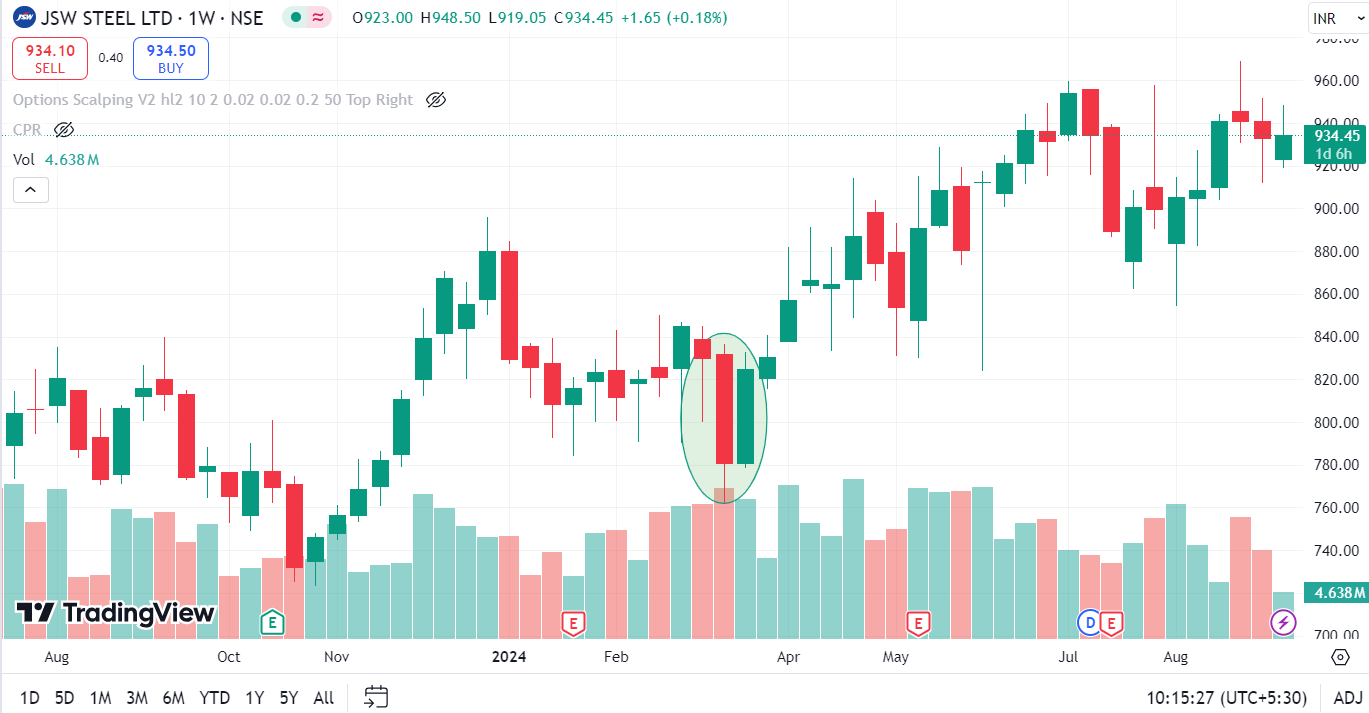
In the weekly charts, you see a bullish reversal candlestick pattern forming in the price chart. Below we can see a Bullish Harami pattern formed in the weekly chart of JSW Steel Ltd.

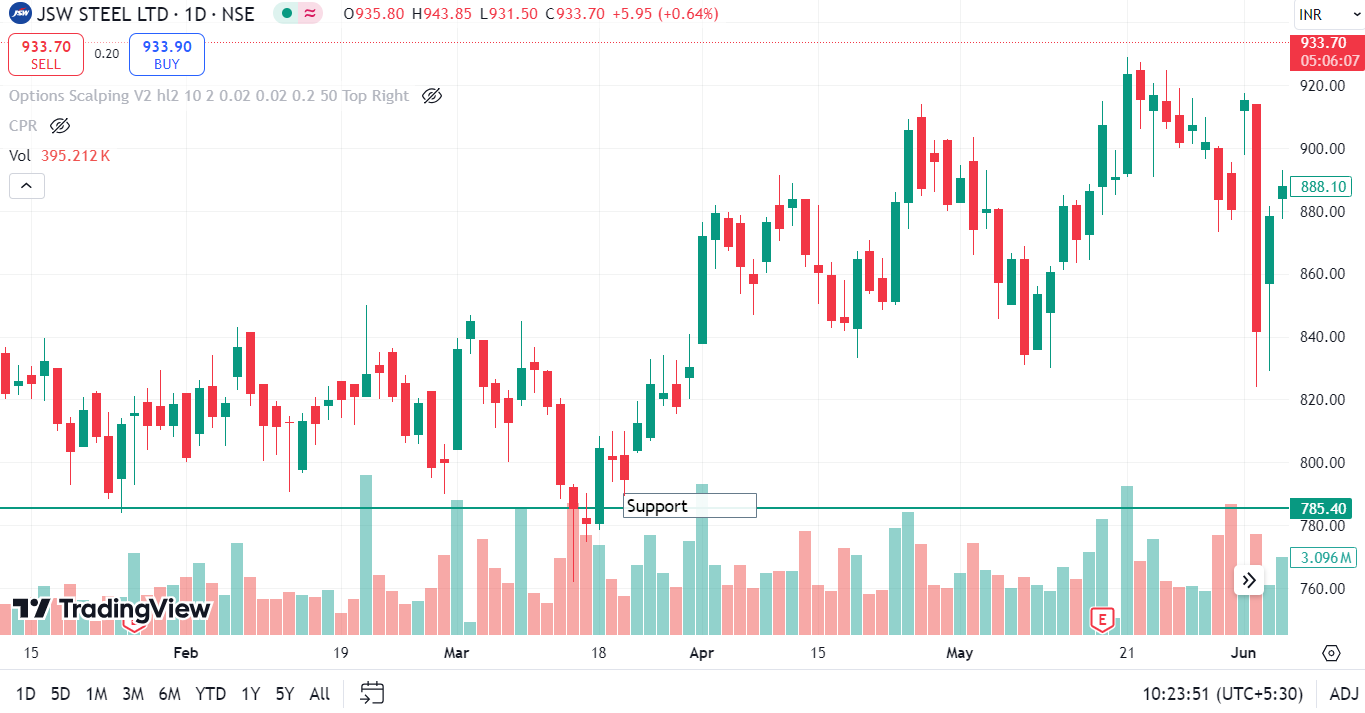
Switching to the daily chart, you observe that the price is consolidating near the support level spotted on the weekly chart.
The daily chart confirms that the stock is holding support, as shown below. The trader is now looking for an optimal entry point.
On the hourly chart, you zoom in to time the entry more accurately. You see a breakout of a short-term resistance level (or a moving average crossover) along with an increase in volume.
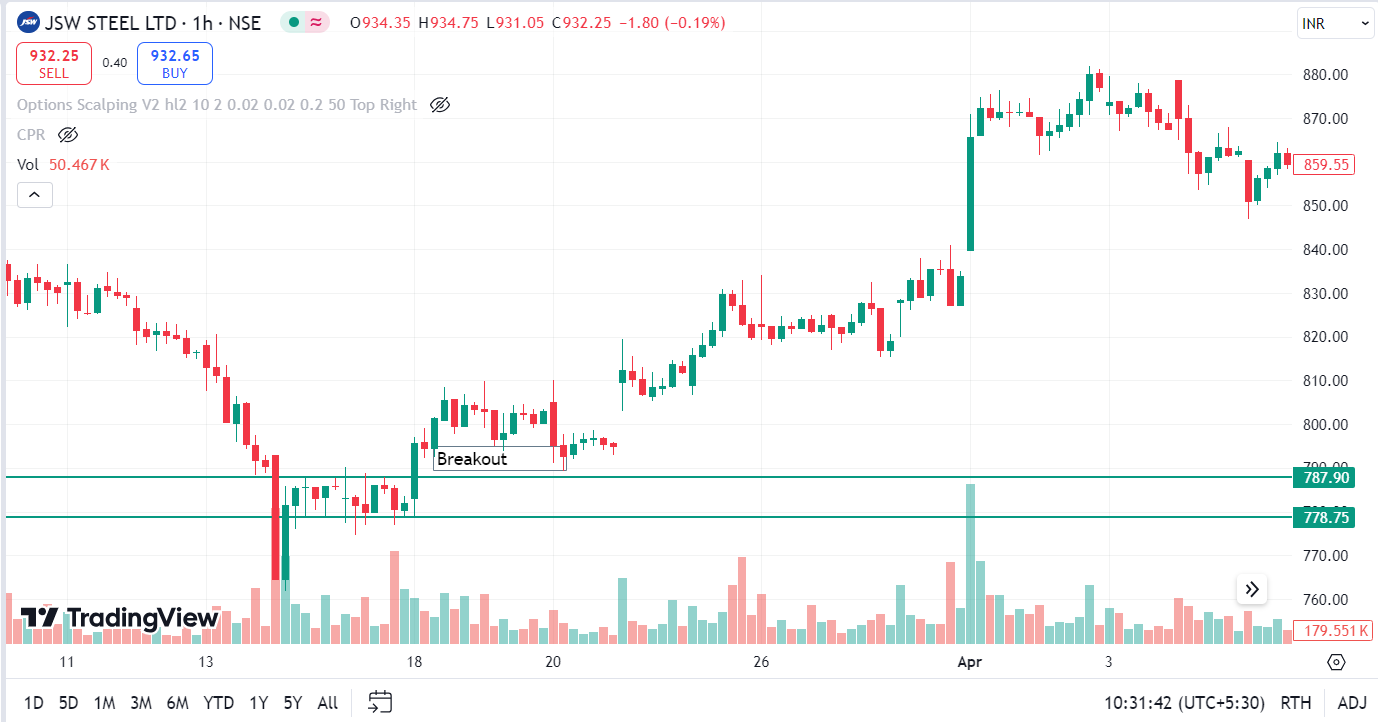
Then, you can enter the trade at the breakout point, where the price has momentum and the risk/reward ratio is favourable.
2. Confirmation of Signals
With the help of multi-timeframe analysis, traders can validate the trading signals generated in different time- frames-
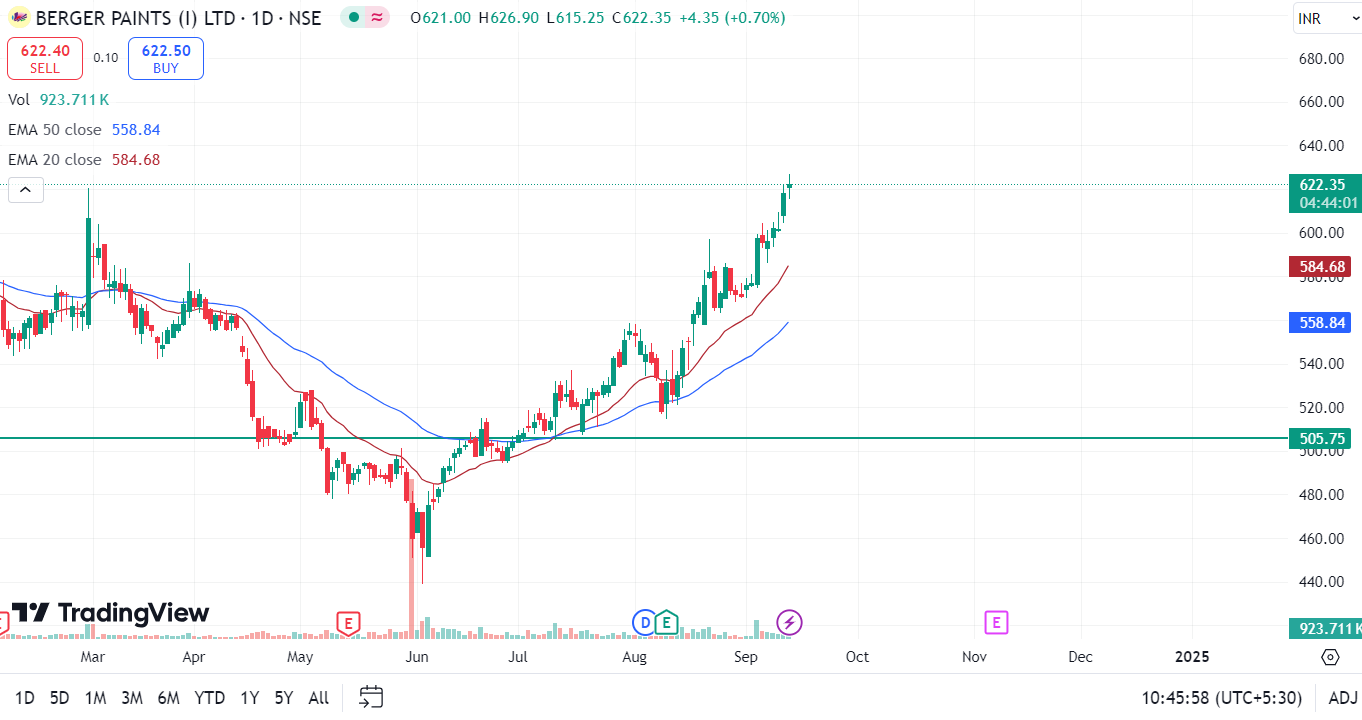
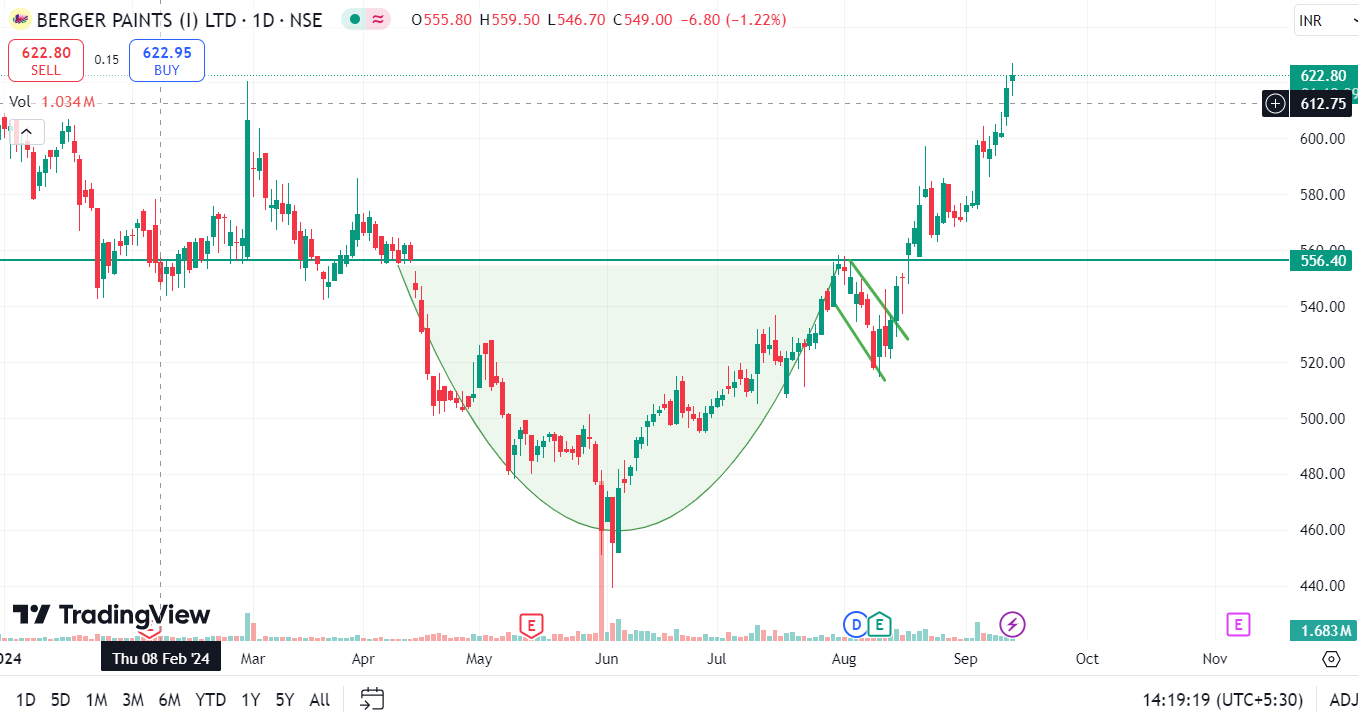
Higher Timeframe (Daily Chart)
You look at the daily chart and notice that the stock is taking a key support level, e.g., a bullish crossover of the 50 and 20 moving averages.
In Berger Paints Ltd.’s daily chart, we can see a bullish crossover of the 50 and 20 moving averages.
So, this signal indicates the potential of the long trend-
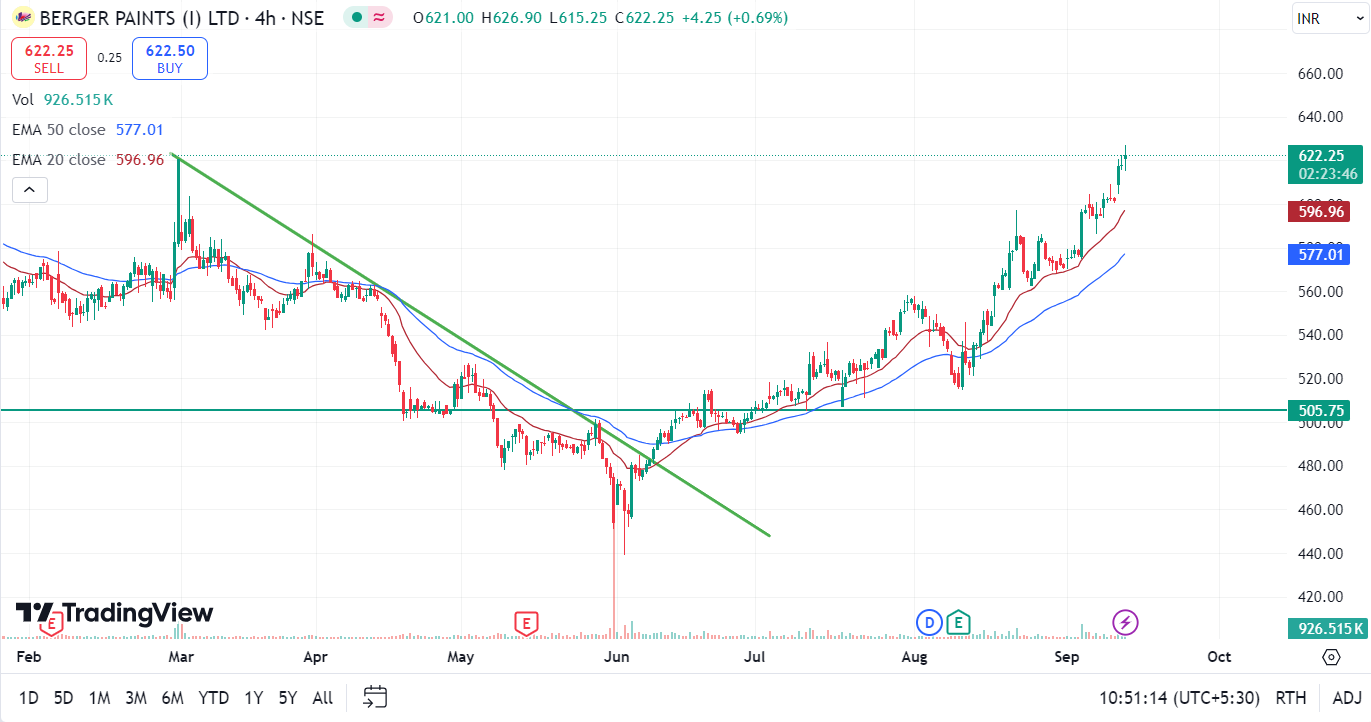
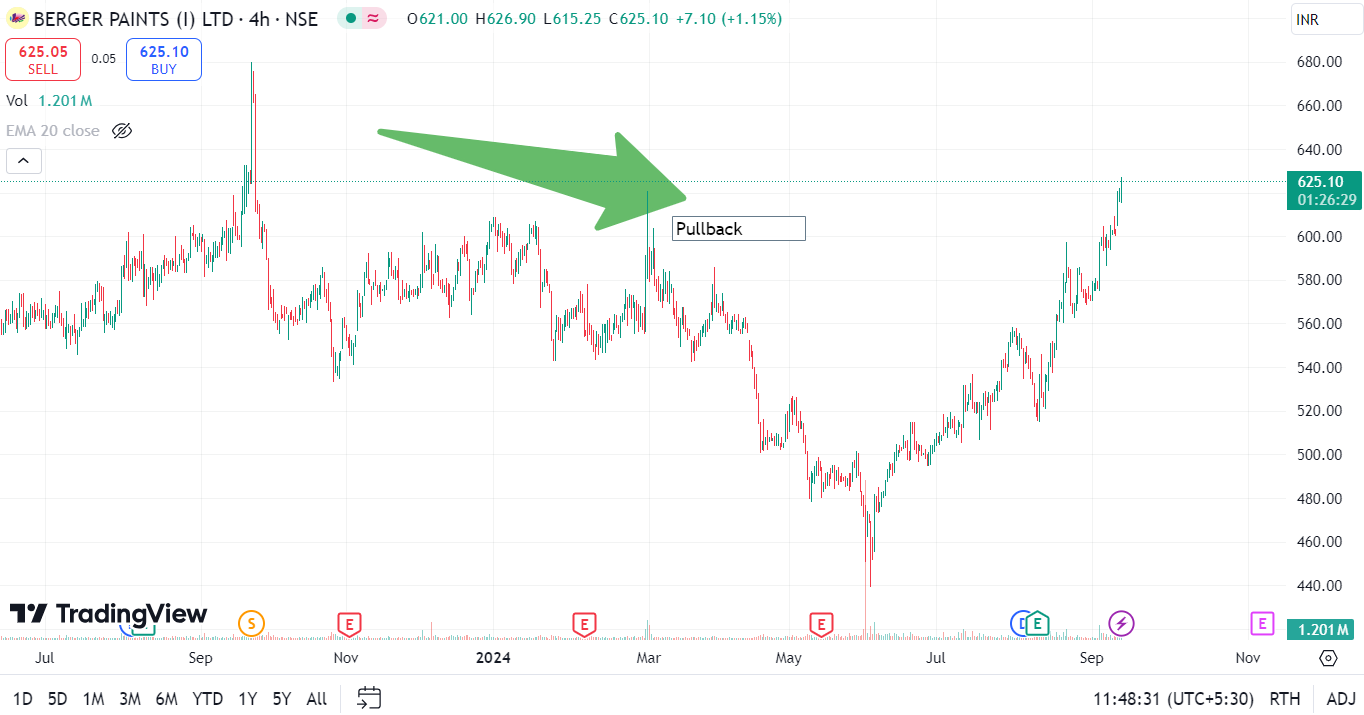
Intermediate Timeframe (4-Hour Chart)
Let us now move to the 4-hourly chart. Here, you notice a trendline breakout with volume, which shows that the buyers are stepping in.
This is a signal of bullish reversal confirmation at support.
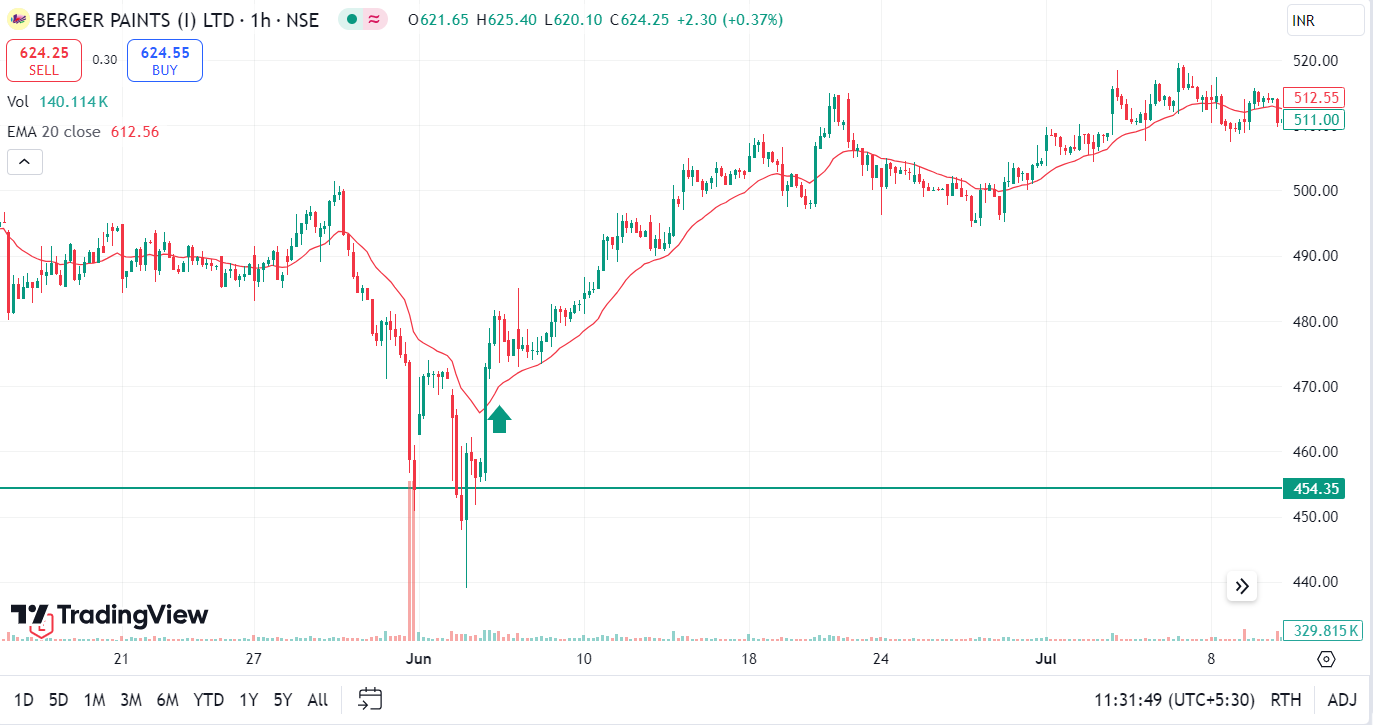
Lower Timeframe (1-Hour Chart)
You zoom into the 1-hour chart and identify a bullish divergence in the RSI (Relative Strength Index), signalling a potential upward move.
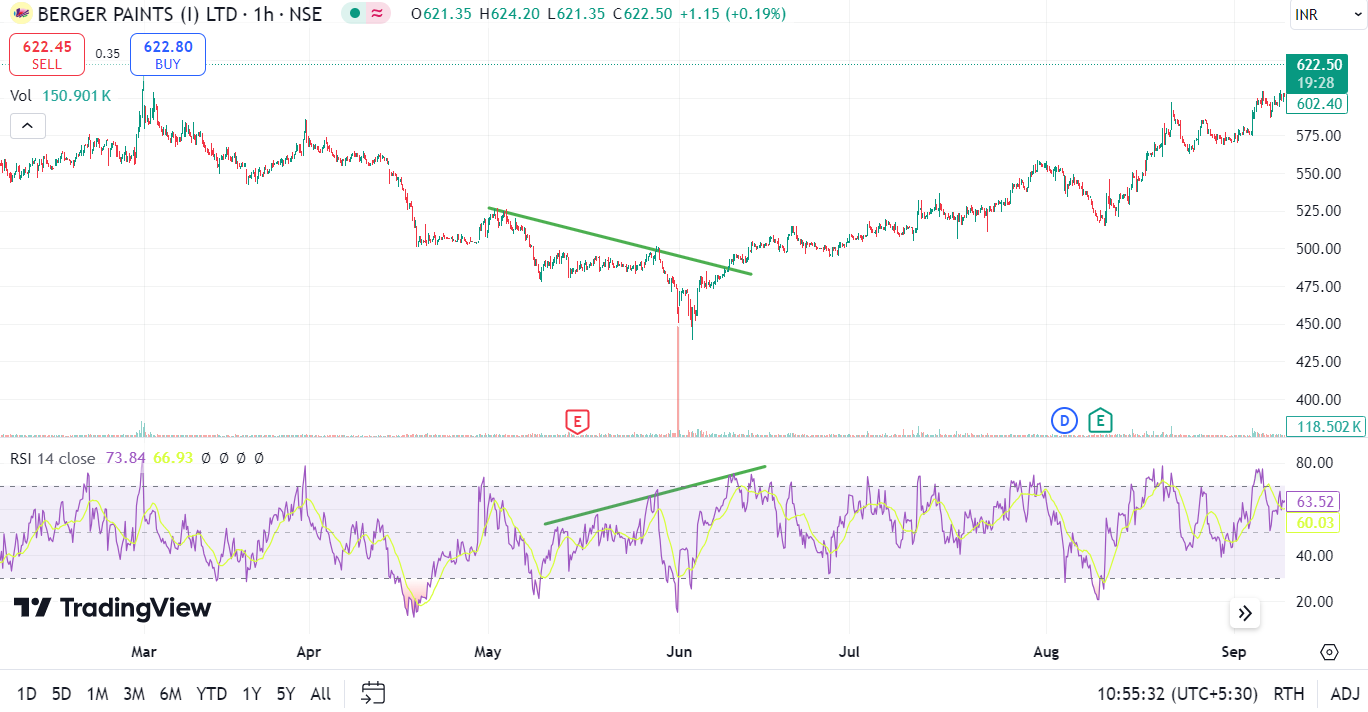
Thus, all the signals in different charts indicate that momentum is aligning with the reversal.
3. Adaptability to Market Signals
Markets move in cycles. Multi-timeframe analysis helps traders stay adaptable by providing insights into both the short-term and long-term dynamics.
This adaptability helps the traders analyse market reversals, consolidation phases, and other conditions better, which might otherwise go unnoticed.
Steps to Do Multi-Timeframe Analysis
Below are the steps to do a Multi-Timeframe Analysis –
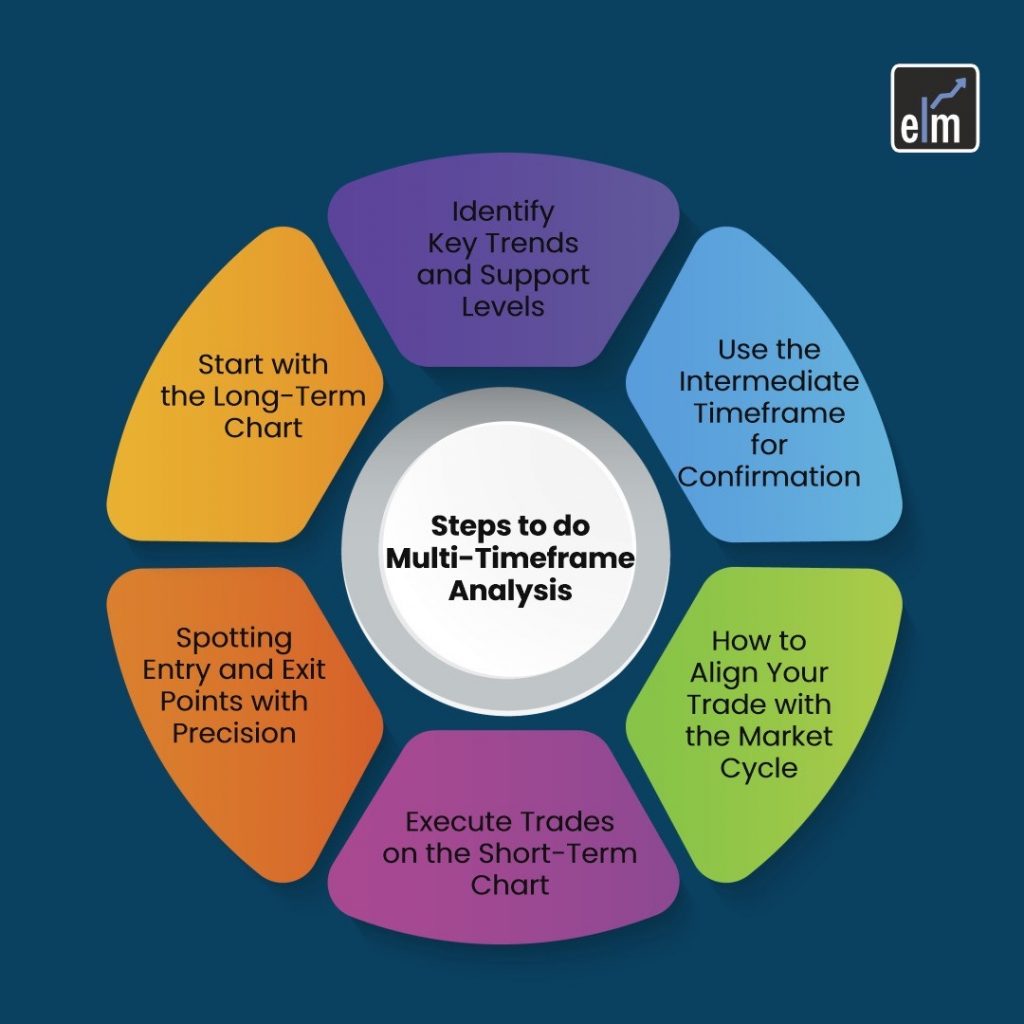
1. Start with the Long-Term Chart
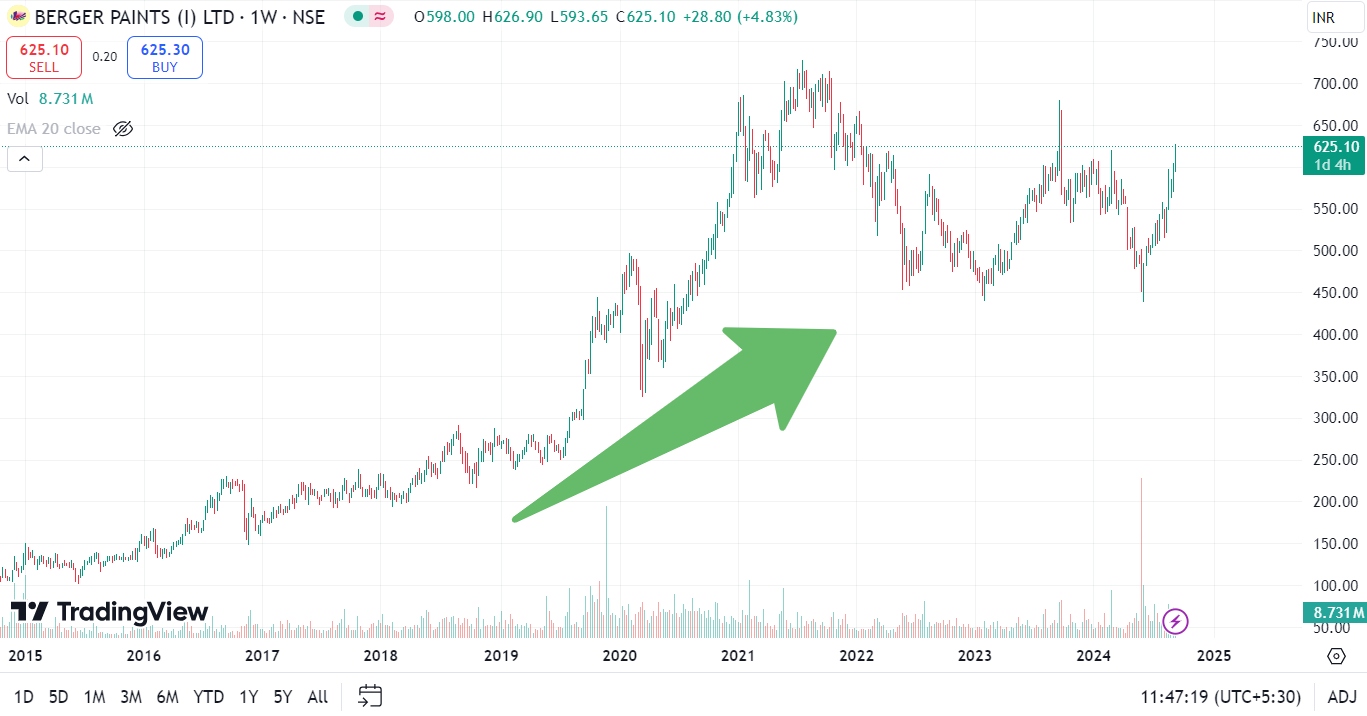
Start by analysing longer-time frame charts, such as monthly or weekly charts. This will help the traders get a broader perspective of the direction and important support and resistance levels.
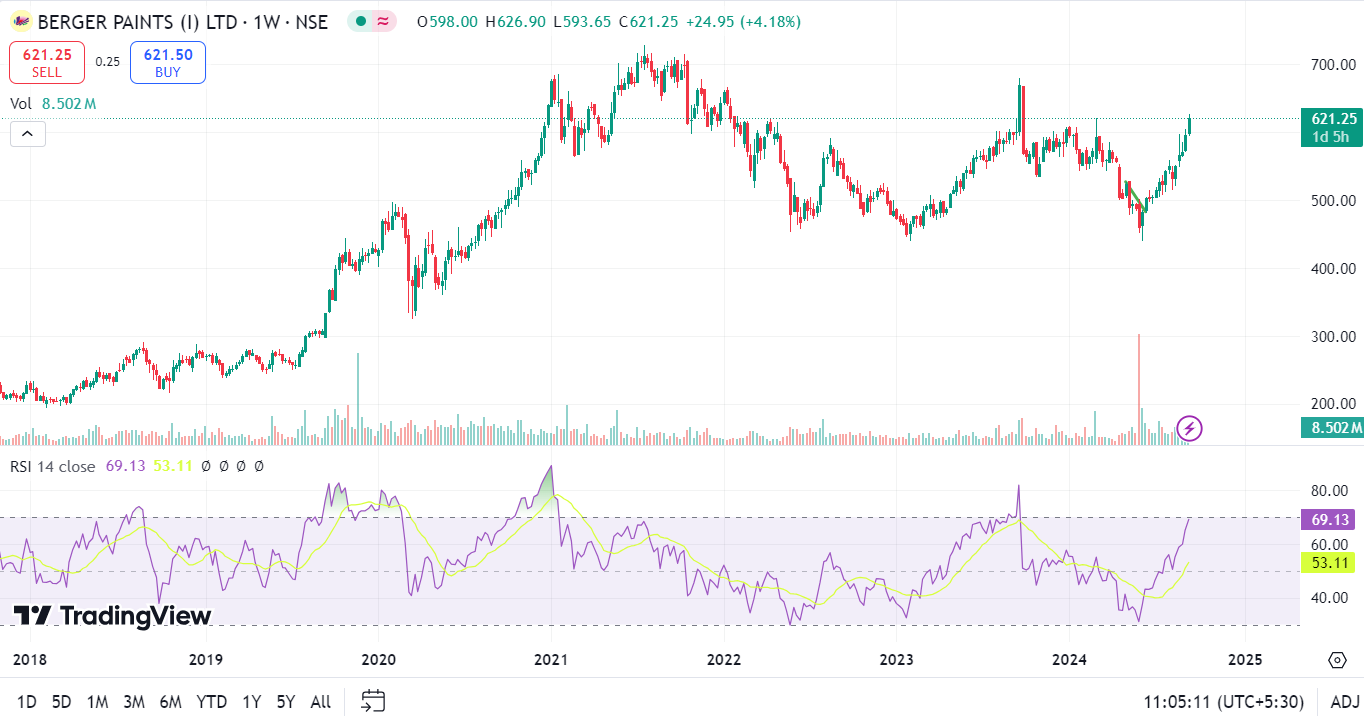
From the above Weekly chart of Berger Paints, we can see that the prices are on the uptrend. So, you will wait for a pullback to enter the stock.
2. Identify Key Trends and Support Levels
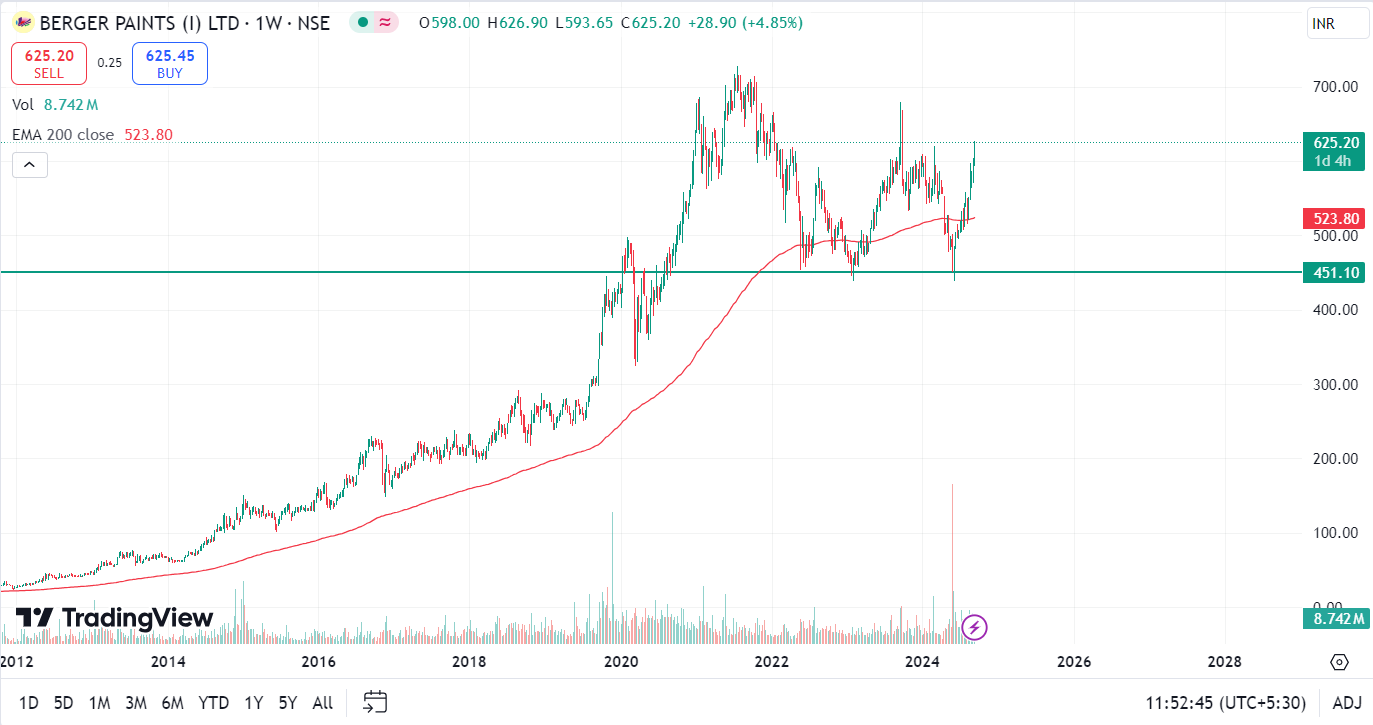
Mark the key support and resistance levels on the weekly charts as shown below.
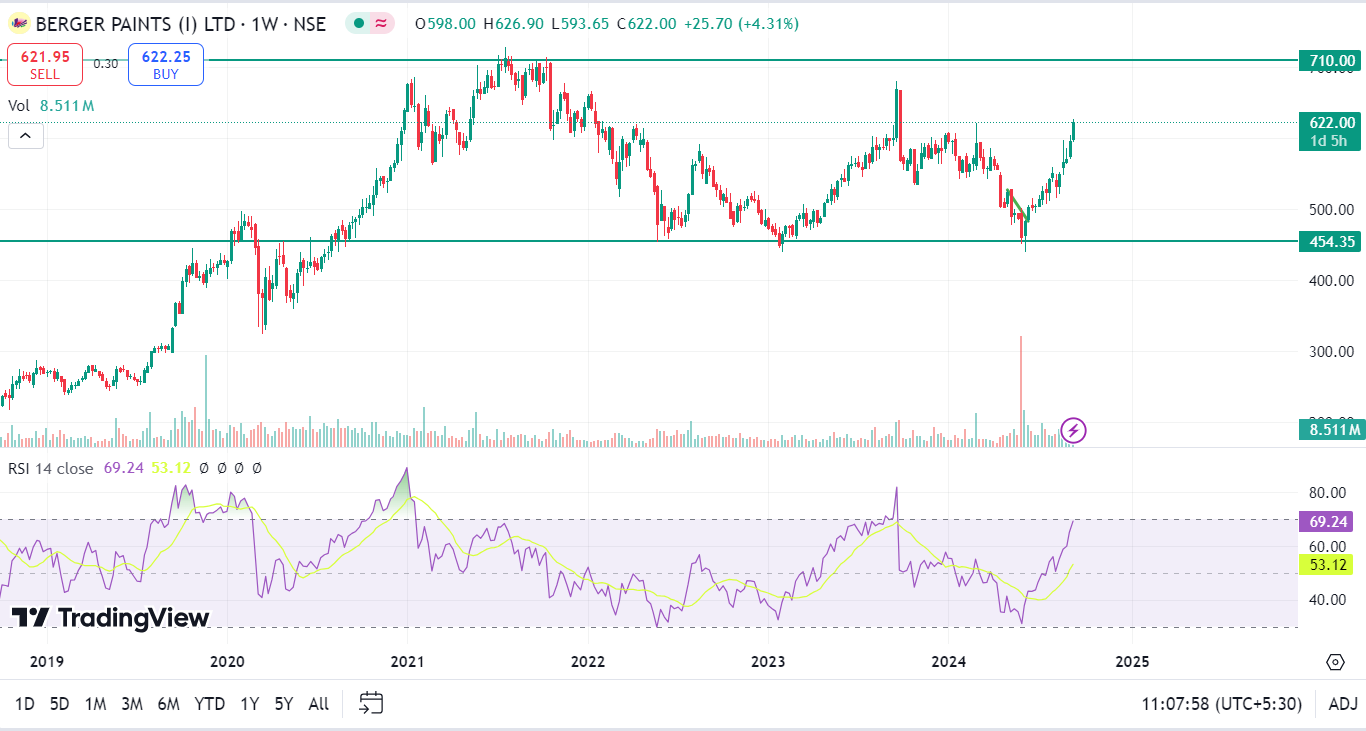
These levels could be reference points for your trades on lower timeframes.
3. Use the Intermediate Timeframe for Confirmation
Now, come to the lower Timeframe, the daily chart.
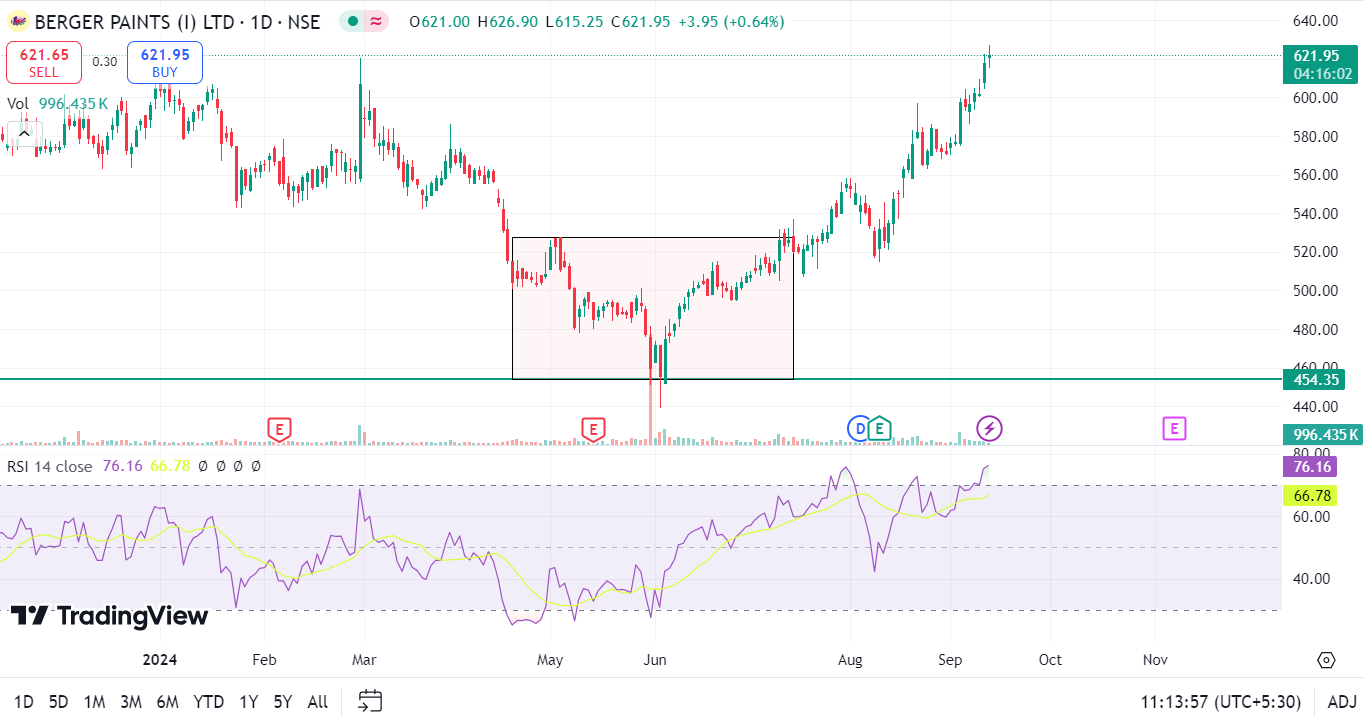
On the daily chart, you may see a consolidation phase within the broader uptrend, as seen in the weekly chart. This would suggest that the market is temporarily range-bound, providing an opportunity to wait for a breakout before entering a trade.
4. Align Your Trade with the Market Cycle
Align your trade based on the market’s current phase—whether it’s trending, ranging, or reversing. The intermediate time frame will help identify this phase.
If the daily chart shows the stock is approaching a breakout from a key resistance level, it signals that the price might continue the upward trend seen in the weekly chart. A breakout trade aligned with both timeframes strengthens your position.
5. Execute Trades on the Short-Term Chart
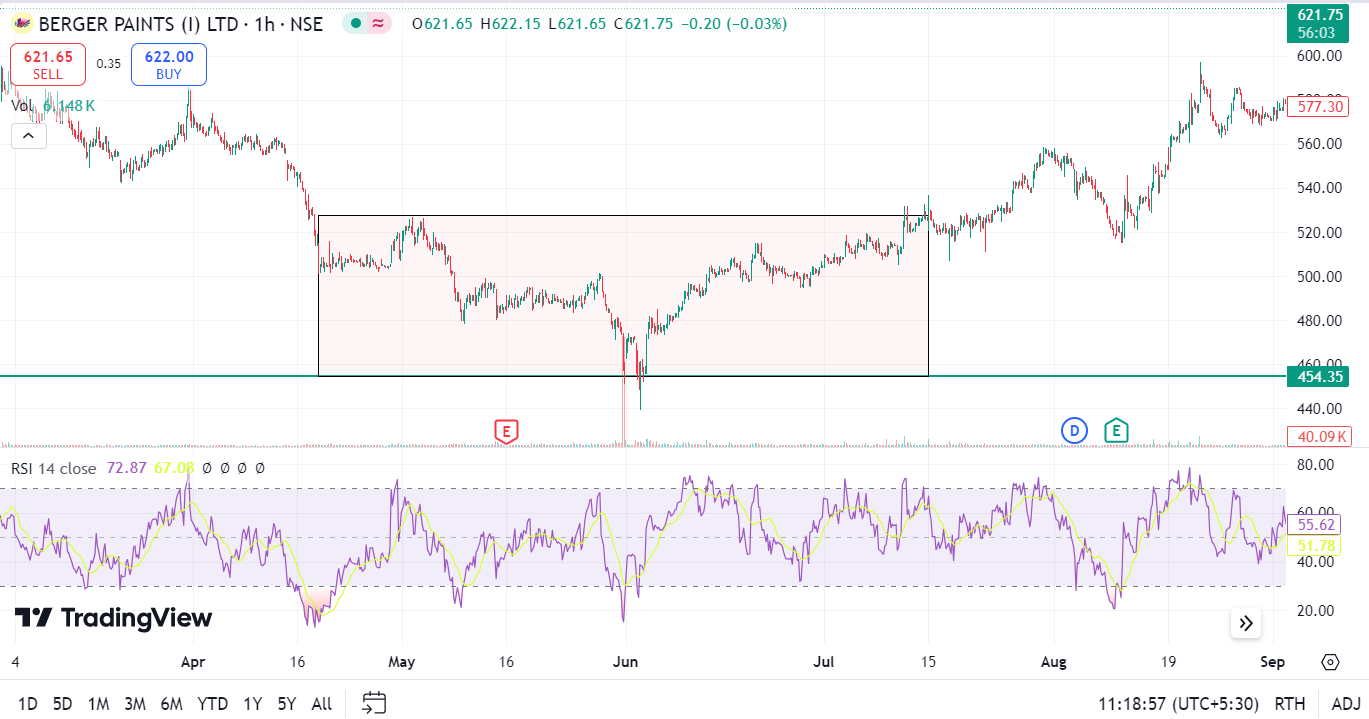
Finally, switch to a shorter timeframe, e.g., an hourly chart to find entry and exit points. The shorter time frame allows you to zoom in on the details, such as minor retracements or reversals.
Let’s say on the 1-hour chart, you notice a breakout from the consolidation with volume. This could be signal to enter the trade.
6. Spotting Entry and Exit Points with Precision
Traders can use technical indicators, patterns, and price action on the short-term chart to determine the exact entry and exit points.
On the 1-hour chart, if the price crosses above the 20-period moving average or forms a bullish Marubozu candlestick near a support level, you can enter a long position. For exits, look for resistance zones or a reversal signal to lock in profits.
5 strategies for Mult timeframe Analysis and Trading
Here are some strategies for Mult timeframe Analysis and Trading
1. Trend Following Strategy
This multi-timeframe strategy involves identifying the primary trend on a higher timeframe and then using a lower timeframe to enter and exit trades in the same direction. This validates that your trades align with the prevailing market momentum.
Traders can use a daily or weekly chart to identify the overall trend (uptrend, downtrend, or sideways).
Traders can use an hourly or 4-hour chart to find pullbacks or retracements that align with the higher timeframe trend.
If the weekly chart shows a strong uptrend, look for a pullback on the 4-hour chart to buy at a lower price.
2. Multi-Time Frame Confluence Strategy
This strategy involves aligning technical signals across different timeframes to improve the probability of success.
In this strategy, traders look for confluence when the same support/resistance levels, trendlines, or moving averages appear on different timeframes.
Identify key levels such as Fibonacci retracements, support/resistance zones, or moving averages in the higher timeframe (daily/weekly).
Traders can check for confluence on shorter timeframes, such as hourly, by looking for similar price patterns or signals at the same levels.
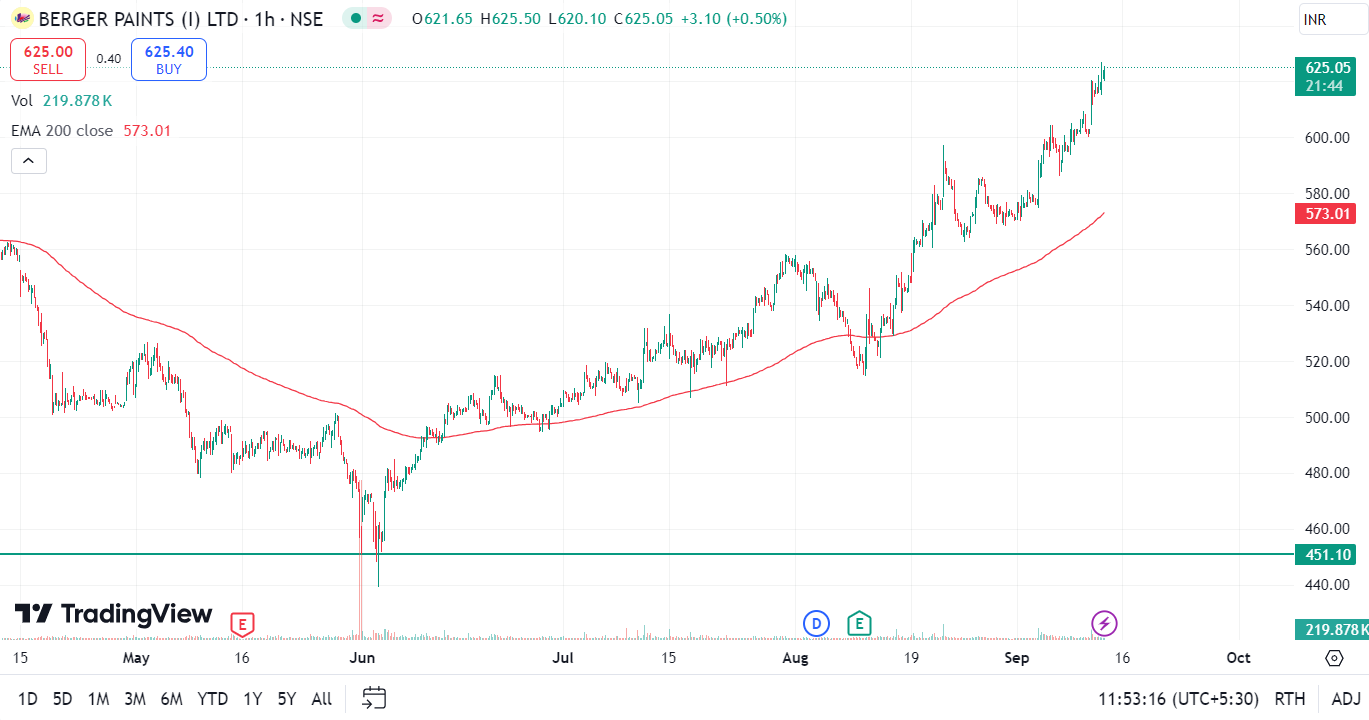
If both the daily and hourly charts show the price bouncing off a 200-day moving average, as shown above, it provides more decisive confirmation that this level is important.
3. Price Pattern Strategy
This multi-timeframe strategy involves identifying chart patterns like head and shoulders, double tops/bottoms, or triangles on higher timeframes and then identifying the entry on lower timeframes for better precision.
Traders can identify larger chart patterns on the weekly or monthly charts. Below is an example of Double Bottom Pattern in the monthly chart of Berger Paints Ltd-
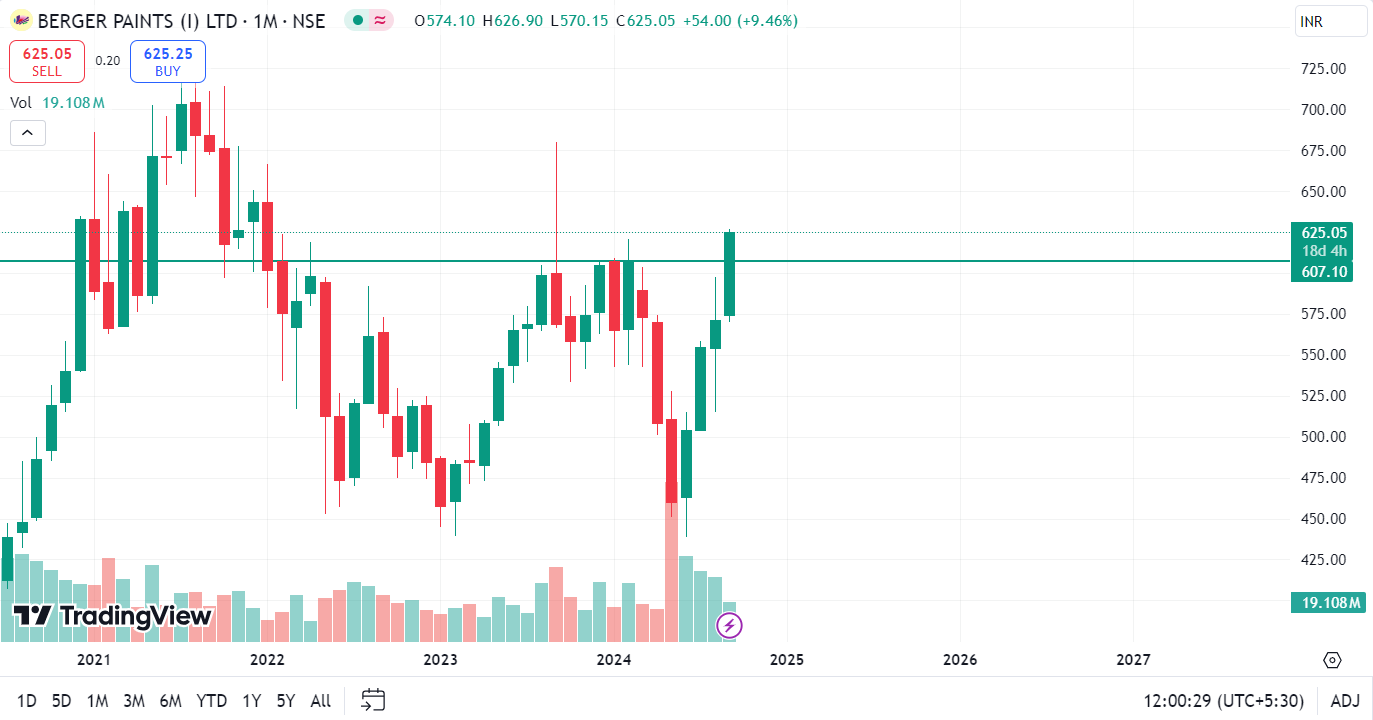
Zoom into shorter timeframes, such as hourly charts, to look for early breakout or breakdown points within the pattern.
Suppose you identify a double bottom pattern on the monthly chart; use the daily chart to pinpoint the exact moment of the breakout or breakdown and execute your trade.
4. Macro-Micro Synergy
The Macro-Micro Synergy strategy connects broader macroeconomic trends with lower timeframe technical analysis.
Start by analyzing broader macroeconomic trends that impact the auto industry. This could include:
- Lower interest rates often boost auto sales as financing becomes cheaper. Conversely, rising rates may slow down auto purchases.
- A strong economy with high consumer confidence can lead to increased auto sales, whereas a weak economy may reduce demand.
- Rising oil prices can impact auto sales, especially for gas-powered vehicles, as consumers might prefer more fuel-efficient or electric vehicles.
Once you’ve identified a favorable macro trend, zoom into Auto charts- lower timeframes (daily, 4-hour) for technical analysis to find optimal entry points.
5. Multi-Layered Breakout System
The Multi-Layered Breakout System involves identifying breakout zones on higher timeframes and then waiting for confirmation on lower timeframes to ensure the breakout is valid.
Traders can use a daily or weekly chart to spot key breakout levels of major resistance or support.
Then, they can use a shorter timeframe, say daily or hourly charts, to confirm that the breakout is not a false move. They can look for indicators like volume, candlestick patterns, or a moving average crossover for confirmation.
Combine Price Action with Multi-Timeframe Analysis
Multi-time frame analysis allows a trader to observe the price action in various timeframes to improve his decision-making.
This approach is based on the fact that price patterns such as head and shoulder, double bottom, and cup and handle are more visible in longer-term time frames.
Suppose, according to the Dow Theory, the prices are in a downtrend, and at the bottom, you see a bullish reversal price pattern forming, such as a cup and handle.
So, with the help of Multiple Time frame analysis, a trader can not only understand the big picture but also get better entry–exit points on a trade.
Some Additional Tips
Here are some bonus tips for efficiently doing multi-timeframe analysis-
- Traders should use consistent timeframes for clarity. For example: Weekly-Daily- 4-Hour or Daily – 4-Hour – 1-Hour.
- Traders should use a maximum of three timeframes: long-term, medium-term, and short-term.
- Traders should always weigh the higher timeframe trend more heavily.
- Traders should use indicators like the 50-period and 200-period moving averages consistently across timeframes to identify trends and key levels.
Frequently Asked Questions (FAQs)
Why is multi-timeframe analysis important for trading?
Multi-timeframe analysis combines many things that can be used to make an informed trading decision. It helps traders arrive at a broader view from a larger time frame. At a lower timeframe, traders can select the entry and exit levels.
What are the key timeframes used in multi-timeframe analysis?
In multi-timeframe analysis, the key timeframes include a higher timeframe, such as the long-term monthly or weekly charts, a medium timeframe, such as daily charts, and a lower timeframe for entry points and fine-tuning signals like hourly charts.
How does multi-timeframe analysis improve trading decisions?
Multi Timeframe Analysis helps traders see the bigger picture- the market as a whole, that can reduce the risk of making hasty decisions based on shorter timeframe charts.
Can beginners use multi-timeframe analysis?
Yes, beginners should use multi-timeframe analysis to make better and more informed trading decisions.
Is multi-timeframe analysis applicable to all types of trading?
Yes, multi-timeframe analysis is applicable for trading in all types of assets.
How often should I review my charts in multi-timeframe analysis?
When doing multi-timeframe analysis, you should review your charts regularly, mainly focusing on the higher timeframes to identify overall trends and then checking the lower timeframes for entry points.
The Conclusion
We can conclude that multi-time frame analysis can help us make more informed decisions by combining different things at a time. The five strategies discussed above will help you to improve your trading outcomes. By focusing on both the bigger picture and smaller details, traders will be able to manage risks and time their trades more efficiently.


