Elearnmarkets - Financial Market Learning
  • Courses
  • Webinars
  • Stories
  • Language
    • English
    • Hindi
    • Bengali
No Result
View All Result
Get Free Course
  • Basic Finance
  • Derivatives
    • Futures
    • Options
  • Financial Planning
  • Fundamental Analysis
  • Technical Analysis
  • Mutual Funds
  • Marketshala
  • Miscellaneous
Elearnmarkets - Learn Stock Market, trading, investing for Free
  • Courses
  • Webinars
  • Stories
  • Language
    • English
    • Hindi
    • Bengali
No Result
View All Result
Get Free Course
Elearnmarkets - Learn Stock Market, trading, investing for Free
No Result
View All Result
Home Technical Analysis
A Unique Way of Using Relative Strength Index (RSI) Indicator by Mr Bharat Jhunjhunwala 1

A Unique Way of Using Relative Strength Index (RSI) Indicator by Mr Bharat Jhunjhunwala

Elearnmarkets by Elearnmarkets
April 30, 2024
in Technical Analysis
Reading Time: 8 mins read
0
8.2k
VIEWS
Share on FacebookShare on XShare on WhatsApp

In an interesting session as a part of the highly popular Face2Face series, conducted by Elearnmarkets, Mr Vivek Bajaj, Co-founder of Elearnmarkets, invited Mr Bharat Jhunjhunwala, a successful stock market investor with many years of experience, to decode A Unique Way of Using Relative Strength Index (RSI) Indicator.

Mr Bharat Jhunjunwala have done extensive research and study in the stocks and have degrees in CMT & CFT. He has created his technical indicator and also completed his master’s. He will talk about how he developed a passion for the markets in 2008 and made profits during a crash.

This blog will discuss everything about the Relative Strength Index, aka the RSI. The speaker will talk about a strategy which he thinks will benefit many retail investors. Combining price action with the RSI indicator, Mr Bharat says how practising this indicator will enable traders to identify upcoming changes in the market.

Table Of Contents
  1. Relative Strength Index (RSI) – A Momentum Indicator
  2. RSI Strategy
  3. More Webinars by Mr Bharat Jhunjhunwala 
    • 1. The Super Performance Trading Pattern – Achieving Superperformance with Limited Capital
    • 2. Strength Zones on RSI & Signals to trade at those zones
    • 3. Identifying Mutlibaggers using RSI Range Rules
  4. You can watch the entire video here
  5. Bottomline

Relative Strength Index (RSI) – A Momentum Indicator

First of all, if anything is derived from price, then it will be able to explain anything only after the closing of the price.

So, if you want any confirmation or any price action, you first need to understand the price and then confirm it using RSI.

After reading many books on Momentum by Martin Pring, an expert in momentum, Mr Bharat concluded from his books that momentum is such an indicator that it gives you hints way before about an ongoing trend, whether it is getting weaker or stronger.

So, as we say, in X-ray vision that it gives us momentum. So if we can’t see that on a daily chart, then it might be possible that we could see it on a small-time frame chart.

We also call it fractal or fractal nature. You get a solid and powerful trading system if you mix the fractal nature of price action with momentum.

You can use it at your convenience because it’s too flexible, and there is no such set of stringent rules.

RSI Strategy

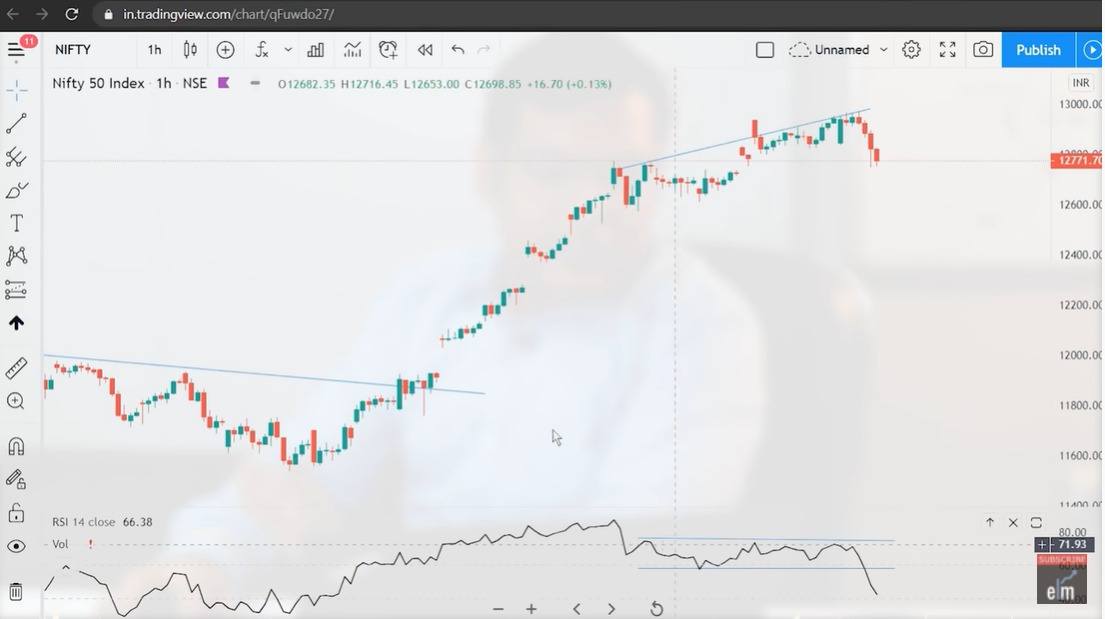
Mr Bharat Jhunjhunwala explains his RSI strategy with the help of the Nifty chart as shown below:

relative strength index

He tells us to look at the candle of 3rd November; that was when the market got better. So, after 3rd November, this candle got closed, and on 4th November, it broke the red line here, and the prices are making higher highs and are getting closed at higher highs.

And if you see there, the colours of candles are changing, and markets are explaining a different story.

Now, try to understand the price action or “try to understand the tempo of the market or the market’s speed”.

See, there were only green candles which clearly shows that only buying is happening and here comes the first red candle, which is our first hint that someone has started a little bit of selling.

It’s not in our hands to change the colours of the candles, which shows that someone has started selling. And here, one green candle and after those two consecutive red candles show more people are selling now.

Though the price is going up, he got the hint that something somewhere is being sold because if you see the candles only, then there are continuous green candles and suddenly the colours of candles start getting changed, which means the market is getting slowed down or somewhere someone is selling. 

Now he took us to the small-time frame in hourly charts. As he said, the market is slowing down, which is clearly shown here through divergence.

Also, divergence is a misunderstood concept because people get excited and think that the market closes at divergence, which is just a myth. Divergence generally slows down the ongoing trend like detours.

Here comes the divergence, and after this, if you read the market correctly, you can benefit from it.

A Unique Way of Using Relative Strength Index (RSI) Indicator by Mr Bharat Jhunjhunwala 2

He explains that like this is a divergence, and if we talk about range rules, you might have heard about 60-40, but nothing is fixed in the market. Like your habits are different, and your traits are different. 

So, it’s unnecessary that if 60-40 is getting followed at Nifty, it will also be followed at Bank Nifty because both have different characters.

Likewise, it’s not necessary that if 60-40 is being followed in HDFC, it will also be followed at DLF similarly.

As the name suggests, Relative Strength Index, so nothing is absolute, and we cannot make it absolute.

Mr Bharat tells us that Nifty created its RSI range, not 60-40. It’s almost between 75 and 55and almost for the last three days, it’s been trading between 75 and 55, and we also got an additional divergence.

So, it explains two things. First, the divergence indicates that the trend might not change, but the market may slow down in the upcoming days.

Next, RSI is struck here, also known as RSI compression, and this is a very powerful signal.

You can also do our course on RSI Made Easy

This compression is so powerful that you can catch the tops if you can read them. See, if this compression is the top of Nifty, then this compression will let me know in the upcoming one or two days that Nifty might have created a small top, major top etc.

A Unique Way of Using Relative Strength Index (RSI) Indicator by Mr Bharat Jhunjhunwala 3

Further, he explains the range rule on a short-term chart. Though you can use range rules on every kind of chart, whether you are a short-term trader or scalper or long term trader or an investor, you can use these range rules on every time frame chart using the same method.

More Webinars by Mr Bharat Jhunjhunwala 

1. The Super Performance Trading Pattern – Achieving Superperformance with Limited Capital

The presentation intends to guide on how anyone can achieve above-average returns in trading even with small capital. This is not a capital extensive strategy. This strategy does not involve your full-time attention on the screen.

2. Strength Zones on RSI & Signals to trade at those zones

This Webinar is all about understanding the beautiful relationship between price and momentum. This session will discuss the details of the RSI indicator and understand the importance of momentum in the world of trading. 

Get to know the simple yet versatile nature of the RSI indicator. Learn how to use RSI for successful trading. With RSI, you will be able to keep your trading simple yet effective.

3. Identifying Mutlibaggers using RSI Range Rules

RSI is one of the most versatile and important indicators in the field of Technical analysis. In this webinar, we take a deeper dive into RSI and discuss strategies for using it. You will learn to combine RSI range rules and simple price patterns to pick out very high probability stocks which may give super normal returns. 

Range Rule was introduced by Mr Andrew Cardwell but is often used incorrectly by traders. In this webinar, we will focus on the correct use of the range rules and pull out multi-baggers.

You can watch the entire video here

Bottomline

We hope you found this blog informative and use it to its maximum potential in the practical world.

Interested in similar topics, then checkout our technical analysis course and explore the world of technicals even deeper.

Also, show some love by sharing this blog with your family and friends and helping us in our mission of spreading financial literacy.

Happy Investing!

You can also visit web.stockedge.com, a unique platform that is 100% focused on research and analytics.

Tags: englishRelative STrength Indextechnical analysis
ShareTweetSend
Get Kotak Offer Get Kotak Offer Get Kotak Offer
Previous Post

Best 5 Market Breadth Indicators

Next Post

Relative Strength Index (RSI) Range Shift- A Simple but Effective Trading Strategy

Elearnmarkets

Elearnmarkets

Elearnmarkets (ELM) is a complete financial market portal where the market experts have taken the onus to spread financial education. ELM constantly experiments with new education methodologies and technologies to make financial education effective, affordable and accessible to all. You can connect with us on Twitter @elearnmarkets.

Related Posts

Understand Slippage in Trading
Technical Analysis

What is Slippage in Trading? Meaning & Examples

March 28, 2025
294
Breakout trading strategies
Technical Analysis

Top 5 Breakout Trading Strategies

March 12, 2025
1.1k
5 stocks for today
Technical Analysis

5 Stocks to Buy Today That Could Beat the NIFTY in 2025!

May 5, 2025
395
Image describing What is marginal trading facility
Technical Analysis

 What is a Margin Trading Facility? Advantages & Risks

April 4, 2025
661

Leave a Reply Cancel reply

Your email address will not be published. Required fields are marked *

Disclaimer

Elearnmarkets (Kredent InfoEdge Pvt. Ltd.) is a SEBI-registered Research Analyst (RA) entity (SEBI Registration No.: INH300007493). The information provided in this article is for educational and informational purposes only and should not be considered as an offer to buy or sell any securities or investment products.

The stocks, securities, and investment instruments mentioned herein are not recommendations under SEBI (Research Analysts) Regulations, 2014. Readers are advised to conduct their own due diligence and seek independent financial advice before making any investment decisions.

Investments in securities markets are subject to market risks. Please read all related documents carefully before investing. Investing in Equity Shares,
Derivatives, Mutual Funds, or other instruments carry inherent risks, including potential loss of capital. Elearnmarkets (Kredent InfoEdge Pvt. Ltd.) does not provide any guarantee or assurance of returns on any investments. Past performance is not indicative of future performance.

Elearnmarkets Logo

Follow Us

Facebook-f X-twitter Instagram Linkedin-in Youtube Telegram

Register on Elearnmarkets

Continue your financial learning by creating your own account on Elearnmarkets.com

Register Free Account

Download App

Playstore logo
Download on app store

Categories

  • Basic Finance
  • Derivatives
  • Financial Planning
  • Fundamental Analysis
  • Technical Analysis
  • Mutual Funds
  • Miscellaneous

Popular On Elearnmarkets

  • Market Superheroes:
  • Vivek Bajaj
  • Chetan Panchamia
  • Ashish Kyal
  • Premal Parekh
  • Abhijit Paul
  • Jegan
  • Sivakumar Jayachadran
  • Jyoti Budhia
  • Vivek Gadodia
  • Vishal Mehta
  • Piyush Chaudhry
  • Santosh Pasi
  • Gomathi Shankar
  • Market Superheroes:
  • Vivek Bajaj
  • Chetan Panchamia
  • Ashish Kyal
  • Premal Parekh
  • Abhijit Paul
  • Jegan
  • Sivakumar Jayachadran
  • Jyoti Budhia
  • Vivek Gadodia
  • Vishal Mehta
  • Piyush Chaudhry
  • Santosh Pasi
  • Gomathi Shankar
  • Courses:​
  • Options Trading
  • Dow Theory
  • Momentum Trading
  • Stock Investing
  • Harmonic Chart Patterns
  • Algo Trading
  • Elliot Wave Theory
  • Advanced Excel
  • Cryptocurrency
  • NSE Certification Course
  • Courses:​
  • Options Trading
  • Dow Theory
  • Momentum Trading
  • Stock Investing
  • Harmonic Chart Patterns
  • Algo Trading
  • Elliot Wave Theory
  • Advanced Excel
  • Cryptocurrency
  • NSE Certification Course
  • Webinars:
  • Bank Nifty Scalping
  • Intraday Trading Strategies
  • Options Trading Strategies
  • Options selling
  • Price Action
  • Relative Strength
  • Tax Planning
  • Options Buying
  • Growth Stocks
  • Portfolio Management
  • Risk Management
  • Renko Charts
  • Crude Oil
  • Traders Psychology
  • Moving Average
  • Multibagger Stocks
  • Free Learning Modules:
  • Intraday Trading
  • Options Scalping
  • Swing Trading
  • Financial Modelling
  • RSI Indicator
  • Bollinger Bands
  • Pricing of Futures
  • Personal Finance
  • Initial Public Offerings (IPO)
  • Value Investing
  • Technical Indicators
  • Candlesticks
  • Chart Patterns
  • Option Greeks
  • ELSS Funds
  • Banking and Insurance
  • Real Estate
  • Gold
  • Book Summaries:
  • Rich Dad Poor Dad
  • Psychology of Money
  • The Intelligent Investor
  • The Richest Man in Babylon
  • Think and Trade Like a Champion
  • Value Investing and Behavioural Finance
  • Trading in the Zone
  • Learn to Earn
  • Book Summaries:
  • Rich Dad Poor Dad
  • Psychology of Money
  • The Intelligent Investor
  • The Richest Man in Babylon
  • Think and Trade Like a Champion
  • Value Investing and Behavioural Finance
  • Trading in the Zone
  • Learn to Earn
  • Tools:
  • CAGR Calculator
  • SIP Calculator
  • eLearnOptions
  • Future Value Calculator
  • Present Value Calculator
  • Atal Pension Yojana
  • Cost of Delay Calculator
  • Become a Crorepati
  • Tools:
  • CAGR Calculator
  • SIP Calculator
  • eLearnOptions
  • Future Value Calculator
  • Present Value Calculator
  • Atal Pension Yojana
  • Cost of Delay Calculator
  • Become a Crorepati

© 2025 Elearnmarkets. All Rights Reserved

  • Visit Elearnmarkets
  • Courses
  • Webinars
  • Financial Guides
  • Get Free Counselling
  • Visit Elearnmarkets
  • Courses
  • Webinars
  • Financial Guides
  • Get Free Counselling

Download Our App

No Result
View All Result
  • Article Categories
    • Basic Finance
    • Derivatives
    • Financial Planning
    • Fundamental Analysis
    • Technical Analysis
    • ETFs & Mutual Funds
    • Marketshala
    • Miscellaneous
  • Language
    • Hindi
    • Bengali
    • English
  • Courses
  • Webinars
  • Stories
Get Free Course

© 2024 Elearnmarkets All Rights Reserved

A Handbook of Technical Analysis
To start your trading journey as a seasoned technical analyst
Download Guide For FREE
Trading Day 2025