Elearnmarkets - Financial Market Learning
  • Categories
    • Basic Finance
    • Derivatives
      • Futures
      • Options
    • Financial Planning
    • Fundamental Analysis
    • Technical Analysis
    • Marketshala
    • Miscellaneous
  • Language
    • English
    • Hindi
    • Bengali
No Result
View All Result
  • Courses
  • Webinars
  • Stories
Elearnmarkets - Learn Stock Market, trading, investing for Free
No Result
View All Result
Home Technical Analysis
A 5-Star Relative Strength Index (RSI) Strategy by Star Trader Vishal Malkan

A 5-Star Relative Strength Index (RSI) Strategy by Star Trader Vishal Malkan

Elearnmarkets by Elearnmarkets
September 13, 2023
in Technical Analysis
Reading Time: 7 mins read
0
18.9k
VIEWS
Share on FacebookShare on XShare on WhatsApp

In an interesting session as a part of the highly popular Face2Face series, conducted by Elearnmarkets, Mr Vivek Bajaj, Co-founder of Elearnmarkets, invited Mr Vishal Malkan, a successful stock market investor with many years of experience, to decode A 5-Star Relative Strength Index (RSI) Strategy.

In this blog, we will be decoding the basics of the Relative Strength Index indicator and its multiple applications in the stock market for technical analysis. Following this, Mr Malkan will start discussing his strategy – a 5-star strategy.

First, we will discuss how Mr Malkan created his strategy and the basics around RSI and its components, like range shift. We will also talk about how one can decide the ranges for the Relative Strength Index indicator on a chart. 

With this, Mr Malkan will then simplify his trading strategy to help traders get the right kind of success with the Relative Strength Index indicator. Finally, he will break down this strategy into different time frames to show its practical application.

Table Of Contents
  1. Relative Strength Index (RSI) and Range Shift Concept
  2. The 5-Star Relative Strength Index (RSI) Strategy-Long
    • Example-
  3. The 5-Star Relative Strength Index (RSI) Strategy-Short
  4. Bottomline

Relative Strength Index (RSI) and Range Shift Concept

According to Mr Vishal Malkan, there are two sides to the Relative Strength Index -conventional and unconventional. The conventional form is the most used form by the traders, i.e. considering above 70 levels as an overbought zone and below 30 as an oversold zone and the bullish or bearish divergence.

But the approach has become objective as most stocks have become double or triple after touching Relative Strength Index 70 levels. Thus, this approach is ineffective as the big move comes after 90.

Mr Vishal Malkan uses the unconventional approach of 60-40 RSI and range shift concept in his trading.

Range Shift is a phenomenon that occurs when the RSI indicator shifts from a predefined range to another predefined range due to the change in the price of the stock.

A 5-Star Relative Strength Index (RSI) Strategy by Star Trader Vishal Malkan 1

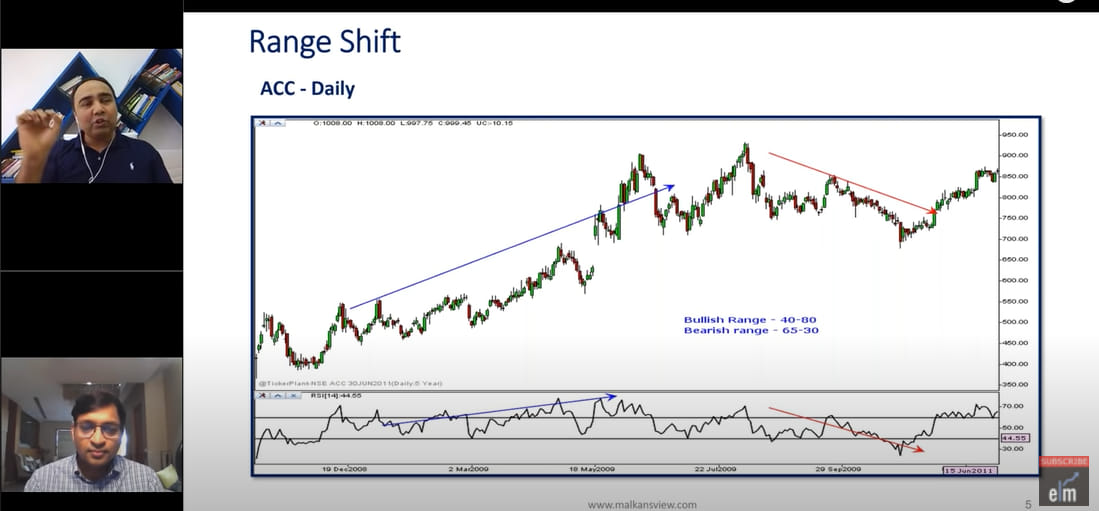
So, there is a different range for RSI Indicator in a bullish market, and in a bearish market, there is a different Relative Strength Index range.

In this case, the range for the Relative Strength Index indicator is 40-80 for a bullish market and 65-30 for a bearish market.

According to him, whenever the market is bearish, it won’t be able to cross 60, and whenever in a bullish trend, it won’t be able to cross 40.

RelatedPosts

5 Powerful Bearish Candlestick Patterns 11

5 Powerful Bearish Candlestick Patterns

November 30, 2023
97.8k
5 Powerful Bullish Candlestick Patterns 12

5 Powerful Bullish Candlestick Patterns

November 30, 2023
134.9k
All 35 Candlestick Chart Patterns in the Stock Market-Explained 13

All 35 Candlestick Chart Patterns in the Stock Market-Explained

November 27, 2023
2.1M
A 5-Star Relative Strength Index (RSI) Strategy by Star Trader Vishal Malkan 2

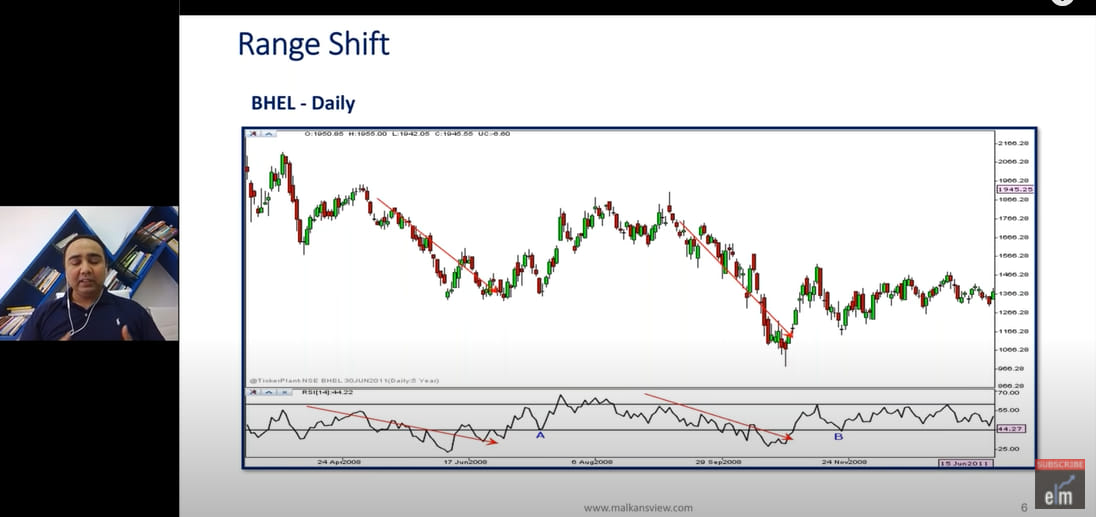
So, instead of the 70-30 Relative Strength Index, we will use the 60-40 range for the RSI indicator for this strategy. We can see the bullish shift from points A and B when the RSI line is gone after the 40 levels.

Also, this range shift concept can be applied in any timeframe, whether intraday, daily, weekly, etc.

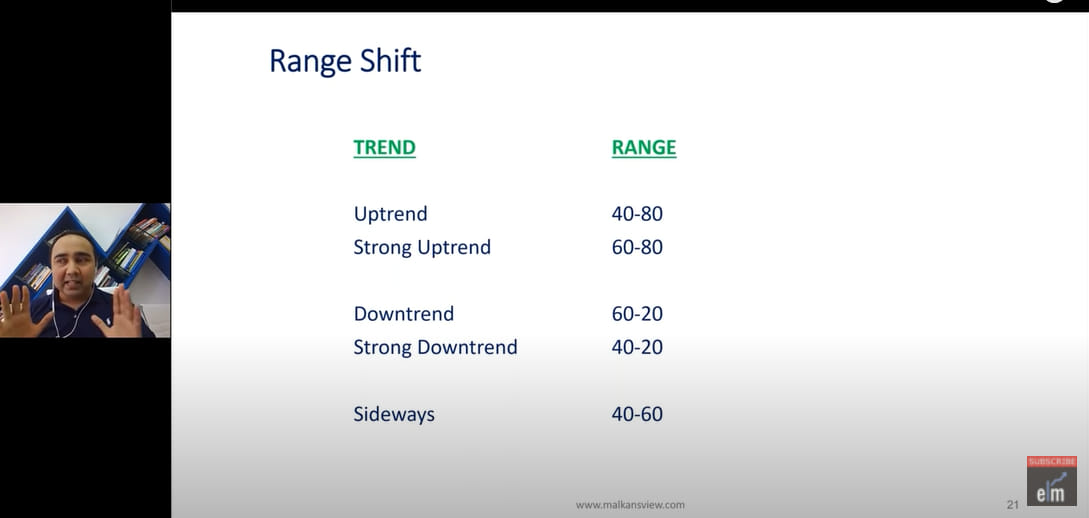
Thus, the range shift concept helps us understand whether the market is bullish, bearish or sideways.

A 5-Star Relative Strength Index (RSI) Strategy by Star Trader Vishal Malkan 3

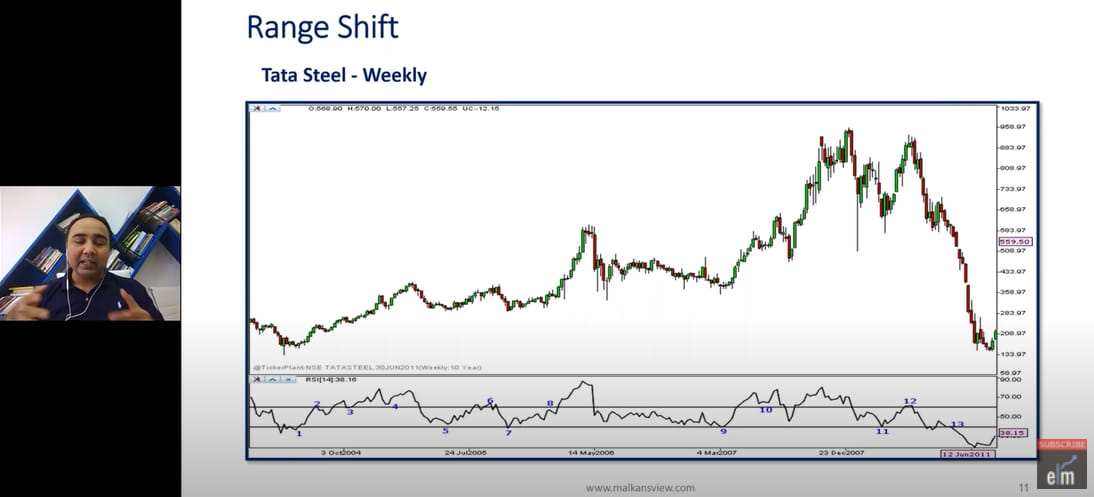
For example, from the above weekly chart of Tata Steel, we can see that 10 is the best buying point as the RSI moves after 60, 11-13 can be considered a sideways market and point 13 is the best-selling point.

We can conclude the following from the above discussion:

A 5-Star Relative Strength Index (RSI) Strategy by Star Trader Vishal Malkan 4

The 5-Star Relative Strength Index (RSI) Strategy–Long

A 5-Star Relative Strength Index (RSI) Strategy by Star Trader Vishal Malkan 5

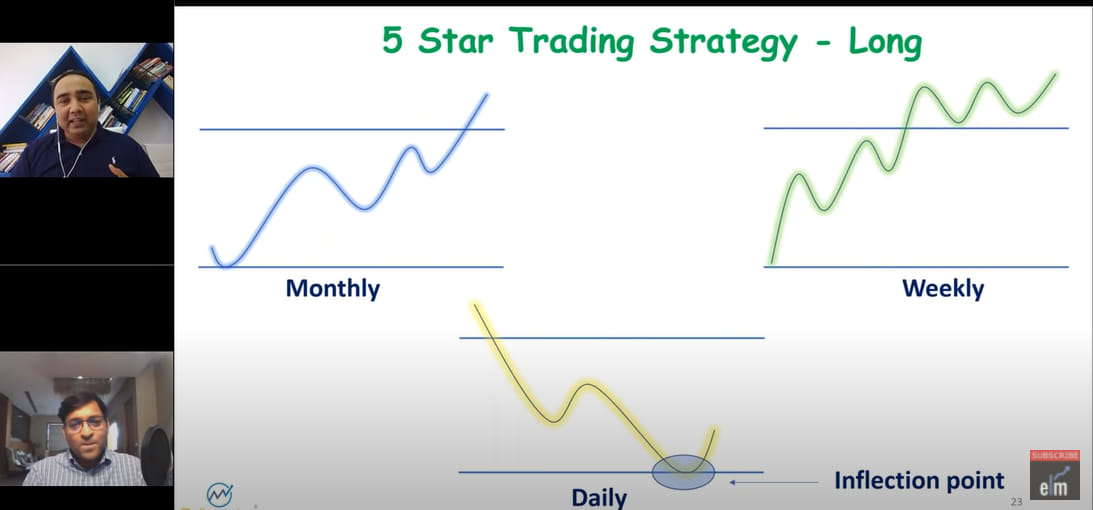
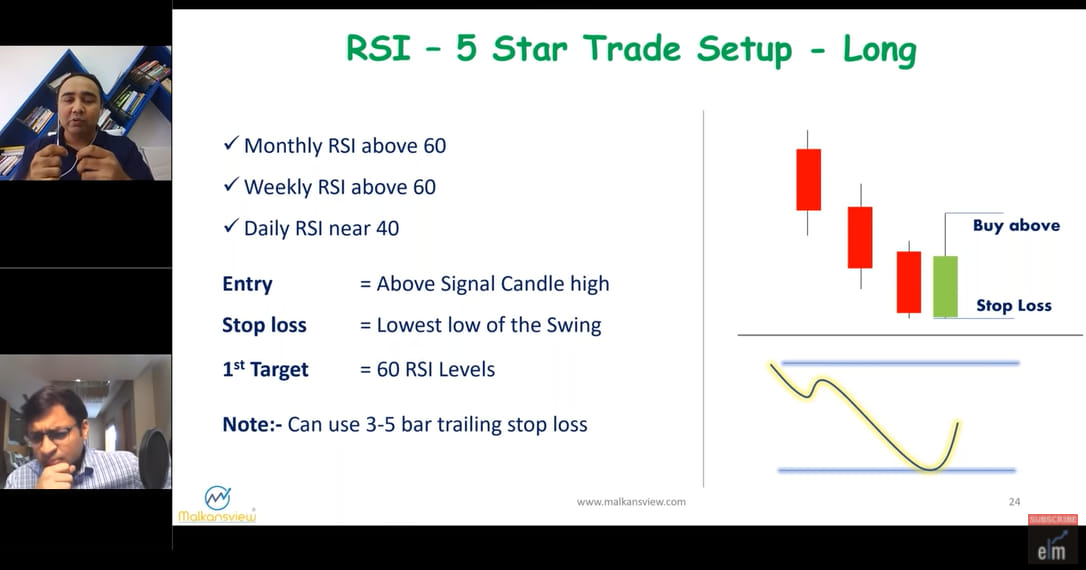
According to Mr Vishal Malkan when the Monthly and Weekly Relative Strength Index is above 60, but when the RSI indicator takes support at 40 (inflection point) in the daily chart, it may bounce back and most probably it will not go below 40.

If a bullish candle is formed at the 40 Relative Strength Index level, the prices may bounce back, and one can enter the stock.

The stoploss can be placed at the low of that bullish candlestick, and the target can be the 60 Relative Strength Index level.

A 5-Star Relative Strength Index (RSI) Strategy by Star Trader Vishal Malkan 6

Example-

A 5-Star Relative Strength Index (RSI) Strategy by Star Trader Vishal Malkan 7

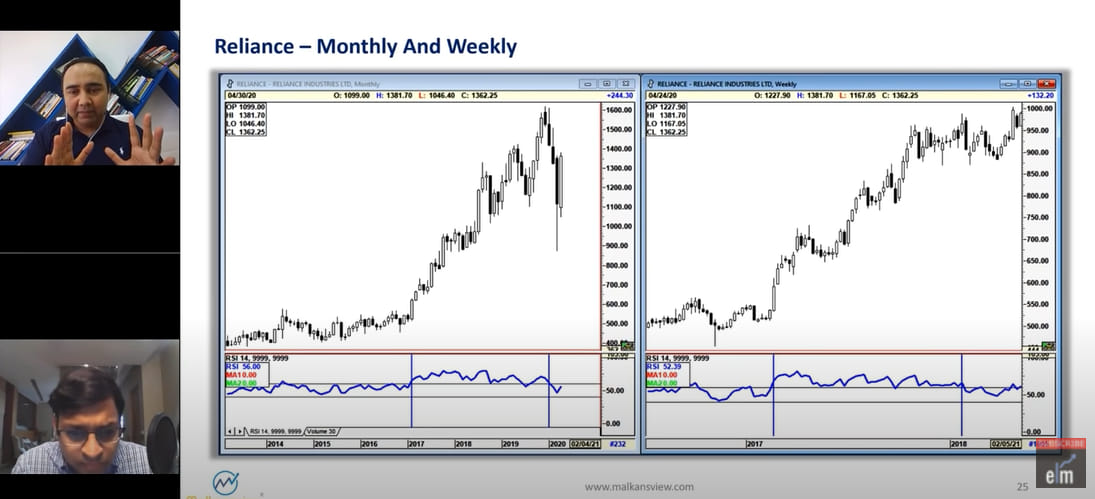
We have marked the areas in the above Weekly and Monthly chart of Reliance Ltd., and we will see only that period in the daily chart.

A 5-Star Relative Strength Index (RSI) Strategy by Star Trader Vishal Malkan 8

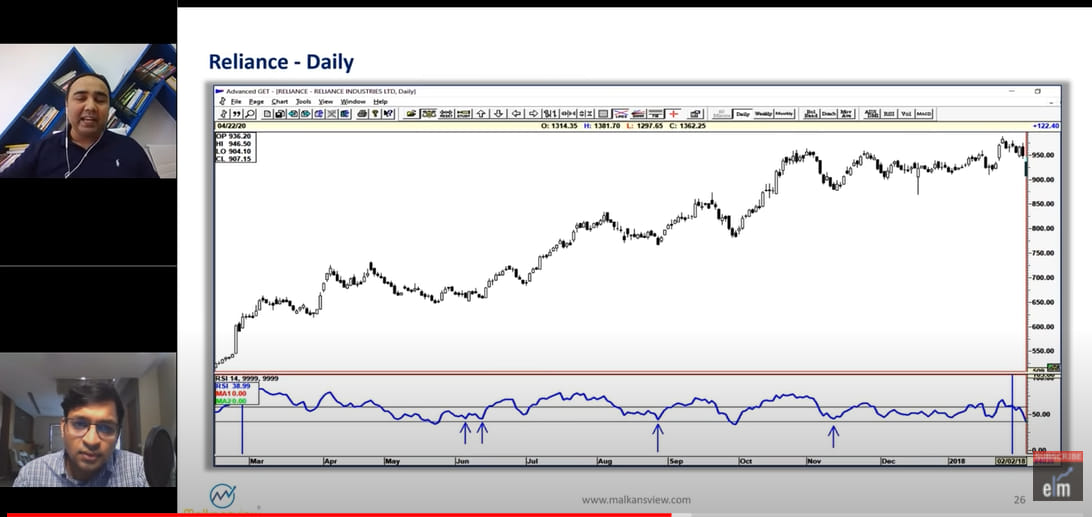
So, in that daily chart, we can see that we got many buying opportunities during that period that we had marked in the monthly and weekly charts as shown by the arrows.

The 5-Star Relative Strength Index (RSI) Strategy-Short

A 5-Star Relative Strength Index (RSI) Strategy by Star Trader Vishal Malkan 9

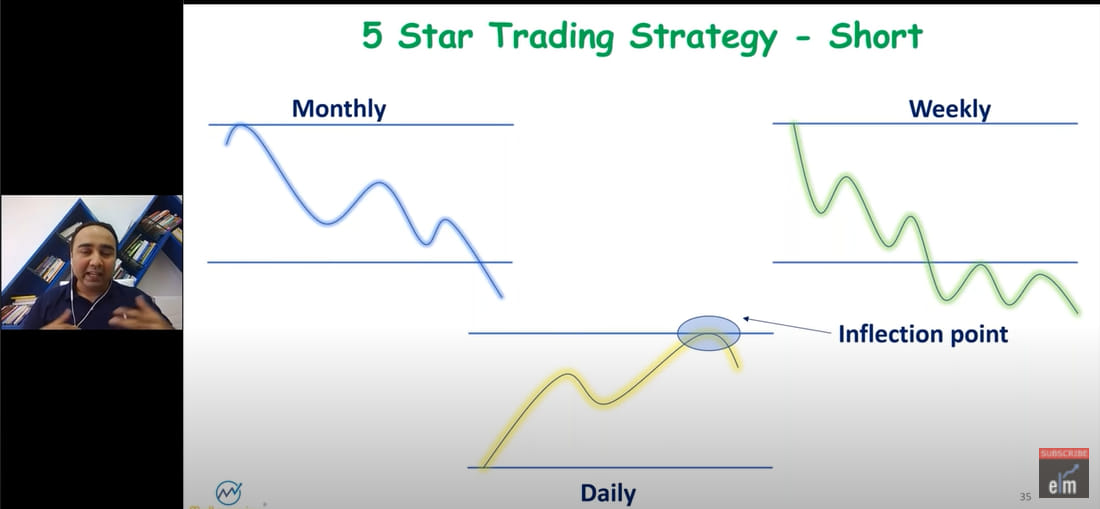
According to Mr Vishal Malkan when the Monthly and Weekly RSI is below 40, but when the Relative Strength Index indicator takes support at 60 (inflection point) in the daily chart, it may bounce back and doesn’t go above 40.

You can also watch the webinar on Relative Strength Index / Bollinger Bands – The Deadly Duo

A 5-Star Relative Strength Index (RSI) Strategy by Star Trader Vishal Malkan 10

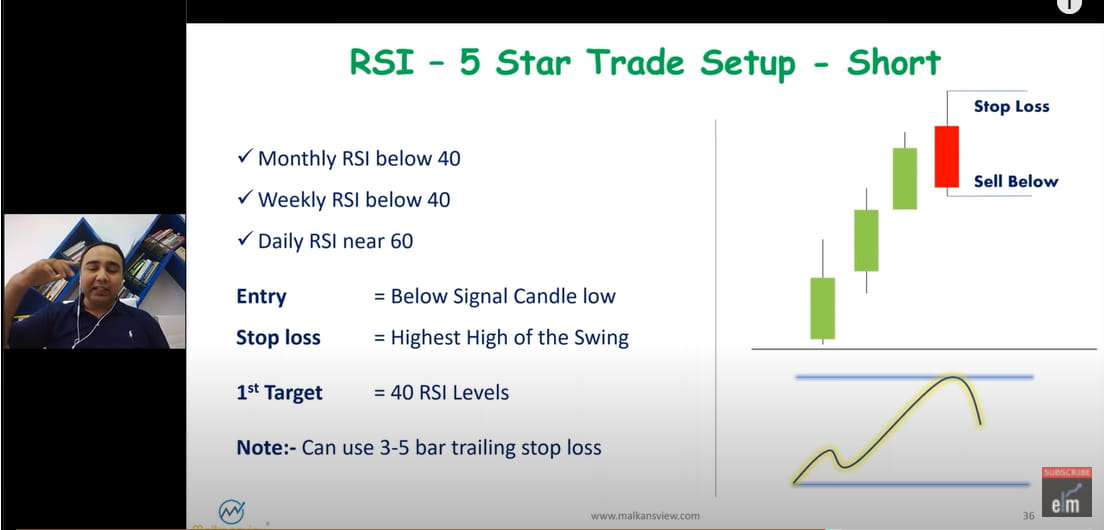
If a bearish candle is formed at the 60 RSI level, the prices may bounce back from there, and one can enter the stock for shorting.

The stoploss can be placed at the high of that bearish candlestick, and the target can be the 40 Relative Strength Index levels.

You can also do our course on RSI Made Easy

Bottomline

We hope you found this blog informative and use it to its maximum potential in the practical world. Also, show some love by sharing this blog with your family and friends and helping us in our mission of spreading financial literacy.

Happy Investing!

You can also visit web.stockedge.com, a unique platform that is 100% focused on research and analytics.

Tags: basicenglishRSI Indicatortechnical analysis
ShareTweetSend
Get Kotak Offer Get Kotak Offer Get Kotak Offer
Previous Post

6 Pullback Trading Strategies for Profitable Trading 

Next Post

5 Trading Strategies using MACD Technical Indicator

Elearnmarkets

Elearnmarkets

Elearnmarkets (ELM) is a complete financial market portal where the market experts have taken the onus to spread financial education. ELM constantly experiments with new education methodologies and technologies to make financial education effective, affordable and accessible to all. You can connect with us on Twitter @elearnmarkets.

Related Posts

5 Powerful Bearish Candlestick Patterns 14
Technical Analysis

5 Powerful Bearish Candlestick Patterns

November 30, 2023
97.8k
5 Powerful Bullish Candlestick Patterns 15
Technical Analysis

5 Powerful Bullish Candlestick Patterns

November 30, 2023
134.9k
All 35 Candlestick Chart Patterns in the Stock Market-Explained 16
Charts, Patterns & Indicators

All 35 Candlestick Chart Patterns in the Stock Market-Explained

November 27, 2023
2.1M
Super Successful Techno Funda Stock Market Strategy 17
Fundamental Analysis

Super Successful Techno Funda Stock Market Strategy

November 28, 2023
1.4k

Leave a Reply Cancel reply

Your email address will not be published. Required fields are marked *

Elearnmarkets Logo

Follow Us

Facebook-f Twitter Instagram Linkedin-in Youtube Telegram

Register on Elearnmarkets

Continue your financial learning by creating your own account on Elearnmarkets.com

Register Free Account

Download App

Playstore logo
Download on app store

Categories

  • Basic Finance
  • Derivatives
  • Financial Planning
  • Fundamental Analysis
  • Technical Analysis
  • Marketshala
  • Miscellaneous

Popular On Elearnmarkets

  • Market Superheroes:
  • Vivek Bajaj
  • Chetan Panchamia
  • Ashish Kyal
  • Premal Parekh
  • Abhijit Paul
  • Jegan
  • Sivakumar Jayachadran
  • Vishal Malkan
  • Jyoti Budhia
  • Vivek Gadodia
  • Vishal Mehta
  • Piyush Chaudhry
  • Santosh Pasi
  • Gomathi Shankar
  • Market Superheroes:
  • Vivek Bajaj
  • Chetan Panchamia
  • Ashish Kyal
  • Premal Parekh
  • Abhijit Paul
  • Jegan
  • Sivakumar Jayachadran
  • Vishal Malkan
  • Jyoti Budhia
  • Vivek Gadodia
  • Vishal Mehta
  • Piyush Chaudhry
  • Santosh Pasi
  • Gomathi Shankar
  • Courses:​
  • Options Trading
  • Dow Theory
  • Momentum Trading
  • Stock Investing
  • Stock Market for Beginners
  • Harmonic Chart Patterns
  • Algo Trading
  • Elliot Wave Theory
  • Advanced Excel
  • Cryptocurrency
  • NSE Certification Course
  • Courses:​
  • Options Trading
  • Dow Theory
  • Momentum Trading
  • Stock Investing
  • Stock Market for Beginners
  • Harmonic Chart Patterns
  • Algo Trading
  • Elliot Wave Theory
  • Advanced Excel
  • Cryptocurrency
  • NSE Certification Course
  • Webinars:
  • Bank Nifty Scalping
  • Intraday Trading Strategies
  • Options Trading Strategies
  • Options selling
  • Price Action
  • Relative Strength
  • Tax Planning
  • Options Buying
  • Growth Stocks
  • Portfolio Management
  • Relative Strength Index
  • Risk Management
  • Renko Charts
  • Crude Oil
  • Traders Psychology
  • Moving Average
  • Multibagger Stocks
  • Free Learning Modules:
  • Intraday Trading
  • Options Scalping
  • Swing Trading
  • Financial Modelling
  • RSI Indicator
  • Bollinger Bands
  • Pricing of Futures
  • Personal Finance
  • Initial Public Offerings (IPO)
  • Value Investing
  • Technical Indicators
  • Candlesticks
  • Chart Patterns
  • Option Greeks
  • ELSS Funds
  • Banking and Insurance
  • Real Estate
  • Gold
  • Book Summaries:
  • Rich Dad Poor Dad
  • Psychology of Money
  • The Intelligent Investor
  • The Richest Man in Babylon
  • Think and Trade Like a Champion
  • Value Investing and Behavioural Finance
  • Trading in the Zone
  • Learn to Earn
  • Book Summaries:
  • Rich Dad Poor Dad
  • Psychology of Money
  • The Intelligent Investor
  • The Richest Man in Babylon
  • Think and Trade Like a Champion
  • Value Investing and Behavioural Finance
  • Trading in the Zone
  • Learn to Earn
  • Tools:
  • CAGR Calculator
  • SIP Calculator
  • eLearnOptions
  • Future Value Calculator
  • Present Value Calculator
  • Atal Pension Yojana
  • Cost of Delay Calculator
  • Become a Crorepati
  • Tools:
  • CAGR Calculator
  • SIP Calculator
  • eLearnOptions
  • Future Value Calculator
  • Present Value Calculator
  • Atal Pension Yojana
  • Cost of Delay Calculator
  • Become a Crorepati

© 2023 Elearnmarkets. All Rights Reserved

  • Visit Elearnmarkets
  • Courses
  • Webinars
  • Financial Guides
  • Get Free Counselling
  • Visit Elearnmarkets
  • Courses
  • Webinars
  • Financial Guides
  • Get Free Counselling

Get Elearnmarkets App

No Result
View All Result
  • Article Categories
    • Basic Finance
    • Derivatives
    • Financial Planning
    • Fundamental Analysis
    • Technical Analysis
    • Marketshala
    • Miscellaneous
  • Language
    • Hindi
    • Bengali
    • English
  • Courses
  • Webinars
  • Stories

© 2020 Elearnmarkets All Rights Reserved

A Handbook of Technical Analysis
To start your trading journey as a seasoned technical analyst
Download Now