
The Relative Strength Index (RSI) is the most popular technical indicator among traders worldwide. It was created in the 1970s by Wells Wilder. In his 1978 book New Concepts in Technical Trading Systems, Mr Wilder advised that the indicator’s default setting be 14 days (half-moon cycle).
The RSI is commonly used to determine overbought and oversold levels. Divergence, Reversal, and Failure Swing are other terms associated with using RSI.
However, Andrew Cardwell, commonly known as Dr RSI, discovered the Range Shift idea. Furthermore, he found that the RSI indicator may be applied to trending and non-trending markets.
So, in today’s blog, we will discuss a simple yet effective trading strategy using the RSI range shift concept:
What is the Relative Strength Index?
The relative strength index (RSI) is a technical analysis indicator that examines the size of recent price fluctuations to determine if a stock or other asset is overbought or oversold.
The RSI is represented by an oscillator (a line graph that travels between two extremes) with a range of 0 to 100. J. Welles Wilder Jr. created the indicator and published it in his important 1978 book “New Concepts in Technical Trading Systems.”
According to traditional interpretation and usage, values of 70 or higher on the RSI suggest that investment is becoming overbought or expensive and may be ready for a trend reversal or corrective retreat in price. Conversely, an RSI of 30 or less suggests that the market is oversold or undervalued.
What is the RSI Range Shift concept?
RSI Range Shift is a phenomenon that occurs when the RSI indicator ‘shifts’ from one specified range to another in response to changes in the price movement of an underlying asset. There are five different types of RSI ranges.
- Super Bullish Range-60-80
- Bullish Range-40-80
- Bearish Range-20-60
- Super Bearish Range-20-40
- Sideways Range-40-60
Trading Examples
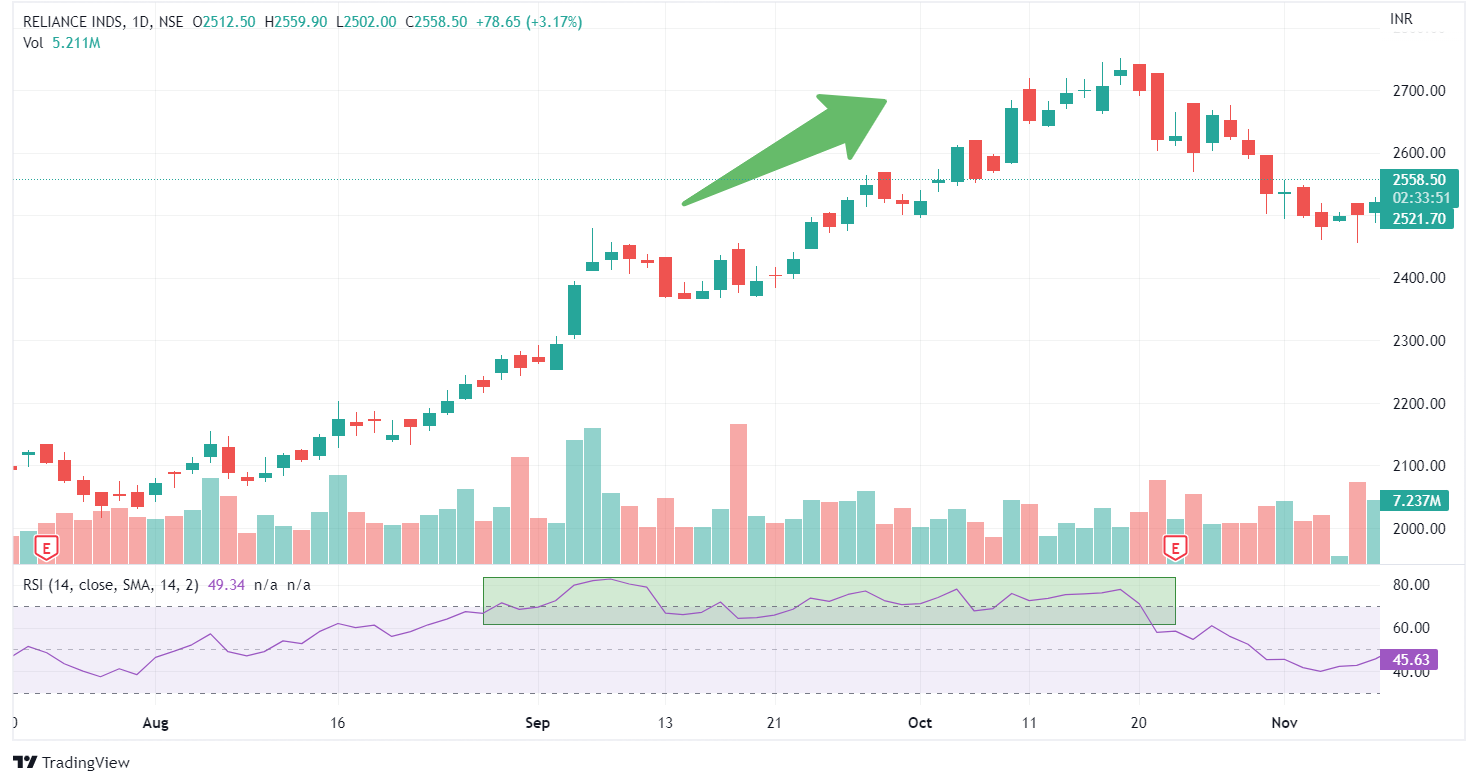
1. Super Bullish Range
In this situation, the RSI refuses to fall below 60 and seeks support near 60. RSI tends to swing between 60 and 80 during this highly bullish era. Consider the following Reliance example.
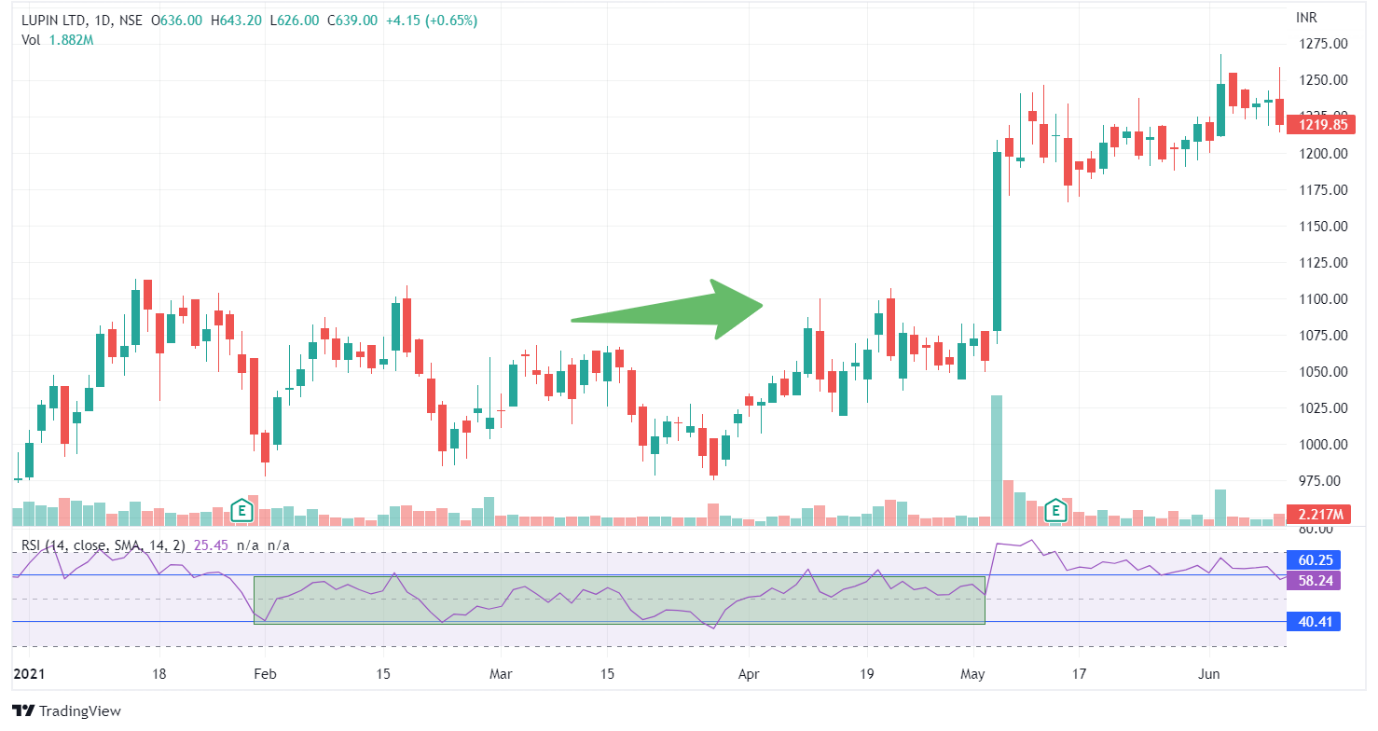
2. Bullish Range
When a stock is rising, the RSI will not fall below 40. Instead, it looks for help around the level of 40. For example, see the Lupin chart below, where the RSI refused to move below 40 and fluctuated between 40 and 80.
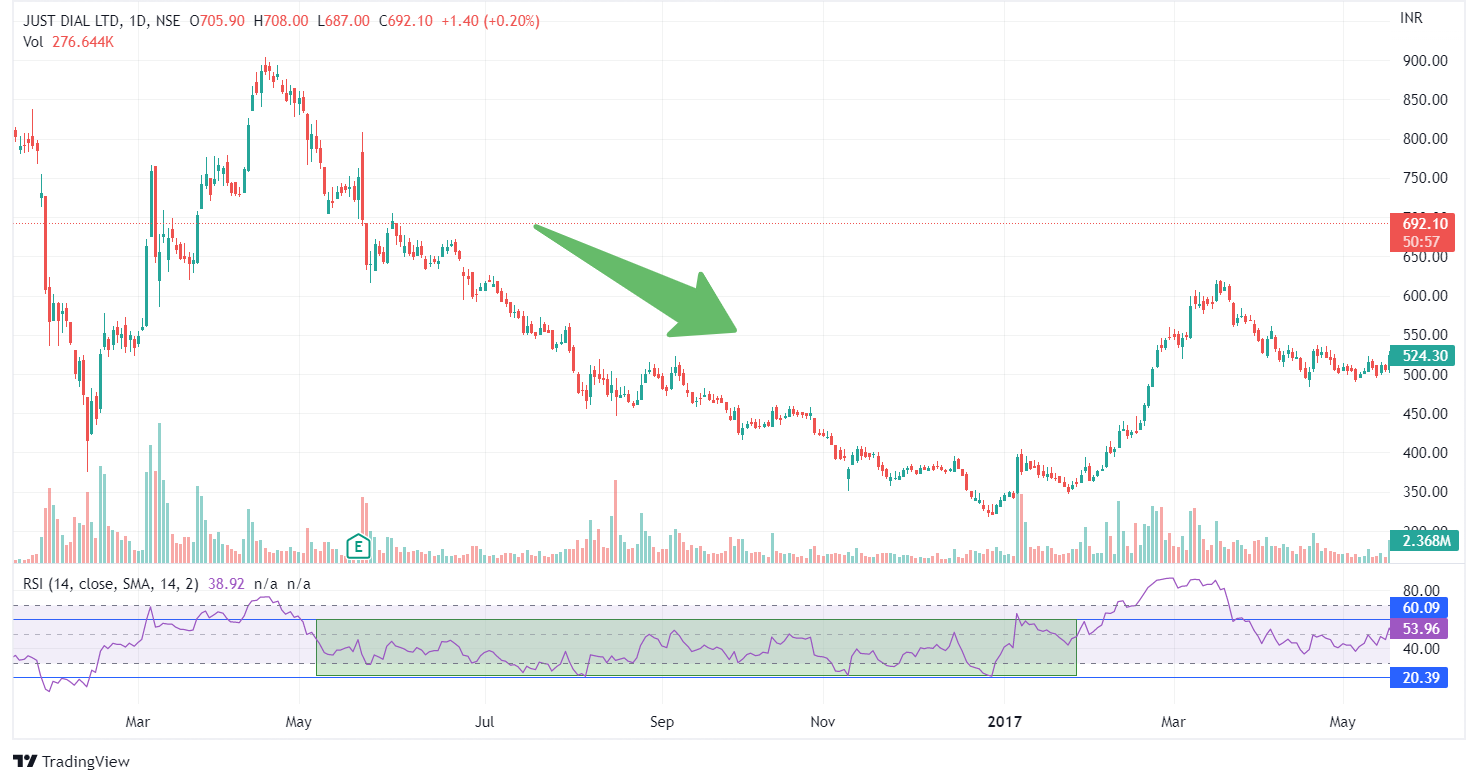
3. Bearish Range
When a stock is downtrend, the RSI typically encounters resistance around 60 rather than reaching the overbought level of 70. The notion is well depicted in the Just Dial graphic below. Look at how the RSI met resistance at 60 levels-
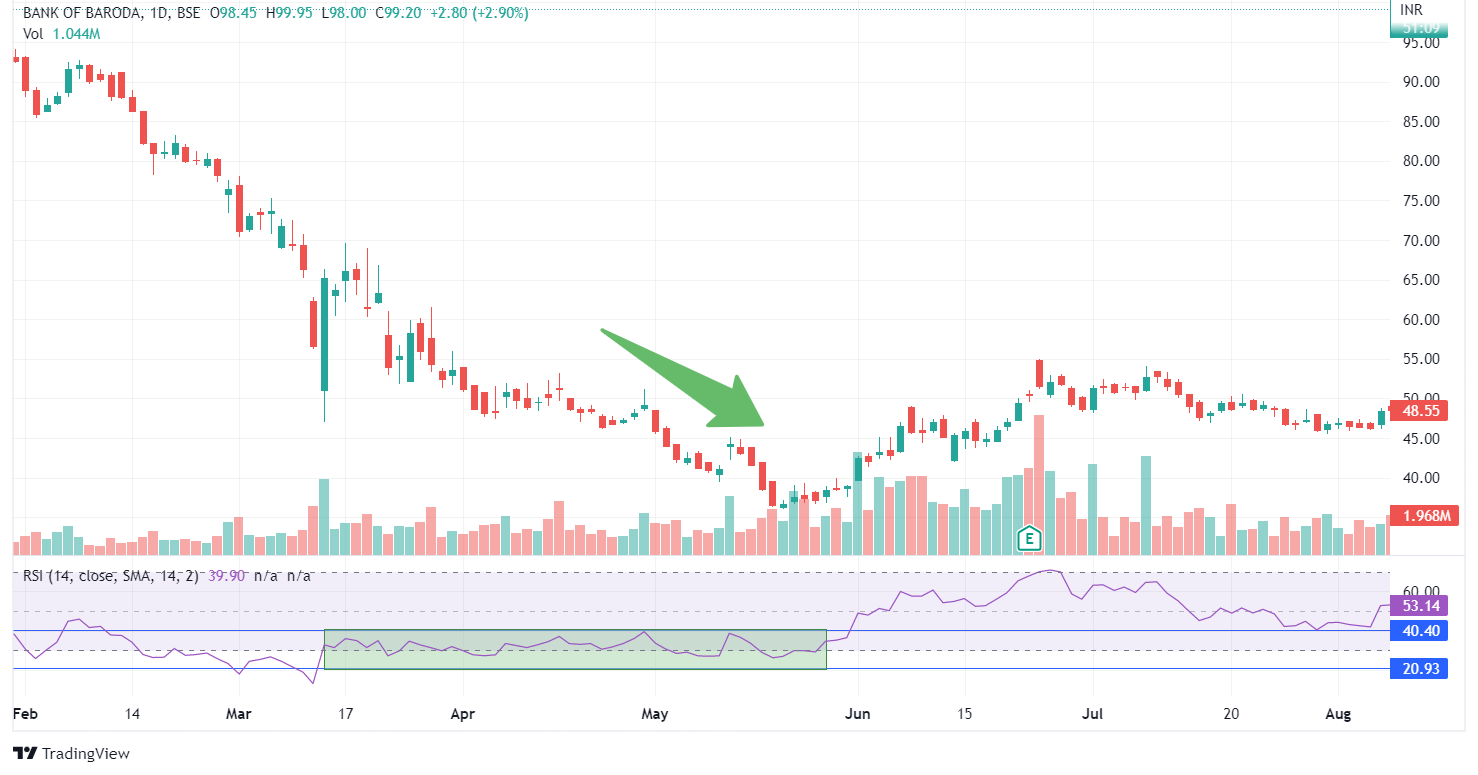
4. Super Bearish Range
The RSI struggles to cross 40 levels when a stock has a significant downtrend. It is resisted around 40, indicating that even at 40 RSI, the stock is overbought. Notice how the RSI struggled to cross the 40 levels during Bank of Baroda’s severe bearish phase in the chart below.
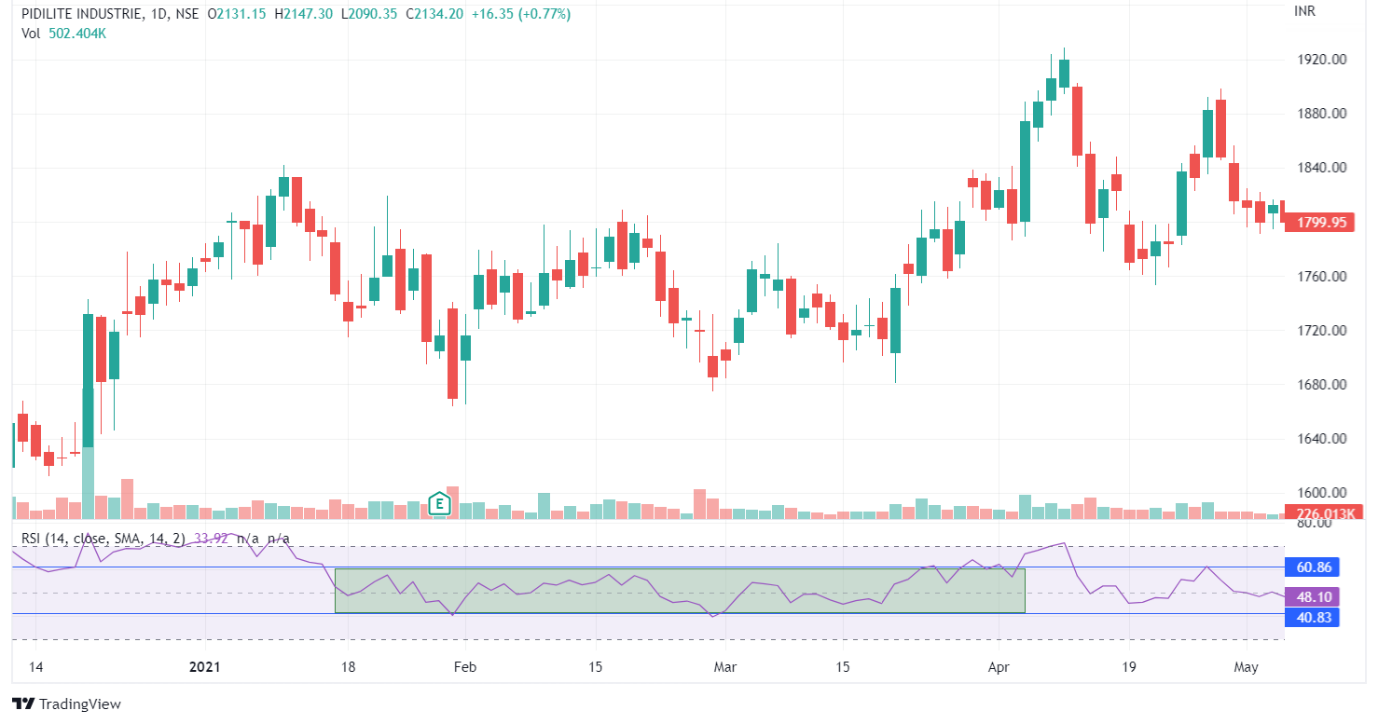
5. Sideways Range
RSI tends to swing between 40 and 60 when there is no trend in the underlying asset. It usually finds support around 40 but resistance around 60. In the case of Pidilite, the RSI generally oscillated between 40-60 during the sideways period.

You can also do our course on RSI MADE EASY
This is all about the RSI range shift concept. You can watch more webinars on RSI below:
Webinars on RSI
1. How To Use RSI for Short-Term Trading
A fairly successful trader can judge trend, momentum, and key pivot levels to enter into a profitable trade. But, of course, he also must be able to pick stocks before making the trend his friend. Our RSI webinar will help you achieve all the goals above, trade, and even learn how to pick stocks from day to short-term to medium-term.
2. Strength Zones on RSI & Signals to trade at those zones
This webinar is all about understanding the beautiful relationship between price and momentum. This session will discuss the details of the RSI indicator and understand the importance of momentum in the world of trading.
3. A Professional’s way to use RSI
This webinar is all about one of the most important momentum indicators – RSI. In this webinar, we take a deeper dive into RSI and discuss different trading strategies using it. This webinar will also break all myths and understand the limitations of this powerful indicator while using it as an overbought and oversold indicator.
4. Ultimate Trading Signals using RSI
This webinar is all about using RSI in its simplest form to get good trending moves in stocks or Indices. Using RSI so that traders get a conviction on the trades, maximize their gains, and minimise losses to a great extent.
5. Identifying Mutlibaggers using RSI Range Rules
RSI is one of the most versatile and important indicators in the field of Technical analysis. In this webinar, we take a deeper dive into RSI and discuss strategies for using it. You will learn to combine RSI range rules and simple price patterns to pick out very high probability stocks which may give super normal returns. Range Rule was introduced by Mr Andrew Cardwell but often used incorrectly by traders. This webinar will focus on the correct use of the range rules and pull out multi-baggers.
Bottomline
We hope you found this blog informative and use it to its maximum potential in the practical world. Also, show some love by sharing this blog with your family and friends and helping us in our mission of spreading financial literacy.
Happy Investing!
You can also visit web.stockedge.com, a unique platform that is 100% focused on research and analytics.


