Nifty (Close approx. 9765.55): Nifty opened gap up on positive global cues but saw some profit booking in today’s session. It surged by mere 11.2 points in today’s trade after consecutive three days of selling.
Hourly Technical:
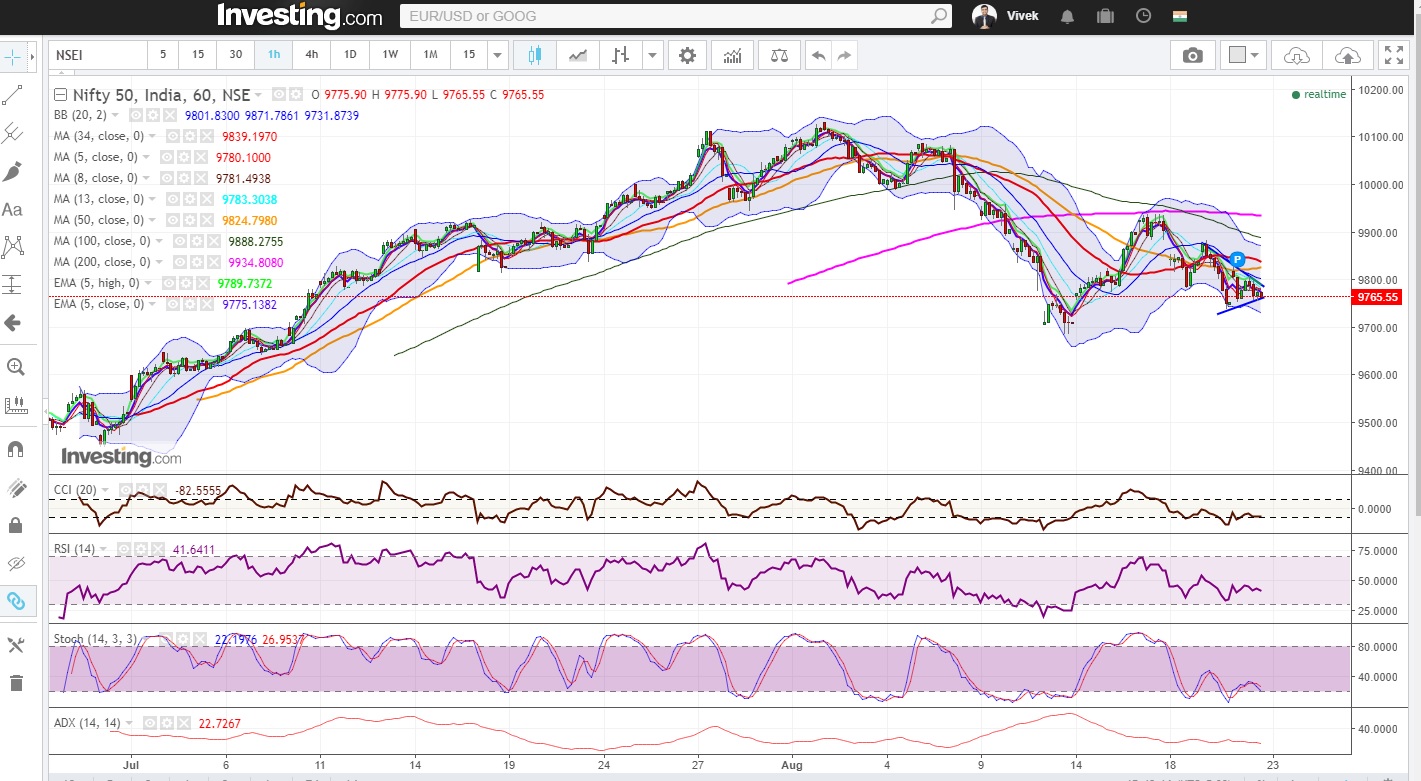
In spite of gap up opening, the market could not hold upper levels and went into a range bound trade. Presently Nifty is below all short-term moving averages which are a concern in the near term. There is a symmetrical pattern in the hourly chart and the closing either side will decide market’s direction but given the sentiment, it seems that market may break on the downside.
The probable support in the Hourly chart comes at 61.8% retracement level of the down move from approx. 10138 to approx. 9449 (presently at 9712). On the upside, the probable resistance could be at 20 hours moving average (presently at approx. 9802) and hourly upper Bollinger line (presently at approx.9871).
Hourly CCI and Stochastic are close to the lower bound and hourly RSI is in the neutral zone. The falling hourly ADX indicates fall in volatility. Overall Nifty remains bearish to neutral in the hourly time frame.
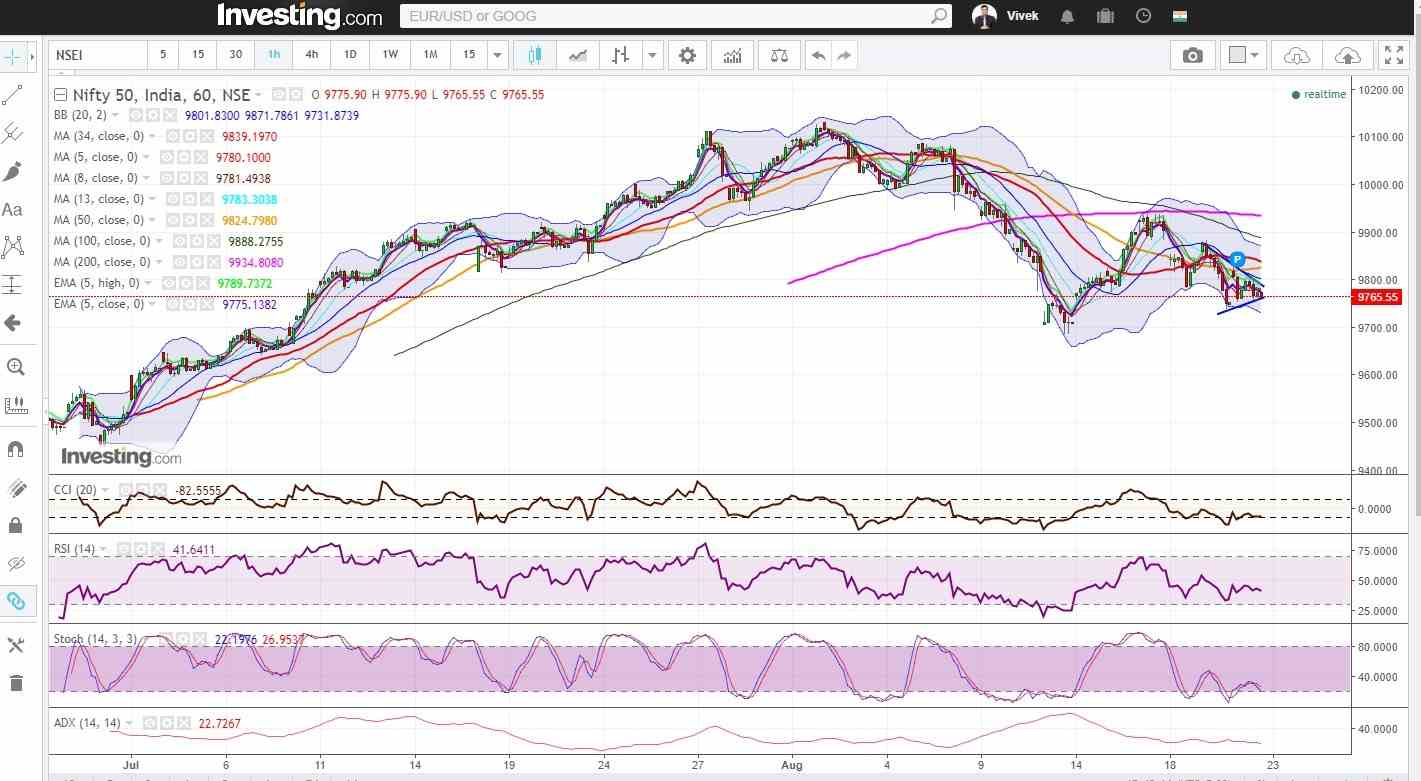
Hourly Chart
Daily Technical:
Nifty in the daily chart has closed below 50 DMA for the second consecutive session.
This is the second time Nifty has gone below 50 DMA ([presently at approx. 9795) after 11th August in the last six months.
Moreover, Nifty has closed below 5 day Low EMA which is a sign of weakness in the daily chart.
Want to learn technical analysis from scratch? Enroll in: NSE Academy Certified Technical Analysis course on Elearnmarkets.
Nifty has a strong support at around 9700, the break below which may take it to 100 DMA (presently at approx. 9583).
The next probable support in the daily chart remains at 100% projection (presently at approx. 9729), 123.6% projection (presently at approx. 9692), 161.8% projection (presently at approx. 9632) of the move respectively from approx. 9940 to approx. 9784 from the high of approx. 9884 and 100 DMA (presently at approx.9582).
On the upside, the probable resistance could be at 5 Day low EMA (presently at approx. 9776) and 5 Day moving average (presently at approx. 9832).
Daily CCI and Stochastic are in the oversold zone and RSI is in the neutral zone.
The ADX is also falling suggests fall in momentum. Overall Nifty remains bearish in the daily chart.
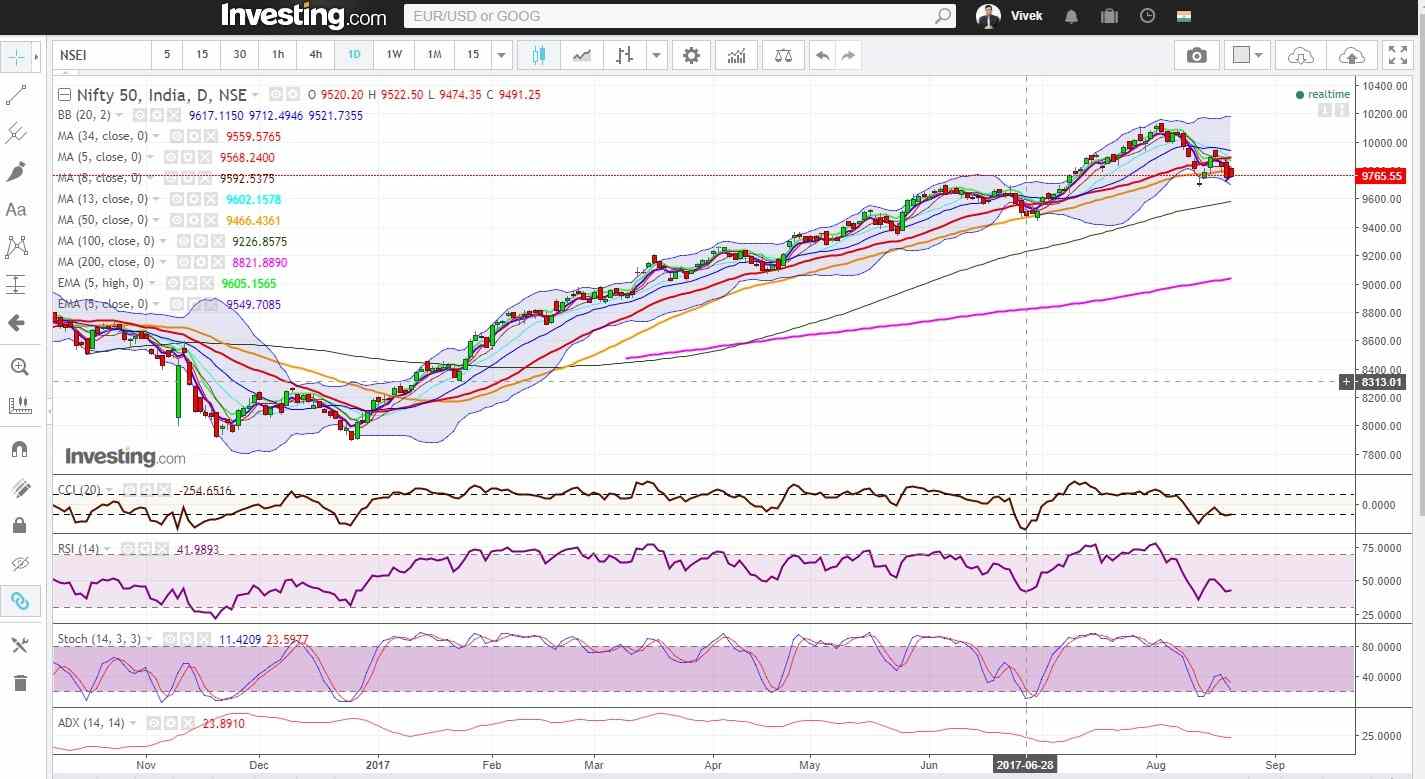
Daily chart
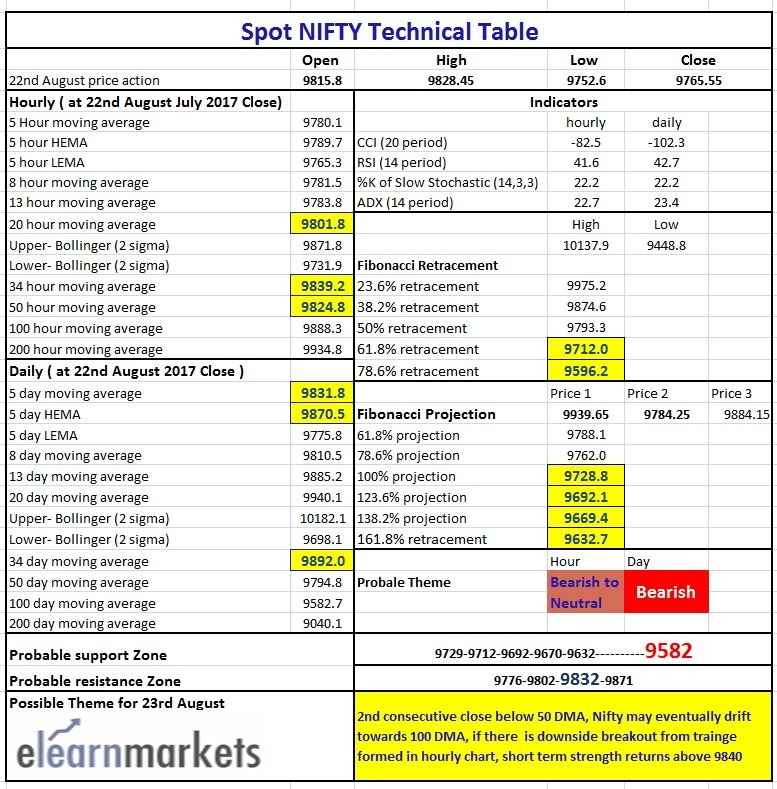
Tech Table
Watch the video below to know how to analyze the Tech table:


