Elearnmarkets - Financial Market Learning
  • Categories
    • Basic Finance
    • Derivatives
    • Financial Planning
    • Fundamental Analysis
    • Technical Analysis
    • Marketshala
    • Miscellaneous
  • Language
    • English
    • Hindi
    • Bengali
No Result
View All Result
  • Courses
  • Webinars
  • Learn On Elearnmarkets
Elearnmarkets - Learn Stock Market, trading, investing for Free
No Result
View All Result
Home Technical Analysis Market Analysis

Nifty made a Doji In the Weekly Chart, where will be the market heading?

Elearnmarkets by Elearnmarkets
March 17, 2022
in Market Analysis, Market Wrap
Reading Time: 3 mins read
2
99
VIEWS
Share on FacebookShare on TwitterShare on WhatsApp

Nifty close 10767.65: Nifty Ends in Green. Thursday’s gap up opening and a green candle helped Nifty to end in a positive note. Week started with red which drives nifty to touch its 100 MA line (which is at approx. 10552). Nifty takes a pull back from that points, this week’s RBI news and correction in oil price helped nifty to cover up its previous down move.

Hourly Technical

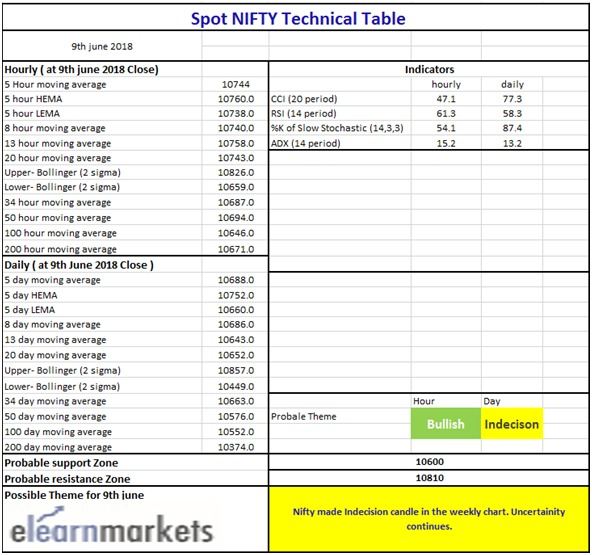
From the hourly chart it is visible that the Nifty is about to begin a new trend. Moving average lines are below the price and they will might as short term support for the price in case of a downfall.

Indicator RSI (Which is at approx. 61) suggesting the price is in a good support of momentum, slow stochastic also above level 50. In case of ADX it is at level 15 and trading flat, indicator CCI is just below 50.

Overall from the chart and from the indicator’s position, we can derive the up move may continue if Nifty breaks the 10800 level with good momentum. Only the upper Bollinger line (presently at 10826) could be a possible Resistance for the price.(Hourly Chart)

Daily Technical

Join TMP Join TMP Join TMP

In the daily chart, nifty presently trading at a Resistance level. This level has been tested by the index more than 4 times. Above this level Nifty is bullish. In the Thursday’s trading session nifty tried to give a breakout but it failed, and closed below 10800 level.

The good thing is moving average lines are below the price, they will support the index in case of a short dip. So there is less chance for Nifty to go down without any pause.

Let’s talk about the indicators. Momentum indicator RSI is below 60, Strength indicator ADX is trading flat, slow stochastic %k has already crossed it 70 marks and entered into the overbought level and CCI is turning back from 90 level.

Overall the indicator reaction is not positive as well as not negative. If Nifty breaks this 10800 zone, further up move may be possible.

(Daily chart)

Weekly Technical

In the weekly chart Nifty has made a Doji candle. Which shows indecision in the market.

This is the 3rd time Nifty making big spikes in the weekly chart, one positive thing to note that the price is above all moving averages line and the spike in the weekly chart also shows that buyers are still present in the market to push the market higher.

Let’s discuss the indicators,

RSI is just below 60, slow stochastic has entered into its overbought level, CCI is below 70 and the indicator ADX is at level 15.

Overall there is no significant movement visible from the indicators but from the candlestick, we can decipher that the indecision is taking the lead.

We have seen MA 34 line has been a good support for the index so until the index holds this level and stay above 10500 there will be always a good chance for the up move.

(Weekly chart)
You can use stockedge app to get cutting edge over others in both short term trading and investing. Here you not only get data at one particular place but can also create your own combination scans based on your own technical and fundamental parameter. See the video below to know about various features in Stockedge app.

Technical Table

Tags: english
ShareTweetSend
Previous Post

Nifty ends in red due to May expiry and Italian crisis

Next Post

What To Do When Your Child’s Special Education Plan Isn’t Being Followed

Elearnmarkets

Elearnmarkets

Elearnmarkets (ELM) is a complete financial market portal where the market experts have taken the onus to spread financial education. ELM constantly experiments with new education methodologies and technologies to make financial education effective, affordable and accessible to all. You can connect with us on Twitter @elearnmarkets.

Related Posts

Hourly Chart
Market Analysis

Nifty Ends on Positive Note, Gains Approx. 475 Points on Positive Global Factors

November 18, 2020
378
Weekly Chart
Market Analysis

Huge Sell-Off Makes the Market Close in a Negative Note on the Expiry Week

November 18, 2020
175
Hourly Chart
Market Analysis

Nifty Ends in Green. Rupee Appreciates and Falling Crude Price Helped the Market to Recover Approx. 140 Point

November 18, 2020
129
Hourly Chart
Market Analysis

Sell Off Continues. Nifty Ends The Week With Three Consecutive Red Candles

November 18, 2020
141

Comments 2

  1. giraudosilvia says:
    5 years ago

    Thanks for the article post.Really thank you! Great.

    Reply
    • Tista Sengupta says:
      5 years ago

      Welcome

      Reply

Leave a Reply Cancel reply

Your email address will not be published. Required fields are marked *

Follow Us

Facebook-f Twitter Instagram Linkedin-in Youtube Telegram

Register on Elearnmarkets

Continue your financial learning by creating your own account on Elearnmarkets.com

Register Free Account

Download App

Categories

  • Basic Finance
  • Derivatives
  • Financial Planning
  • Fundamental Analysis
  • Technical Analysis
  • Marketshala
  • Miscellaneous

Popular On Elearnmarkets

  • Market Superheroes:
  • Vivek Bajaj
  • Chetan Panchamia
  • Ashish Kyal
  • Premal Parekh
  • Abhijit Paul
  • Jegan
  • Sivakumar Jayachadran
  • Vishal Malkan
  • Jyoti Budhia
  • Vivek Gadodia
  • Vishal Mehta
  • Piyush Chaudhry
  • Santosh Pasi
  • Gomathi Shankar
  • Market Superheroes:
  • Vivek Bajaj
  • Chetan Panchamia
  • Ashish Kyal
  • Premal Parekh
  • Abhijit Paul
  • Jegan
  • Sivakumar Jayachadran
  • Vishal Malkan
  • Jyoti Budhia
  • Vivek Gadodia
  • Vishal Mehta
  • Piyush Chaudhry
  • Santosh Pasi
  • Gomathi Shankar
  • Courses:​
  • Options Trading
  • Dow Theory
  • Momentum Trading
  • Stock Investing
  • Stock Market for Beginners
  • Harmonic Chart Patterns
  • Algo Trading
  • Elliot Wave Theory
  • Advanced Excel
  • Cryptocurrency
  • NSE Certification Course
  • Courses:​
  • Options Trading
  • Dow Theory
  • Momentum Trading
  • Stock Investing
  • Stock Market for Beginners
  • Harmonic Chart Patterns
  • Algo Trading
  • Elliot Wave Theory
  • Advanced Excel
  • Cryptocurrency
  • NSE Certification Course
  • Webinars:
  • Bank Nifty Scalping
  • Intraday Trading Strategies
  • Options Trading Strategies
  • Options selling
  • Price Action
  • Relative Strength
  • Tax Planning
  • Options Buying
  • Growth Stocks
  • Portfolio Management
  • Relative Strength Index
  • Risk Management
  • Renko Charts
  • Crude Oil
  • Traders Psychology
  • Moving Average
  • Multibagger Stocks
  • Free Learning Modules:
  • Intraday Trading
  • Options Scalping
  • Swing Trading
  • Financial Modelling
  • RSI Indicator
  • Bollinger Bands
  • Pricing of Futures
  • Personal Finance
  • Initial Public Offerings (IPO)
  • Value Investing
  • Technical Indicators
  • Candlesticks
  • Chart Patterns
  • Option Greeks
  • ELSS Funds
  • Banking and Insurance
  • Real Estate
  • Gold
  • Book Summaries:
  • Rich Dad Poor Dad
  • Psychology of Money
  • The Intelligent Investor
  • The Richest Man in Babylon
  • Think and Trade Like a Champion
  • Value Investing and Behavioural Finance
  • Trading in the Zone
  • Learn to Earn
  • Book Summaries:
  • Rich Dad Poor Dad
  • Psychology of Money
  • The Intelligent Investor
  • The Richest Man in Babylon
  • Think and Trade Like a Champion
  • Value Investing and Behavioural Finance
  • Trading in the Zone
  • Learn to Earn
  • Tools:
  • CAGR Calculator
  • SIP Calculator
  • eLearnOptions
  • Future Value Calculator
  • Present Value Calculator
  • Atal Pension Yojana
  • Cost of Delay Calculator
  • Become a Crorepati
  • Tools:
  • CAGR Calculator
  • SIP Calculator
  • eLearnOptions
  • Future Value Calculator
  • Present Value Calculator
  • Atal Pension Yojana
  • Cost of Delay Calculator
  • Become a Crorepati

© 2023 Elearnmarkets. All Rights Reserved

  • Visit Elearnmarkets
  • Courses
  • Webinars
  • Financial Guides
  • Get Free Counselling
  • Visit Elearnmarkets
  • Courses
  • Webinars
  • Financial Guides
  • Get Free Counselling

Get Elearnmarkets App

No Result
View All Result
  • Article Categories
    • Basic Finance
    • Derivatives
    • Financial Planning
    • Fundamental Analysis
    • Technical Analysis
    • Marketshala
    • Miscellaneous
  • Language
    • Hindi
    • Bengali
    • English
  • Courses
  • Webinars

© 2020 Elearnmarkets All Rights Reserved

Suggested Learning

Technical Analysis Made Easy

Certification in Online Technical Analysis

Online NSE Academy Certified Capital Market Professional (E-NCCMP)