Elearnmarkets - Financial Market Learning
  • Categories
    • Basic Finance
    • Derivatives
    • Financial Planning
    • Fundamental Analysis
    • Technical Analysis
    • Marketshala
    • Miscellaneous
  • Language
    • English
    • Hindi
    • Bengali
No Result
View All Result
  • Courses
  • Webinars
  • Learn On Elearnmarkets
Elearnmarkets - Learn Stock Market, trading, investing for Free
No Result
View All Result
Home Technical Analysis Market Analysis
23rd April Nifty Hourly Chart

Nifty Likely To Stay Range-Bound Prior To Karnataka Election

Elearnmarkets by Elearnmarkets
November 18, 2020
in Market Analysis, Market Wrap
Reading Time: 2 mins read
0
64
VIEWS
Share on FacebookShare on TwitterShare on WhatsApp

Nifty close 10564.1: Nifty took sharp recovery on Monday’s session from 50 Day SMA but stuck in a narrow range in the last four trading session. The index has been struggling to cross over 10600 level and is expected to trade in a range of 10300-10600 before any fresh move.
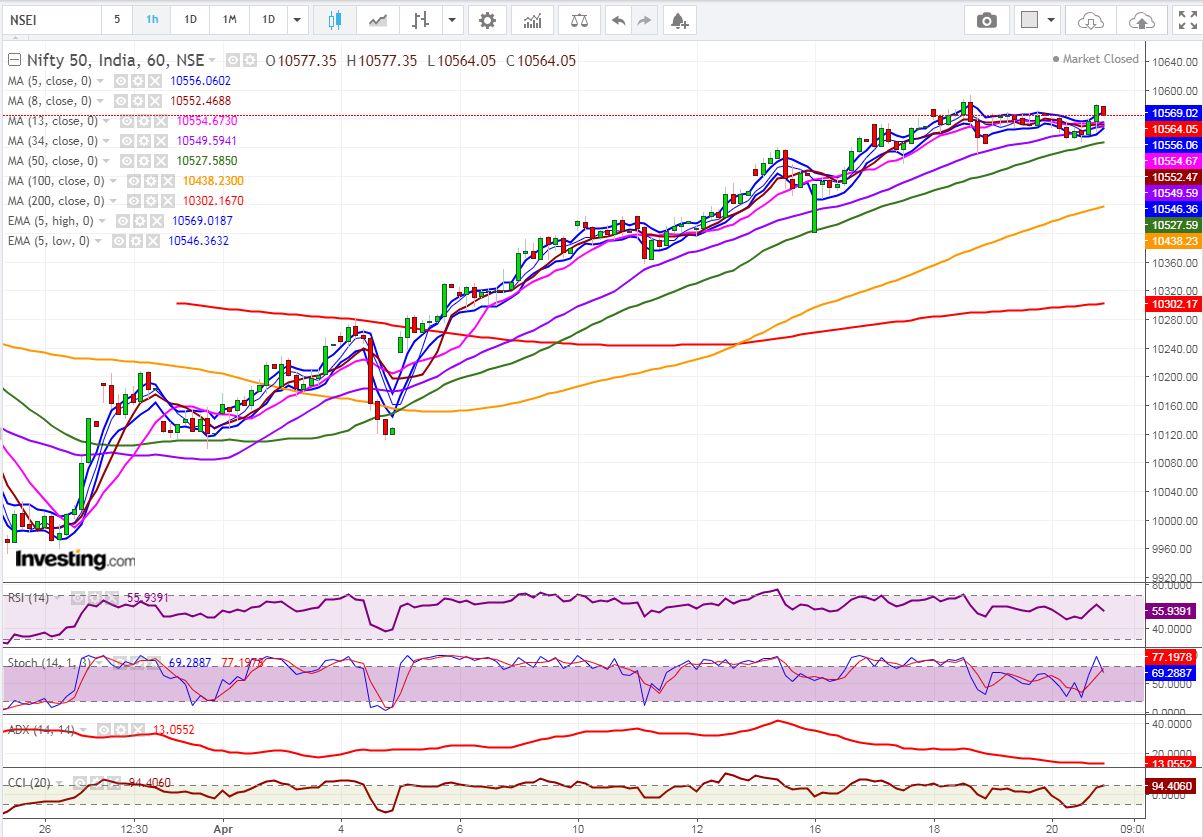
Hourly Technical

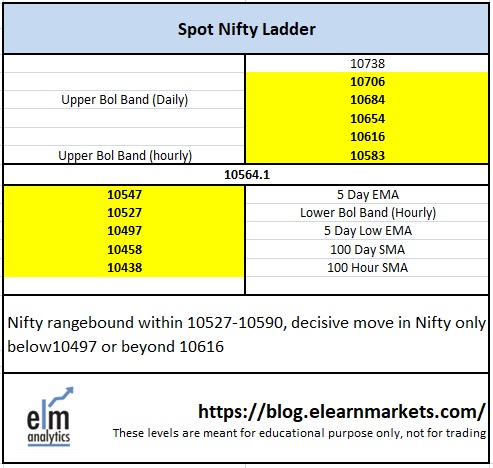
In the hourly chart, Nifty is trading above most short term moving averages. The probable support in the hourly chart comes at lower Bollinger line(presently at approx. 10527) and 100 Hour moving average (presently at approx. 10438).
On the upside, Nifty may face resistance at Upper Bollinger line (presently at approx. 10583).Hourly RSI, Stochastic and CCI are trading close to the upper bound of their respective range suggesting strength in the hourly time frame. Overall, Nifty appears strong in the Hourly chart.
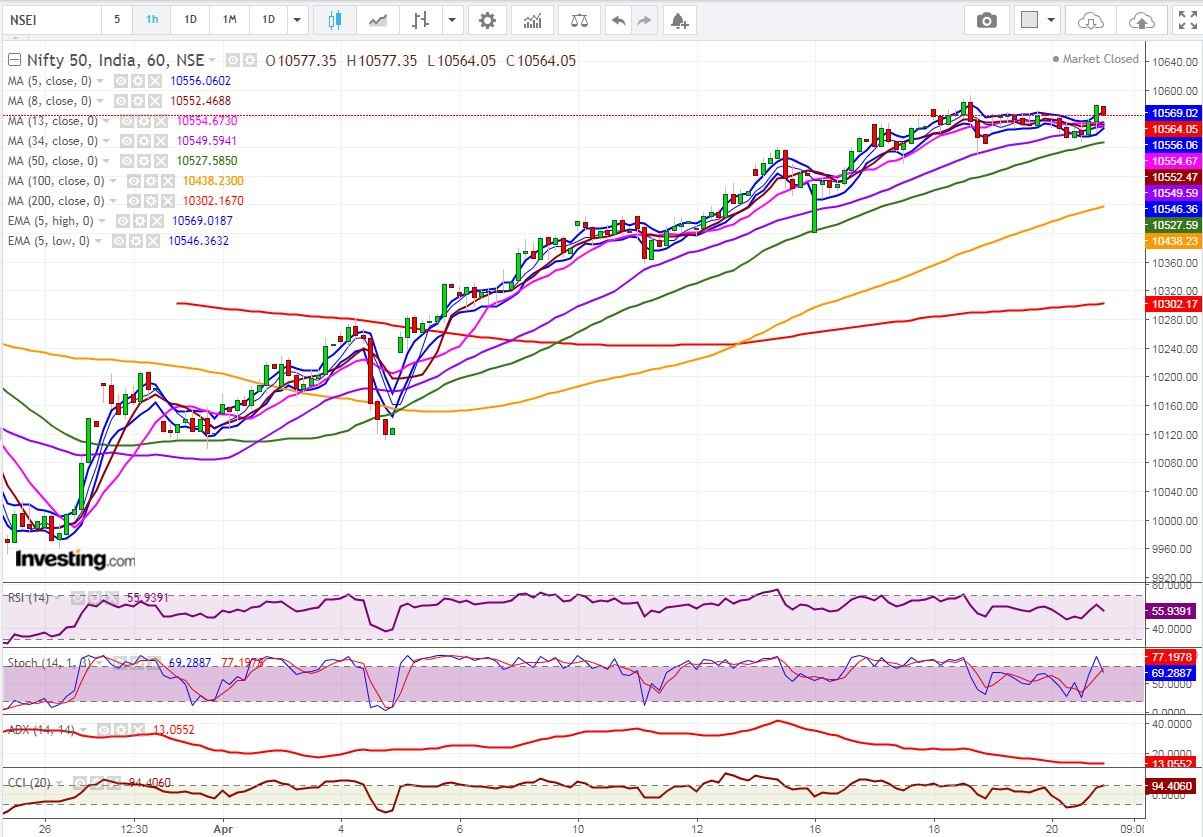
23rd April Nifty Hourly Chart

Hourly chart

Daily Technical
In the daily chart, Nifty is trading above 5 week High EMA and also above most moving average suggesting upside momentum. However narrow range bound trade in last 4 trading sessions and presence of doji on last trading session suggests that 10600 to be a strong resistance in the coming days.

The probable support in the daily chart comes at 5 Day high EMA (presently at approx.10547) and 5 Day Low EMA (presently at approx.10497).

On the upside, Nifty may face resistance at Upper Bollinger line (presently at approx.10684). Daily Stochastic and CCI are trading above the upper bound of their respective level and  RSI is in the normal zone but very close to the upper reference line. Overall, Nifty remained neutral to bullish in the daily chart.
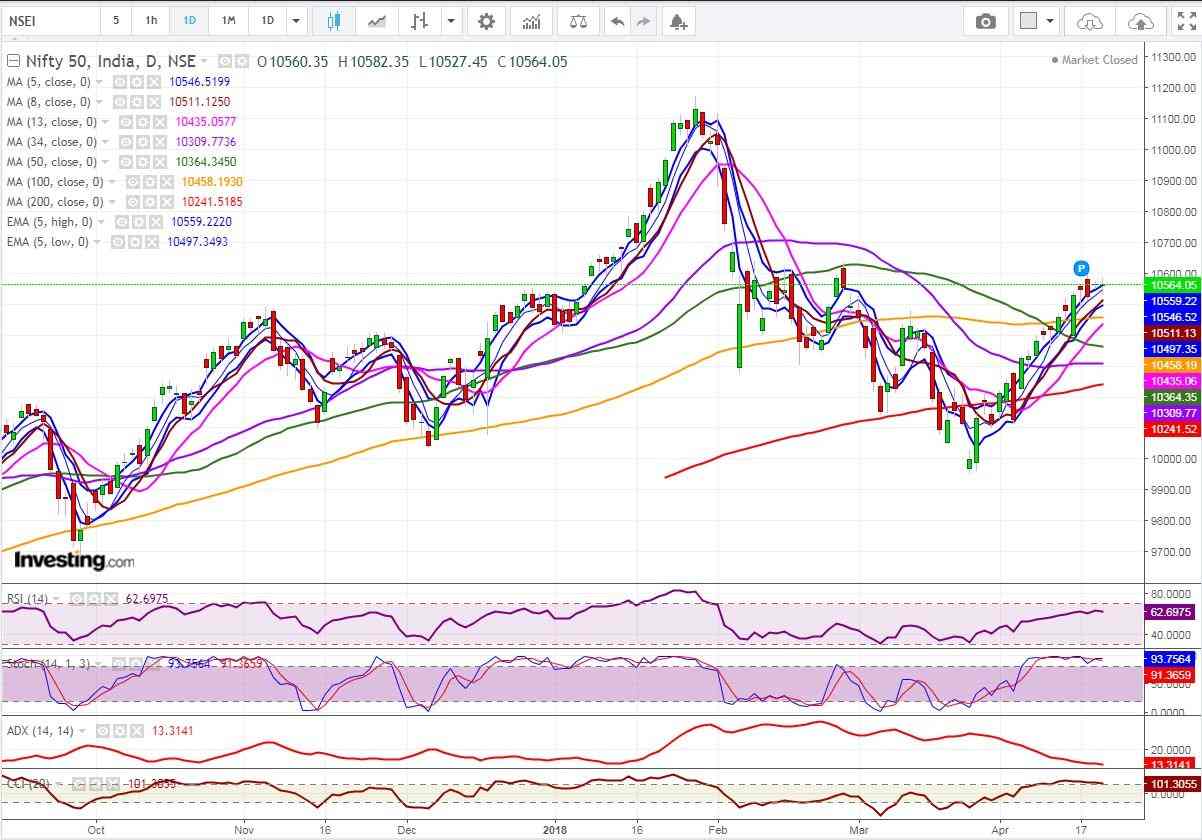
23rd April Nifty Daily Chart
Daily Chart

Weekly Technical
Nifty has given a positive close for the fourth consecutive week and presently standing at a very crucial level of 10600. The Karnataka election which is going to take place after 3 weeks will play a key role in deciding the direction of Nifty going forward but as of now, the Index is expected to remain range bound in the short term.
The close above 10600 can be seen as a gap filling opportunity for Nifty and can possibly take index to higher levels. Weekly CCI, RSI and Stochastic are in the normal zone. Overall, Nifty remained neutral in the weekly chart.
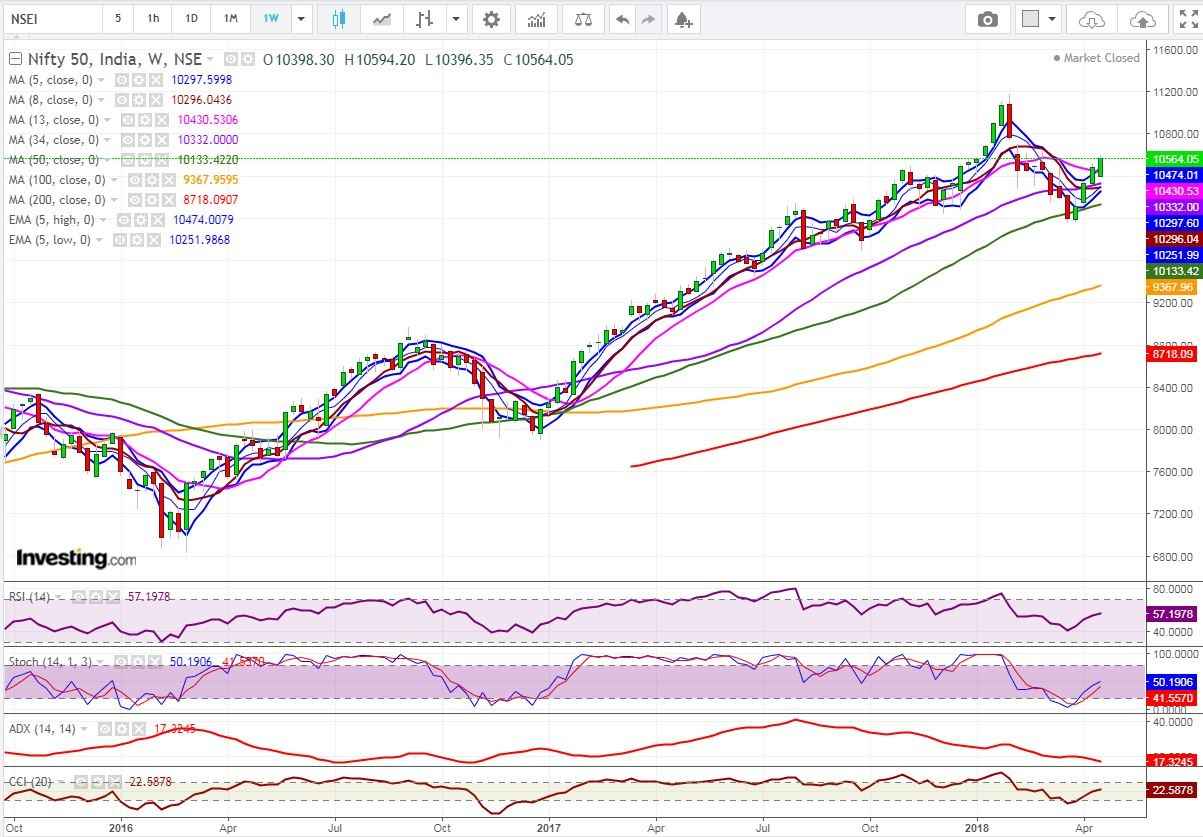
23rd April Nifty Weekly Chart
Weekly Chart

Nifty Matrix 23 April

Nifty ELM Matrix

Tags: english
ShareTweetSend
Previous Post

What should be your Mutual Fund Investment strategy for 2018-19

Next Post

Portfolio diversification – do’s and don’ts

Elearnmarkets

Elearnmarkets

Elearnmarkets (ELM) is a complete financial market portal where the market experts have taken the onus to spread financial education. ELM constantly experiments with new education methodologies and technologies to make financial education effective, affordable and accessible to all. You can connect with us on Twitter @elearnmarkets.

Related Posts

Hourly Chart
Market Analysis

Nifty Ends on Positive Note, Gains Approx. 475 Points on Positive Global Factors

November 18, 2020
378
Weekly Chart
Market Analysis

Huge Sell-Off Makes the Market Close in a Negative Note on the Expiry Week

November 18, 2020
175
Hourly Chart
Market Analysis

Nifty Ends in Green. Rupee Appreciates and Falling Crude Price Helped the Market to Recover Approx. 140 Point

November 18, 2020
129
Hourly Chart
Market Analysis

Sell Off Continues. Nifty Ends The Week With Three Consecutive Red Candles

November 18, 2020
141

Leave a Reply Cancel reply

Your email address will not be published. Required fields are marked *

Follow Us

Facebook-f Twitter Instagram Linkedin-in Youtube Telegram

Register on Elearnmarkets

Continue your financial learning by creating your own account on Elearnmarkets.com

Register Free Account

Download App

Categories

  • Basic Finance
  • Derivatives
  • Financial Planning
  • Fundamental Analysis
  • Technical Analysis
  • Marketshala
  • Miscellaneous

Popular On Elearnmarkets

  • Market Superheroes:
  • Vivek Bajaj
  • Chetan Panchamia
  • Ashish Kyal
  • Premal Parekh
  • Abhijit Paul
  • Jegan
  • Sivakumar Jayachadran
  • Vishal Malkan
  • Jyoti Budhia
  • Vivek Gadodia
  • Vishal Mehta
  • Piyush Chaudhry
  • Santosh Pasi
  • Gomathi Shankar
  • Market Superheroes:
  • Vivek Bajaj
  • Chetan Panchamia
  • Ashish Kyal
  • Premal Parekh
  • Abhijit Paul
  • Jegan
  • Sivakumar Jayachadran
  • Vishal Malkan
  • Jyoti Budhia
  • Vivek Gadodia
  • Vishal Mehta
  • Piyush Chaudhry
  • Santosh Pasi
  • Gomathi Shankar
  • Courses:​
  • Options Trading
  • Dow Theory
  • Momentum Trading
  • Stock Investing
  • Stock Market for Beginners
  • Harmonic Chart Patterns
  • Algo Trading
  • Elliot Wave Theory
  • Advanced Excel
  • Cryptocurrency
  • NSE Certification Course
  • Courses:​
  • Options Trading
  • Dow Theory
  • Momentum Trading
  • Stock Investing
  • Stock Market for Beginners
  • Harmonic Chart Patterns
  • Algo Trading
  • Elliot Wave Theory
  • Advanced Excel
  • Cryptocurrency
  • NSE Certification Course
  • Webinars:
  • Bank Nifty Scalping
  • Intraday Trading Strategies
  • Options Trading Strategies
  • Options selling
  • Price Action
  • Relative Strength
  • Tax Planning
  • Options Buying
  • Growth Stocks
  • Portfolio Management
  • Relative Strength Index
  • Risk Management
  • Renko Charts
  • Crude Oil
  • Traders Psychology
  • Moving Average
  • Multibagger Stocks
  • Free Learning Modules:
  • Intraday Trading
  • Options Scalping
  • Swing Trading
  • Financial Modelling
  • RSI Indicator
  • Bollinger Bands
  • Pricing of Futures
  • Personal Finance
  • Initial Public Offerings (IPO)
  • Value Investing
  • Technical Indicators
  • Candlesticks
  • Chart Patterns
  • Option Greeks
  • ELSS Funds
  • Banking and Insurance
  • Real Estate
  • Gold
  • Book Summaries:
  • Rich Dad Poor Dad
  • Psychology of Money
  • The Intelligent Investor
  • The Richest Man in Babylon
  • Think and Trade Like a Champion
  • Value Investing and Behavioural Finance
  • Trading in the Zone
  • Learn to Earn
  • Book Summaries:
  • Rich Dad Poor Dad
  • Psychology of Money
  • The Intelligent Investor
  • The Richest Man in Babylon
  • Think and Trade Like a Champion
  • Value Investing and Behavioural Finance
  • Trading in the Zone
  • Learn to Earn
  • Tools:
  • CAGR Calculator
  • SIP Calculator
  • eLearnOptions
  • Future Value Calculator
  • Present Value Calculator
  • Atal Pension Yojana
  • Cost of Delay Calculator
  • Become a Crorepati
  • Tools:
  • CAGR Calculator
  • SIP Calculator
  • eLearnOptions
  • Future Value Calculator
  • Present Value Calculator
  • Atal Pension Yojana
  • Cost of Delay Calculator
  • Become a Crorepati

© 2023 Elearnmarkets. All Rights Reserved

  • Visit Elearnmarkets
  • Courses
  • Webinars
  • Financial Guides
  • Get Free Counselling
  • Visit Elearnmarkets
  • Courses
  • Webinars
  • Financial Guides
  • Get Free Counselling

Get Elearnmarkets App

No Result
View All Result
  • Article Categories
    • Basic Finance
    • Derivatives
    • Financial Planning
    • Fundamental Analysis
    • Technical Analysis
    • Marketshala
    • Miscellaneous
  • Language
    • Hindi
    • Bengali
    • English
  • Courses
  • Webinars

© 2020 Elearnmarkets All Rights Reserved

Suggested Learning

Technical Analysis Made Easy

Certification in Online Technical Analysis

Online NSE Academy Certified Capital Market Professional (E-NCCMP)