Nifty close …..: Nifty opened gap up of more than 1% in today’s session and remained strong on the back of mega recapitalisation plan for PSU banks and clearance to big highway projects by Government.
Hourly Technical:
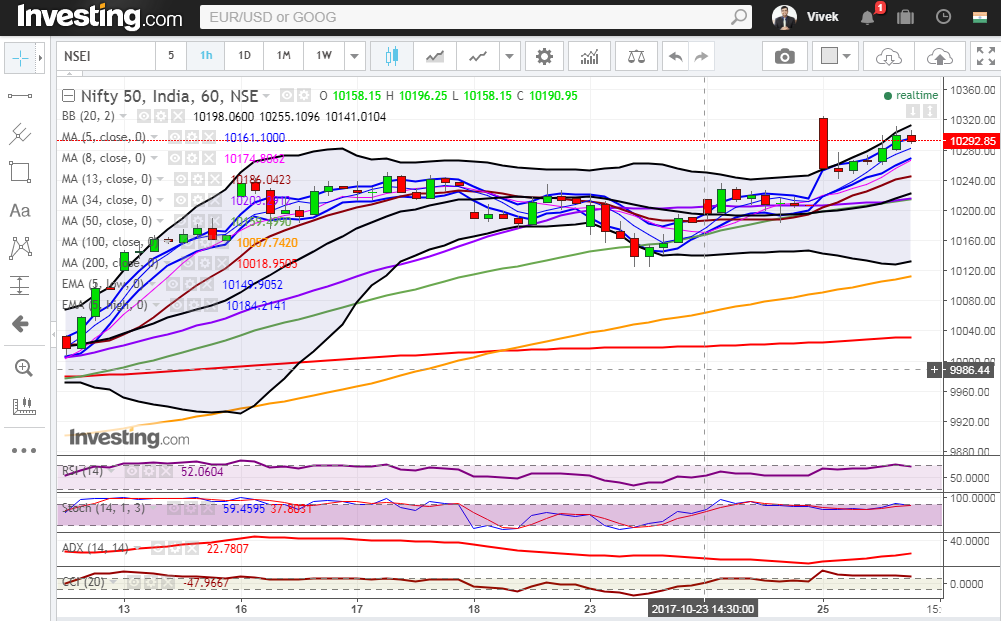
In the hourly chart, Nifty opened at all time high but gave most of the opening gains in the first hour but gradually inched higher to close marginally below 10300. The probable support in the hourly chart comes at 8 hour moving average (presently at approx. 10276.7), 13 hour moving average (presently at approx.10251.5) and 20 hour moving average (presently at approx.10229.9).
On the upside, Nifty may face resistance at Upper Bollinger line (presently at approx. 10316.9).
Hourly Stochastic, CCI and RSI are in the overbought zone and ADX is again inching higher suggesting gain of momentum. Overall Nifty remains higher in the Hourly chart.
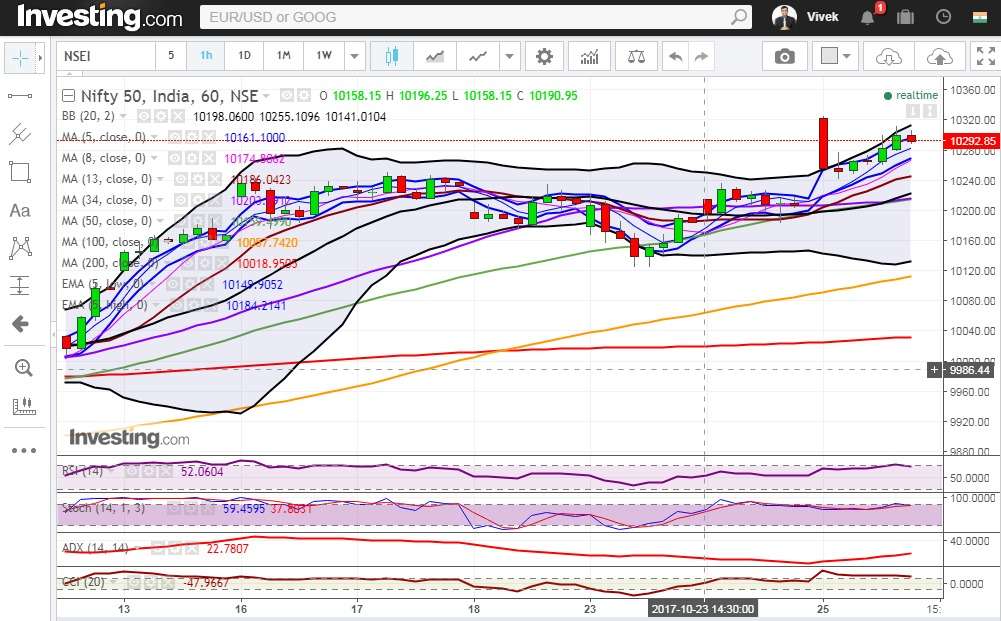
Figure: Hourly Chart
Daily Technical:
In the daily chart, Nifty has closed above 5 Day High EMA and also above all short term moving averages indicating a positive bias. The probable support in the daily chart comes at 5 Day High EMA (presently at approx.10254.9).
On the upside, Nifty may face resistance at Upper Bollinger line (presently at approx.10370.5)
Stochastic, CCI are in the overbought zone while RSI is marginally below its upper bound. Overall Nifty remains very bullish in the daily chart.
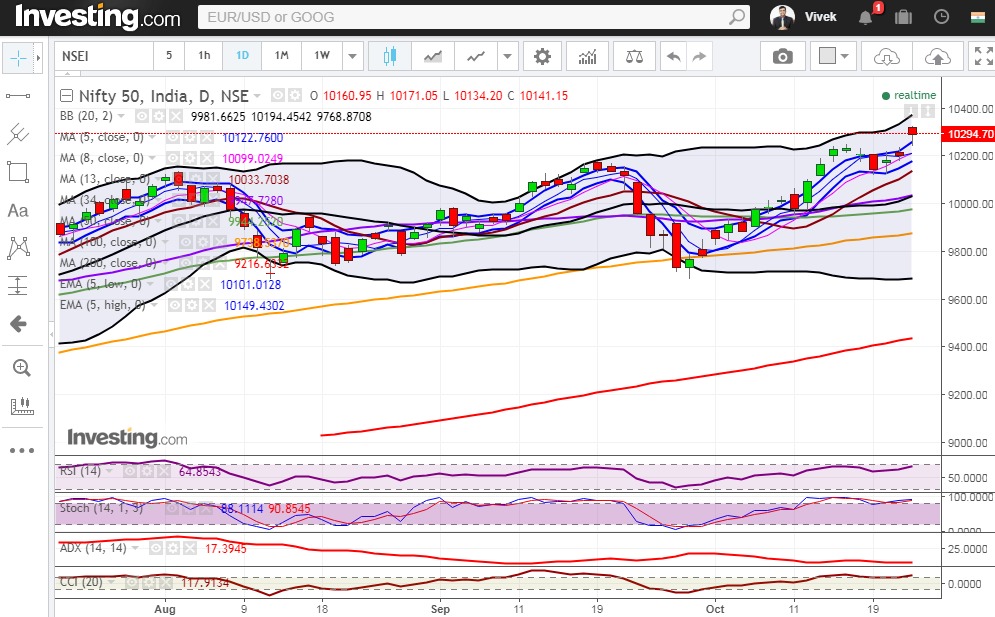
Figure: Daily Chart
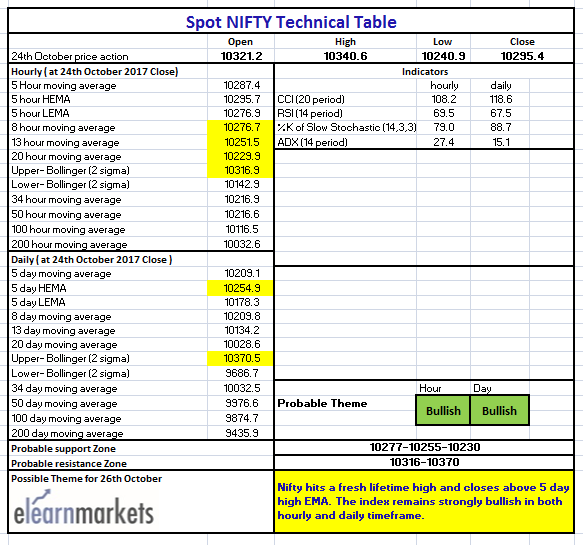
Figure: Tech Table


