Nifty close 10714.30: The last trading day of the week ended in positive note. Almost all the sectors moved up as the market went up. Nifty almost covered the last two bearish candles made on Wednesday and Thursday. The market had fallen this week due to macro-economic factors such as weakening of currency, trade war and 10 year bond yield going up.
Hourly Technical
As we can see in the chart, whole day Nifty went on climbing up. But still the market sentiment is not suggesting any possible uptrend.
From the chart below we can see that Indicator RSI is was just about to reach 60 and closed at 57, Stochastic has entered into its overbought zone (presently at approx. 95), But ADX continuously moved down and ended at 25 . CCI closed at 126.7
Overall in the hourly chart the sentiment is very bullish but the market is still bearish. We can see that the market didn’t have much strength as indicated by ADX.If the market opens down on Monday, then we may say that the market has reversed and became bearish.
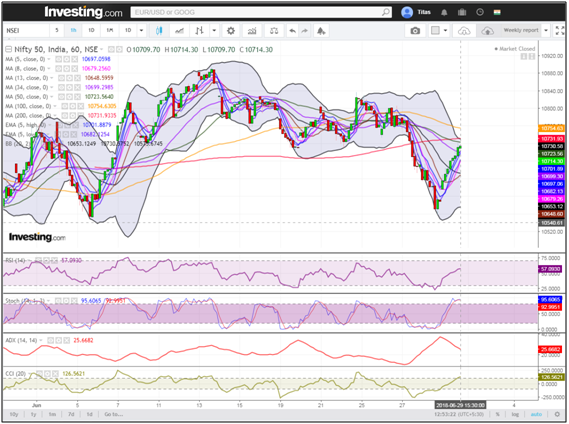
(Hourly chart)
Daily Technical
From the Daily chart of Nifty we can see, the market has recoveredfrom the last two trading sessions. But the market is still bearish .10560 to 10800 is being the very crucial zone for the index.
From the chart below we can see that RSI is at 50, Stochastic has reached to 46.67, ADX is neutral (presently at approx. 12) and the CCI is below 100.So It is clearly visible there is no strong indication from the indicators.
Overall from the daily chart we are expecting Nifty to be bearish for next week. If the market crosses below 10560 then the market will go down. If the markets open down on Monday then we may expect bearish reversal.
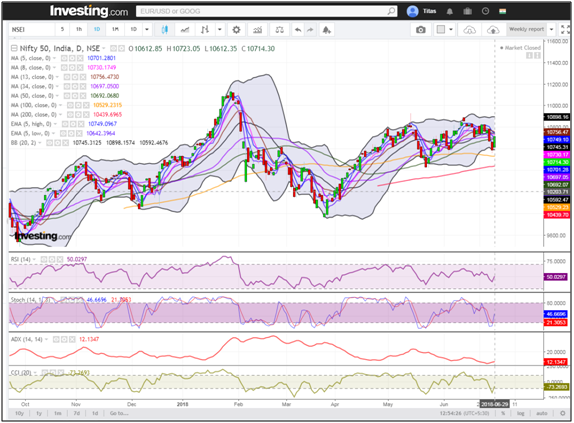
(Daily chart)
Weekly Technical
This week’s candle was bearish and it has made a spike downward as the market was bullish in the last trading session. There is no upside or down side sentiment visible from the chart. As we can see from the chart Candlestick’s price action is very weak market is just trying to recover the downside slowly.
Let’s discuss the indicators,
RSi is moved to 57 from 60 last week, Stochastic has crossed down the overbought level and is at 57, ADX is also trading flat (presently at approx. 15.29) and CCI has also moved downward to 66.59
The market is still looking bearish and if the market opens down then we can definitely say that the bearish reversal has came.The support level of 10560 is very crucial both in terms of price actions and market psychology Until the Nifty is above 10800 we cannot say that the market is bullish.
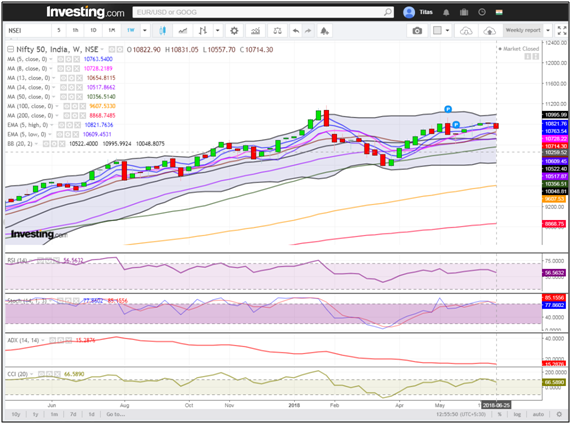
(Weekly chart)
You can use stockedge app to get cutting edge over others in both short term trading and investing. Here you not only get data at one particular place but can also create your own combination scans based on your own technical and fundamental parameter. See the video below to know about various features in Stockedge app.
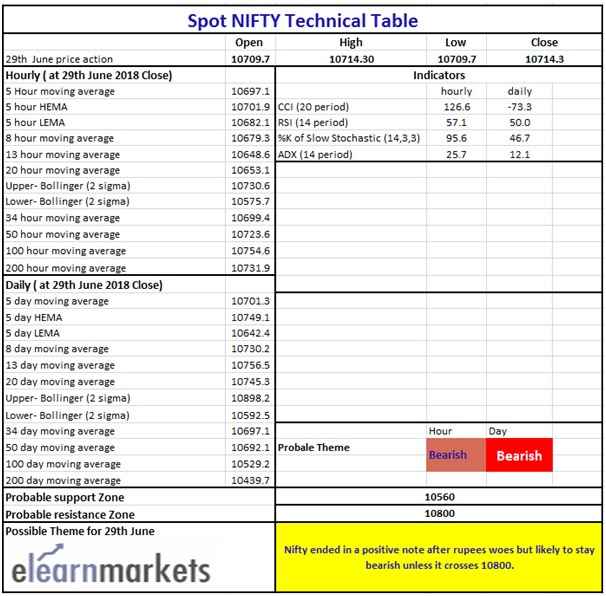
Nifty Technical Chart


