Elearnmarkets - Financial Market Learning
  • Categories
    • Basic Finance
    • Derivatives
    • Financial Planning
    • Fundamental Analysis
    • Technical Analysis
    • Marketshala
    • Miscellaneous
  • Language
    • English
    • Hindi
    • Bengali
No Result
View All Result
  • Courses
  • Webinars
  • Learn On Elearnmarkets
Elearnmarkets - Learn Stock Market, trading, investing for Free
No Result
View All Result
Home Technical Analysis Market Analysis
Figure: Nifty Daily Chart

Nifty Forms Bearish Engulfing Pattern in Weekly Chart, in sync with Ongoing Global Risk-off :

Elearnmarkets by Elearnmarkets
November 18, 2020
in Market Analysis, Market Wrap
Reading Time: 2 mins read
0
123
VIEWS
Share on FacebookShare on TwitterShare on WhatsApp

Nifty (weekly close approx. 10760.6):

This week Nifty started bullish on the back of budget euphoria on Monday. But as the week progressed, significant global correction set the bearish tone and Nifty started falling in run-up to budget. The reintroduction of Long term capital gain tax in budget unnerved few market players and there were worries on the fiscal mathematics in the upcoming financial year. Hence the bond yield in G-Sec rose to close to 7.6% in India and rising bond yields in USA triggered risk-off trade across globe. Finally, Nifty closed c.256 points down on Friday in sync with a global correction that saw 4-5% shaved-off in most major global markets.
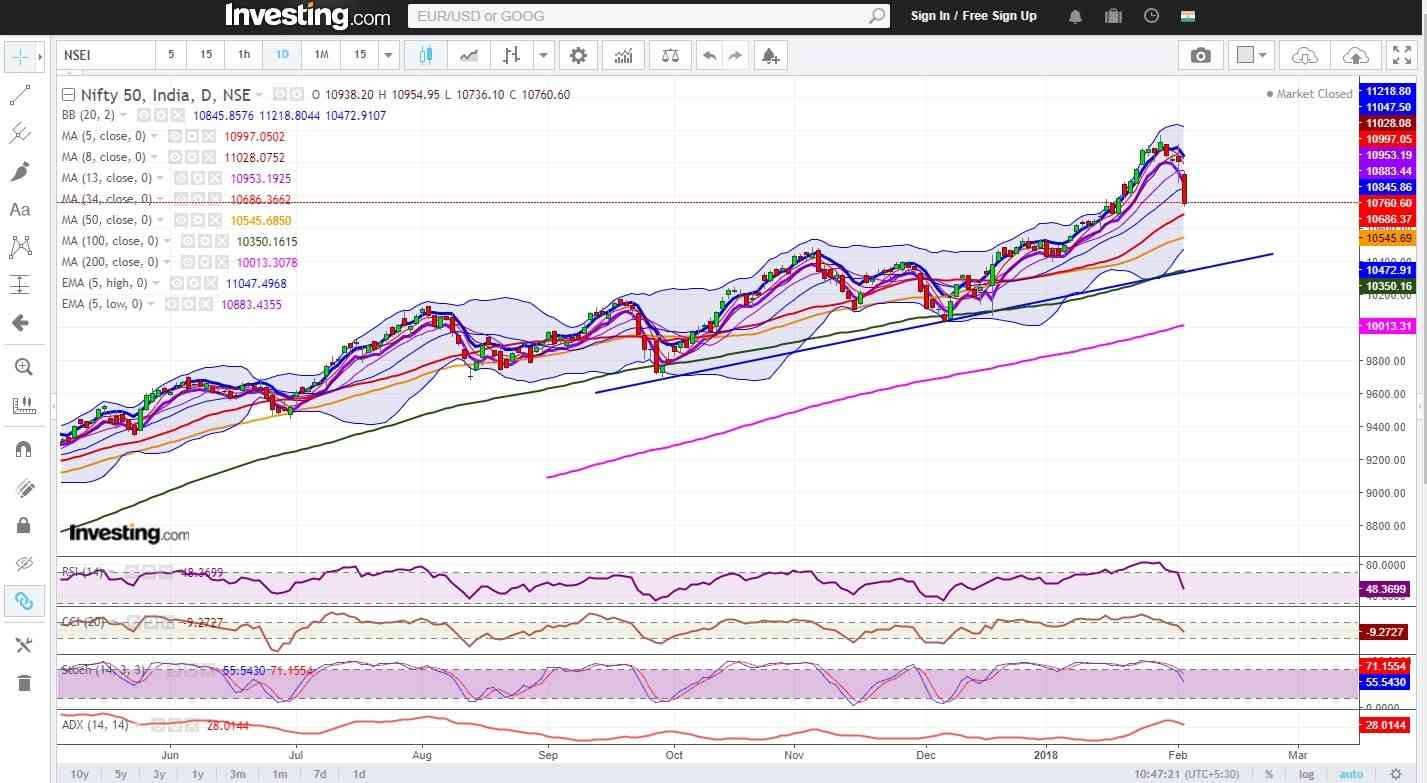
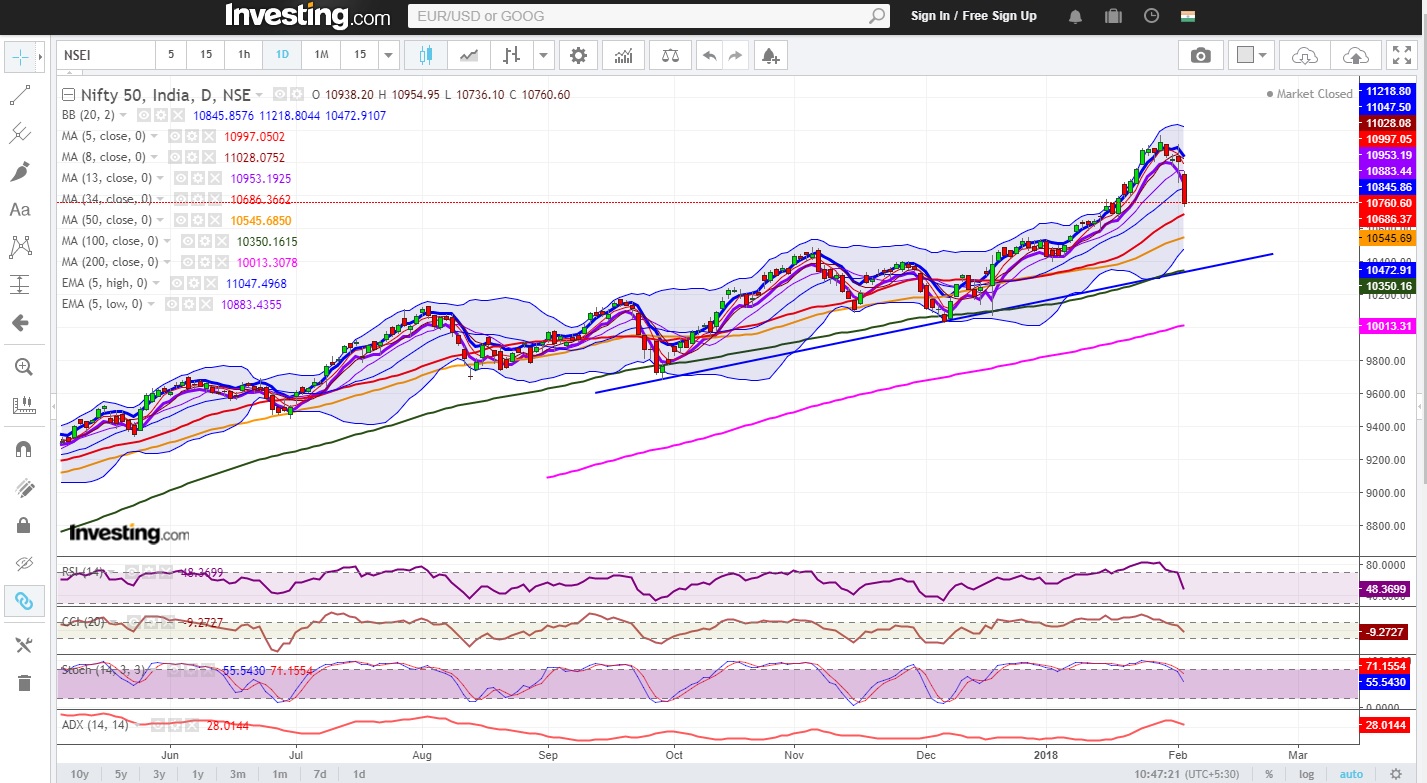
Figure: Nifty Daily Chart

Figure: Daily Chart

The daily CCI, RSI, Slow Stochastic have entered into the normal zone from overbought zone indicating a shift of sentiment. Nifty has seen a significant correction but the picture is more acute in the cases of mid and small-cap stocks. This may continue for some more time. Technically speaking 5 day low EMA is very crucial level going forward. Any close above 5 day low EMA will be the first sign of the correction halting for the time being. A close above 5 days high EMA would mean the uptrend resuming after this dramatic correction. But, such bullish possibilities remain absent under present market set-up.

In the hourly chart, Nifty is clearly bearish and will remain so as long as Nifty stays below 20 hours moving average. The hourly CCI, RSI, Slow Stochastic all are firmly in oversold zone, which indicates continued bearish momentum.

Join TMP Join TMP Join TMP

Nifty Hourly Chart

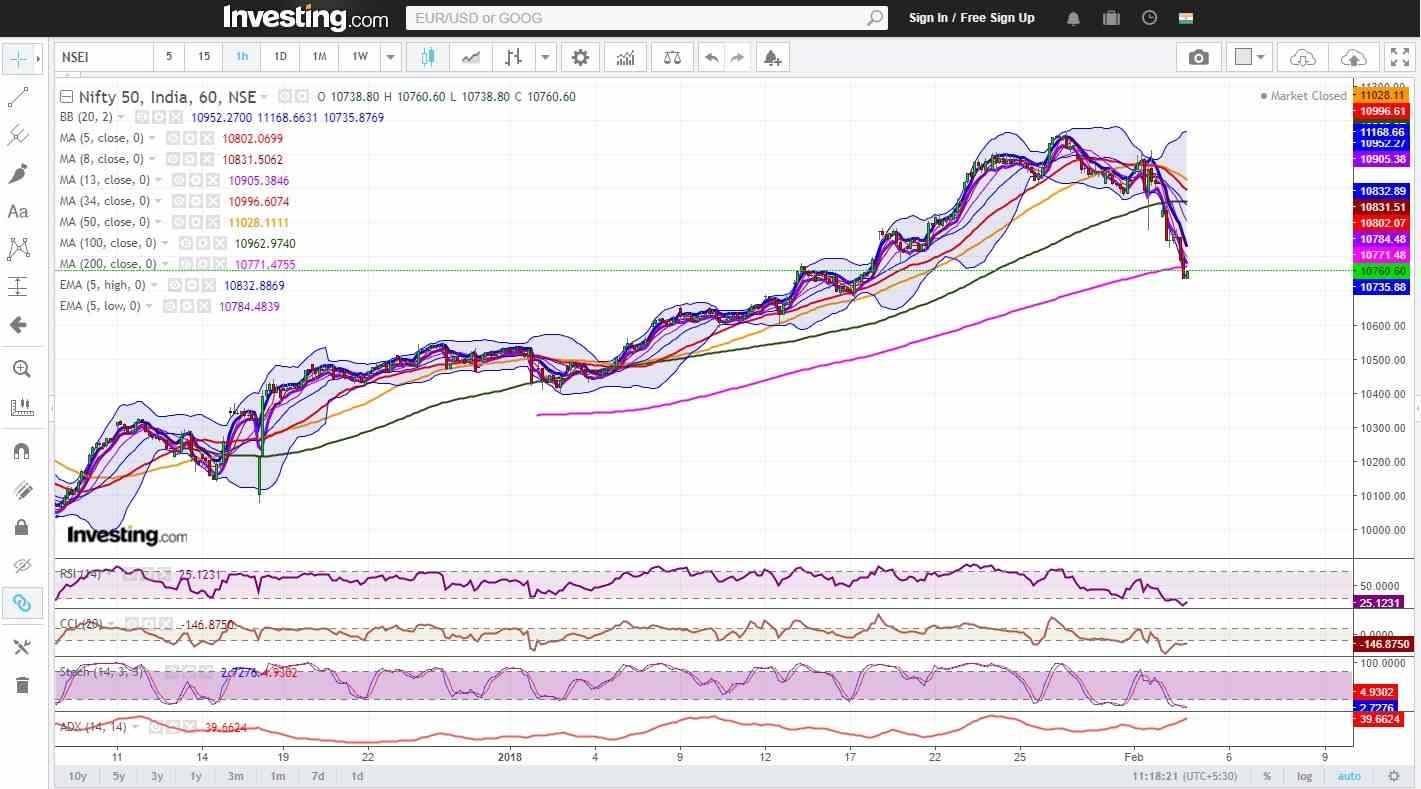
Figure: Hourly Chart
Technical possibilities for upcoming week:

Nifty formed a bearish engulfing pattern in the weekly chart. Earlier too Nifty formed such bearish weekly candles in this up-move but had shrugged off the sentiment after 1-2 weeks. But this time things may be different as Nifty faces the challenges of higher crude oil prices, higher global bond yields, global risk-off and domestic sell-off due to effects of the long-term capital gain tax. If bearish momentum continues, Nifty may choose to revisit 10400 -10500 zone in the coming week.

Become a Technical Analyst Expert? Enroll in: NSE Academy Certified Technical Analysis course on Elearnmarkets.

Nifty Weekly Chart

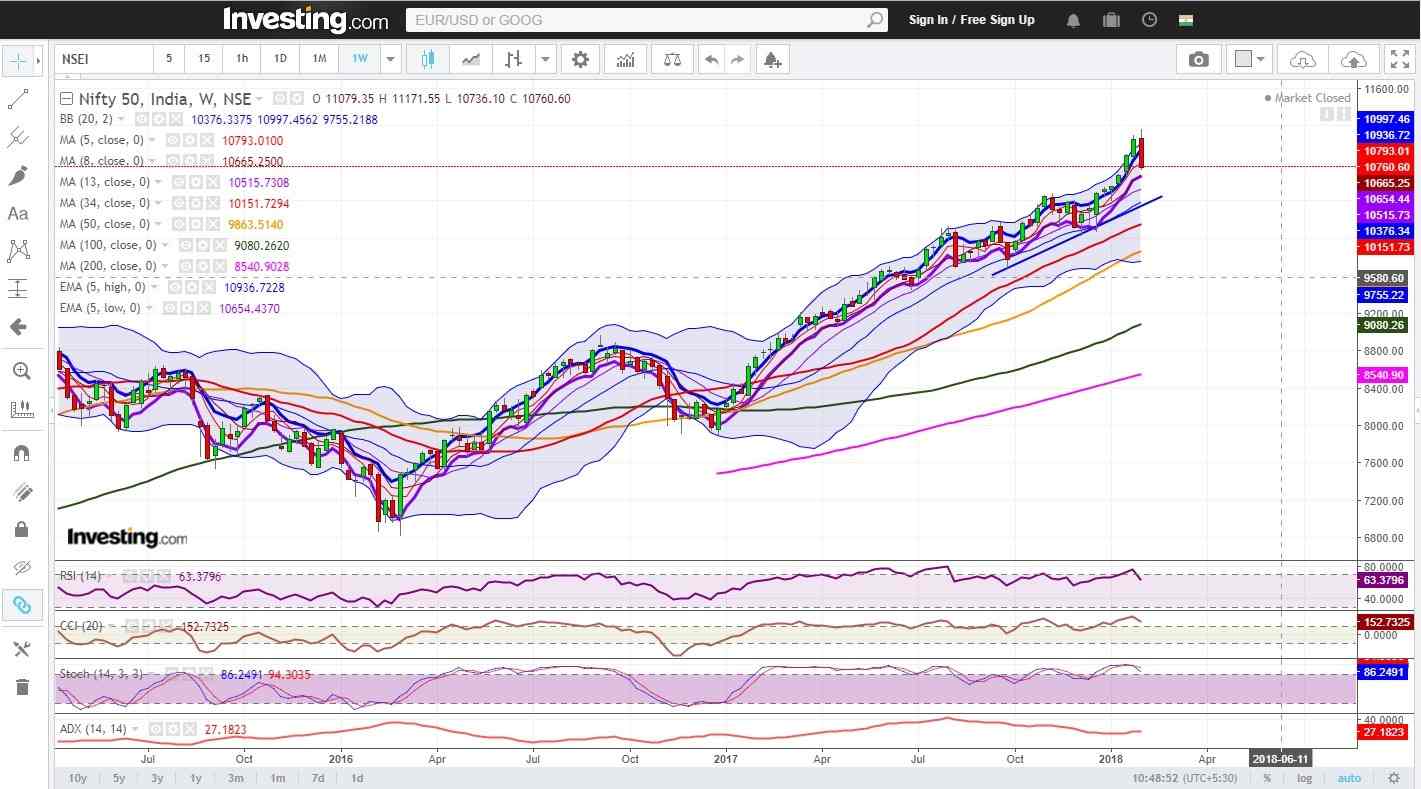
Figure: Weekly Chart

ELM Nifty level Matrix 5th Feb

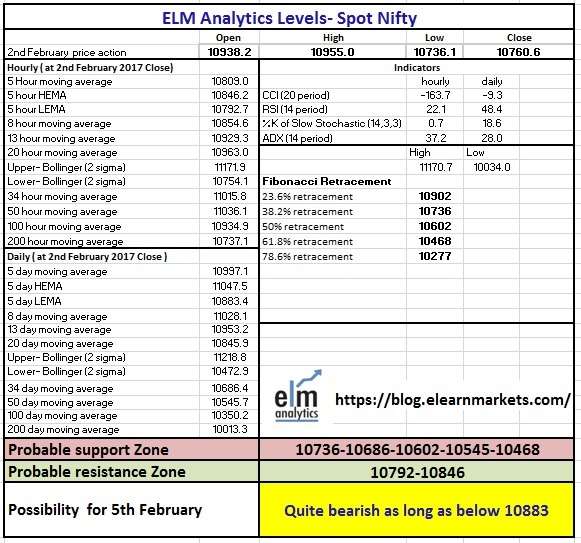
Figure: ELM Nifty level Matrix 5th Feb

We are including the ELM level matrix for Nifty for Monday 5th February for your reference.

To know how to analyze the above matrix, you can watch the video below:

Tags: english
ShareTweetSend
Previous Post

Charts of the day – 2nd Feb, 2018

Next Post

Charts of the day – 5th Feb, 2018

Elearnmarkets

Elearnmarkets

Elearnmarkets (ELM) is a complete financial market portal where the market experts have taken the onus to spread financial education. ELM constantly experiments with new education methodologies and technologies to make financial education effective, affordable and accessible to all. You can connect with us on Twitter @elearnmarkets.

Related Posts

Hourly Chart
Market Analysis

Nifty Ends on Positive Note, Gains Approx. 475 Points on Positive Global Factors

November 18, 2020
378
Weekly Chart
Market Analysis

Huge Sell-Off Makes the Market Close in a Negative Note on the Expiry Week

November 18, 2020
175
Hourly Chart
Market Analysis

Nifty Ends in Green. Rupee Appreciates and Falling Crude Price Helped the Market to Recover Approx. 140 Point

November 18, 2020
129
Hourly Chart
Market Analysis

Sell Off Continues. Nifty Ends The Week With Three Consecutive Red Candles

November 18, 2020
141

Leave a Reply Cancel reply

Your email address will not be published. Required fields are marked *

Follow Us

Facebook-f Twitter Instagram Linkedin-in Youtube Telegram

Register on Elearnmarkets

Continue your financial learning by creating your own account on Elearnmarkets.com

Register Free Account

Download App

Categories

  • Basic Finance
  • Derivatives
  • Financial Planning
  • Fundamental Analysis
  • Technical Analysis
  • Marketshala
  • Miscellaneous

Popular On Elearnmarkets

  • Market Superheroes:
  • Vivek Bajaj
  • Chetan Panchamia
  • Ashish Kyal
  • Premal Parekh
  • Abhijit Paul
  • Jegan
  • Sivakumar Jayachadran
  • Vishal Malkan
  • Jyoti Budhia
  • Vivek Gadodia
  • Vishal Mehta
  • Piyush Chaudhry
  • Santosh Pasi
  • Gomathi Shankar
  • Market Superheroes:
  • Vivek Bajaj
  • Chetan Panchamia
  • Ashish Kyal
  • Premal Parekh
  • Abhijit Paul
  • Jegan
  • Sivakumar Jayachadran
  • Vishal Malkan
  • Jyoti Budhia
  • Vivek Gadodia
  • Vishal Mehta
  • Piyush Chaudhry
  • Santosh Pasi
  • Gomathi Shankar
  • Courses:​
  • Options Trading
  • Dow Theory
  • Momentum Trading
  • Stock Investing
  • Stock Market for Beginners
  • Harmonic Chart Patterns
  • Algo Trading
  • Elliot Wave Theory
  • Advanced Excel
  • Cryptocurrency
  • NSE Certification Course
  • Courses:​
  • Options Trading
  • Dow Theory
  • Momentum Trading
  • Stock Investing
  • Stock Market for Beginners
  • Harmonic Chart Patterns
  • Algo Trading
  • Elliot Wave Theory
  • Advanced Excel
  • Cryptocurrency
  • NSE Certification Course
  • Webinars:
  • Bank Nifty Scalping
  • Intraday Trading Strategies
  • Options Trading Strategies
  • Options selling
  • Price Action
  • Relative Strength
  • Tax Planning
  • Options Buying
  • Growth Stocks
  • Portfolio Management
  • Relative Strength Index
  • Risk Management
  • Renko Charts
  • Crude Oil
  • Traders Psychology
  • Moving Average
  • Multibagger Stocks
  • Free Learning Modules:
  • Intraday Trading
  • Options Scalping
  • Swing Trading
  • Financial Modelling
  • RSI Indicator
  • Bollinger Bands
  • Pricing of Futures
  • Personal Finance
  • Initial Public Offerings (IPO)
  • Value Investing
  • Technical Indicators
  • Candlesticks
  • Chart Patterns
  • Option Greeks
  • ELSS Funds
  • Banking and Insurance
  • Real Estate
  • Gold
  • Book Summaries:
  • Rich Dad Poor Dad
  • Psychology of Money
  • The Intelligent Investor
  • The Richest Man in Babylon
  • Think and Trade Like a Champion
  • Value Investing and Behavioural Finance
  • Trading in the Zone
  • Learn to Earn
  • Book Summaries:
  • Rich Dad Poor Dad
  • Psychology of Money
  • The Intelligent Investor
  • The Richest Man in Babylon
  • Think and Trade Like a Champion
  • Value Investing and Behavioural Finance
  • Trading in the Zone
  • Learn to Earn
  • Tools:
  • CAGR Calculator
  • SIP Calculator
  • eLearnOptions
  • Future Value Calculator
  • Present Value Calculator
  • Atal Pension Yojana
  • Cost of Delay Calculator
  • Become a Crorepati
  • Tools:
  • CAGR Calculator
  • SIP Calculator
  • eLearnOptions
  • Future Value Calculator
  • Present Value Calculator
  • Atal Pension Yojana
  • Cost of Delay Calculator
  • Become a Crorepati

© 2023 Elearnmarkets. All Rights Reserved

  • Visit Elearnmarkets
  • Courses
  • Webinars
  • Financial Guides
  • Get Free Counselling
  • Visit Elearnmarkets
  • Courses
  • Webinars
  • Financial Guides
  • Get Free Counselling

Get Elearnmarkets App

No Result
View All Result
  • Article Categories
    • Basic Finance
    • Derivatives
    • Financial Planning
    • Fundamental Analysis
    • Technical Analysis
    • Marketshala
    • Miscellaneous
  • Language
    • Hindi
    • Bengali
    • English
  • Courses
  • Webinars

© 2020 Elearnmarkets All Rights Reserved

Suggested Learning

Technical Analysis Made Easy

Certification in Online Technical Analysis

Online NSE Academy Certified Capital Market Professional (E-NCCMP)