Elearnmarkets - Financial Market Learning
  • Categories
    • Basic Finance
    • Derivatives
    • Financial Planning
    • Fundamental Analysis
    • Technical Analysis
    • Marketshala
    • Miscellaneous
  • Language
    • English
    • Hindi
    • Bengali
No Result
View All Result
  • Courses
  • Webinars
  • Learn On Elearnmarkets
Elearnmarkets - Learn Stock Market, trading, investing for Free
No Result
View All Result
Home Technical Analysis Market Analysis Market Wrap
Nifty ends in the range bound zone, trade war continues 1

Nifty ends in the range bound zone, trade war continues

Elearnmarkets by Elearnmarkets
November 18, 2020
in Market Wrap
Reading Time: 3 mins read
0
254
VIEWS
Share on FacebookShare on TwitterShare on WhatsApp

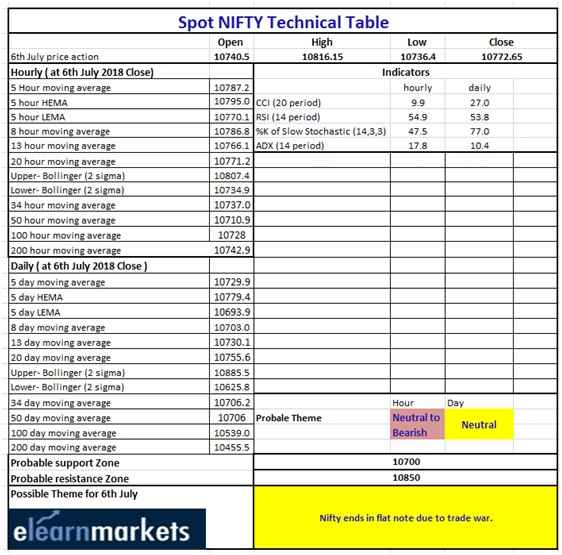
Nifty close 10772.65:Trade war making the market highly unpredictable and volatile. This week Nifty made higher highs and higher lows in the daily chart but ultimately it ended in the same zone (10600-10800). In the weekly chart this is the 6th time index tries to cross the level.

However, we can expect a major movement for the next trading week because Nifty is standing at a very important level. Break in the up side may define a new trend for the index otherwise we may witnessmore spike or shadows in the chart.

Hourly Technical

In the hourly chart we can see a short term uptrend is taking shape. The upper Bollinger band (presently at approx. 10807) act as a resistance here. This could be the one of the reason for the last hour sell off.

Let’s discuss the technical parameters. RSI is below 60, ADX is below 20 and facing downward, Stochastic and CCI in its normal zone. So from the indicator there is no such certain signal. Momentum is flat as well as the strength.

Overall, from the hourly chart we can expect that the short term uptrend may be continued if The index able to break the 10800 level and close above it. Unless there is a chance of short term downfall.
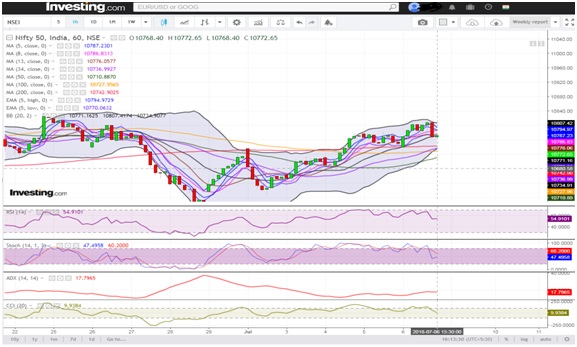
Join TMP Join TMP Join TMP

Nifty ends in the range bound zone, trade war continues 2(Hourly chart)

Daily Technical

From the hourly chart we can see that the index is trading at a crucial resistance level. In the last trading day, it crossed the 10800 mark but unable to close above it. Breaking this level will create a new direction for the index.

Indicators are also trading quite flat. RSI is below 60, ADX is just above level 10, CCI is in its normal zone and Stochastic is about to cross its overbought level (presently at approx. 76.96).

One good factor for the index is that most of the moving average lines are below the price and in case of a short term downfall they might act as support (possible support area approx. at 10700 level). In case of a up move there is only one major level which will act as a strong resistance (Upper Bollinger line presently at approx. 10885)
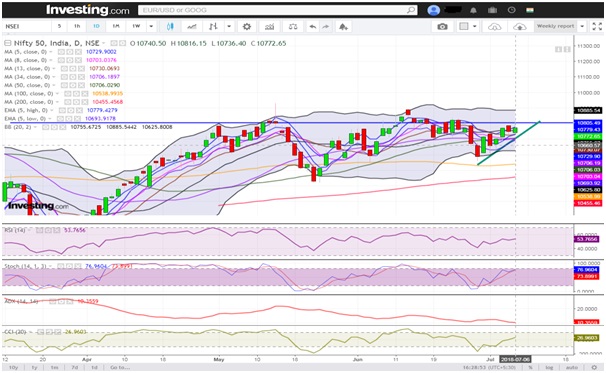
Nifty ends in the range bound zone, trade war continues 3(Daily chart)

Weekly Technical:

Nifty is still in the range bound zone in the weekly chart. This has been 6th attempt made by the index to cross and close above 10800 level. As we can we can see from the chart most of the candles are Doji which suggesting indecision in the market. However, from the lower shadow we can decipher that the buyers are still present in the market.

Momentum Indicator RSI is about to cross level 60 (presently at approx. 58.28), Stochastic has went up above 80 level, ADX is below 15 and facing downward and CCI is in its normal zone.
Overall there is no mentionable movements visible from the indicators. But price is above most of MA lines which is a good sign. Just like the daily chart, Upper Bollinger band will also act as a resistance in case of anup move (presently at 11022.89 level) in case of a short term down fall support is visible at 10700 level.
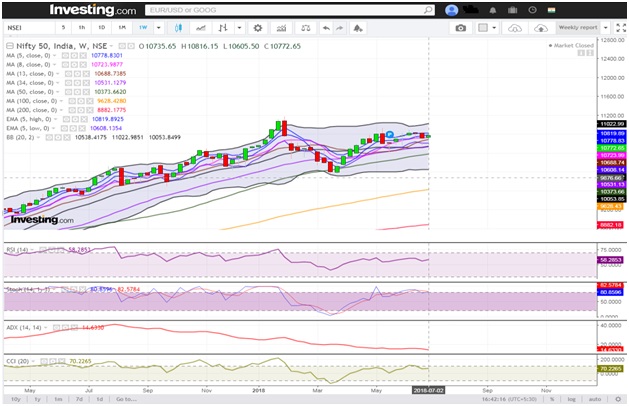
Nifty ends in the range bound zone, trade war continues 4(Weekly chart)

You can use stockedge app to get cutting edge over others in both short term trading and investing. Here you not only get data at one particular place but can also create your own combination scans based on your own technical and fundamental parameter. See the video below to know about various features in Stockedge app.

Nifty ends in the range bound zone, trade war continues 5

ShareTweetSend
Previous Post

Moving Average Indicator – a technical tool for traders

Next Post

SEBI: Role, Objective, Structure and Functions of Securities and Exchange Board of India

Elearnmarkets

Elearnmarkets

Elearnmarkets (ELM) is a complete financial market portal where the market experts have taken the onus to spread financial education. ELM constantly experiments with new education methodologies and technologies to make financial education effective, affordable and accessible to all. You can connect with us on Twitter @elearnmarkets.

Related Posts

Hourly Chart
Market Analysis

Nifty Ends on Positive Note, Gains Approx. 475 Points on Positive Global Factors

November 18, 2020
378
Weekly Chart
Market Analysis

Huge Sell-Off Makes the Market Close in a Negative Note on the Expiry Week

November 18, 2020
175
Hourly Chart
Market Analysis

Nifty Ends in Green. Rupee Appreciates and Falling Crude Price Helped the Market to Recover Approx. 140 Point

November 18, 2020
129
Hourly Chart
Market Analysis

Sell Off Continues. Nifty Ends The Week With Three Consecutive Red Candles

November 18, 2020
141

Leave a Reply Cancel reply

Your email address will not be published. Required fields are marked *

Follow Us

Facebook-f Twitter Instagram Linkedin-in Youtube Telegram

Register on Elearnmarkets

Continue your financial learning by creating your own account on Elearnmarkets.com

Register Free Account

Download App

Categories

  • Basic Finance
  • Derivatives
  • Financial Planning
  • Fundamental Analysis
  • Technical Analysis
  • Marketshala
  • Miscellaneous

Popular On Elearnmarkets

  • Market Superheroes:
  • Vivek Bajaj
  • Chetan Panchamia
  • Ashish Kyal
  • Premal Parekh
  • Abhijit Paul
  • Jegan
  • Sivakumar Jayachadran
  • Vishal Malkan
  • Jyoti Budhia
  • Vivek Gadodia
  • Vishal Mehta
  • Piyush Chaudhry
  • Santosh Pasi
  • Gomathi Shankar
  • Market Superheroes:
  • Vivek Bajaj
  • Chetan Panchamia
  • Ashish Kyal
  • Premal Parekh
  • Abhijit Paul
  • Jegan
  • Sivakumar Jayachadran
  • Vishal Malkan
  • Jyoti Budhia
  • Vivek Gadodia
  • Vishal Mehta
  • Piyush Chaudhry
  • Santosh Pasi
  • Gomathi Shankar
  • Courses:​
  • Options Trading
  • Dow Theory
  • Momentum Trading
  • Stock Investing
  • Stock Market for Beginners
  • Harmonic Chart Patterns
  • Algo Trading
  • Elliot Wave Theory
  • Advanced Excel
  • Cryptocurrency
  • NSE Certification Course
  • Courses:​
  • Options Trading
  • Dow Theory
  • Momentum Trading
  • Stock Investing
  • Stock Market for Beginners
  • Harmonic Chart Patterns
  • Algo Trading
  • Elliot Wave Theory
  • Advanced Excel
  • Cryptocurrency
  • NSE Certification Course
  • Webinars:
  • Bank Nifty Scalping
  • Intraday Trading Strategies
  • Options Trading Strategies
  • Options selling
  • Price Action
  • Relative Strength
  • Tax Planning
  • Options Buying
  • Growth Stocks
  • Portfolio Management
  • Relative Strength Index
  • Risk Management
  • Renko Charts
  • Crude Oil
  • Traders Psychology
  • Moving Average
  • Multibagger Stocks
  • Free Learning Modules:
  • Intraday Trading
  • Options Scalping
  • Swing Trading
  • Financial Modelling
  • RSI Indicator
  • Bollinger Bands
  • Pricing of Futures
  • Personal Finance
  • Initial Public Offerings (IPO)
  • Value Investing
  • Technical Indicators
  • Candlesticks
  • Chart Patterns
  • Option Greeks
  • ELSS Funds
  • Banking and Insurance
  • Real Estate
  • Gold
  • Book Summaries:
  • Rich Dad Poor Dad
  • Psychology of Money
  • The Intelligent Investor
  • The Richest Man in Babylon
  • Think and Trade Like a Champion
  • Value Investing and Behavioural Finance
  • Trading in the Zone
  • Learn to Earn
  • Book Summaries:
  • Rich Dad Poor Dad
  • Psychology of Money
  • The Intelligent Investor
  • The Richest Man in Babylon
  • Think and Trade Like a Champion
  • Value Investing and Behavioural Finance
  • Trading in the Zone
  • Learn to Earn
  • Tools:
  • CAGR Calculator
  • SIP Calculator
  • eLearnOptions
  • Future Value Calculator
  • Present Value Calculator
  • Atal Pension Yojana
  • Cost of Delay Calculator
  • Become a Crorepati
  • Tools:
  • CAGR Calculator
  • SIP Calculator
  • eLearnOptions
  • Future Value Calculator
  • Present Value Calculator
  • Atal Pension Yojana
  • Cost of Delay Calculator
  • Become a Crorepati

© 2023 Elearnmarkets. All Rights Reserved

  • Visit Elearnmarkets
  • Courses
  • Webinars
  • Financial Guides
  • Get Free Counselling
  • Visit Elearnmarkets
  • Courses
  • Webinars
  • Financial Guides
  • Get Free Counselling

Get Elearnmarkets App

No Result
View All Result
  • Article Categories
    • Basic Finance
    • Derivatives
    • Financial Planning
    • Fundamental Analysis
    • Technical Analysis
    • Marketshala
    • Miscellaneous
  • Language
    • Hindi
    • Bengali
    • English
  • Courses
  • Webinars

© 2020 Elearnmarkets All Rights Reserved