Elearnmarkets - Financial Market Learning
  • Categories
    • Basic Finance
    • Derivatives
      • Futures
      • Options
    • Financial Planning
    • Fundamental Analysis
    • Technical Analysis
    • Marketshala
    • Miscellaneous
  • Language
    • English
    • Hindi
    • Bengali
No Result
View All Result
  • Courses
  • Webinars
  • Stories
Elearnmarkets - Learn Stock Market, trading, investing for Free
No Result
View All Result
Home Technical Analysis Market Analysis
Nifty Hourly chart

Nifty closes at record high. Momentum is supper supportive, more upside is expected

Elearnmarkets by Elearnmarkets
August 28, 2023
in Market Analysis, Market Wrap
Reading Time: 4 mins read
0
44
VIEWS
Share on FacebookShare on XShare on WhatsApp

Nifty close 11278.35: Nifty trading at its record high. Most of the heavy weight companies’ quarterly result has been positive, except this FIIs has also shown positive approach by investing a lump sum amount in the Indian Equity market.

Momentum is favourable for the index and more side can be expected from the index.
However, 10350 to 10500 zone is going to be very important for the index. According Fibonacci retracement line 10350 (approx.) and psychological level 11500 might act as a resistance. Closest support level for the index would be 11100.

Hourly Technical: In the hourly chart Nifty is above all the moving Average lines. Index is slowly rising and the last candle has been formed within the range of the previous candle. So it is inside candle formation and because of this we may expect a gap up opening for Monday.
Indicators are very bullish, but some of them has gone extreme overbought level. So there is chance for little correction as well.

RSI is above 79, Stochastic is at 97 (approx.), ADX is 39 and CCI is above 100 but sloping down.

Overall most of the indicators are showing positive, momentum is supper supportive so we can expect more up move from the index but there is an also chance for little correction.
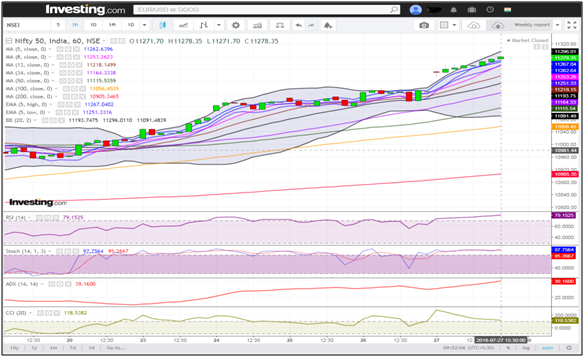
Nifty Hourly chart

(Hourly chart)

Daily Technical:

RelatedPosts

Weekly Chart

Huge Sell-Off Makes the Market Close in a Negative Note on the Expiry Week

August 22, 2023
191
Hourly Chart

Nifty Ends in Green. Rupee Appreciates and Falling Crude Price Helped the Market to Recover Approx. 140 Point

August 31, 2023
133
Hourly Chart

Sell Off Continues. Nifty Ends The Week With Three Consecutive Red Candles

September 4, 2023
147

Daily technical shows that the index started with a gap up opening and rallied upward direction. The candle is long enough to suggest that the bulls are pretty confident about their position.

Indicators and Moving Average lines are also in the positive zone.

RSI is above 73, Stochastic is in the level 99 (approx.), ADX is at 28 and CCI is above 150. So we can easily understand that the momentum as well as the strength of the index is total in the bull’s favour.

In case of resistance 11350 is a Fibonacci level which will act as a short term resistance and psychological level 11500 will also act as a strong resistance. There is also a chance for the index to fill the gap which is made on Friday’s trading session, in case of any downside 11100 will act as a support.
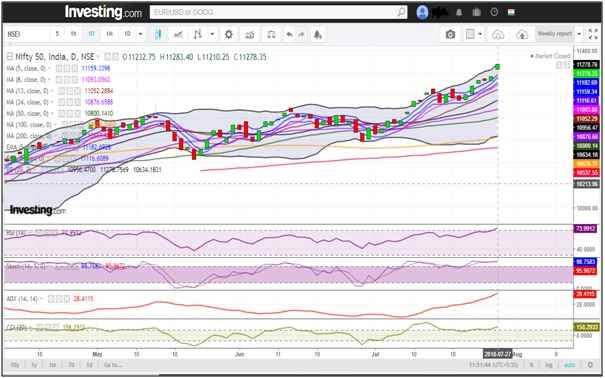
Nifty closes at record high. Momentum is supper supportive, more upside is expected 1

(Daily Chart)

Weekly Technical:

From the weekly chart we can say a bull run has just started and more upside may come soon. In the next trading session if the latest candle’s high is broken we may witness another long bullish candle. However, the latest candle close is above the Bollinger band so there is chance for little correction. In case of any down side previous swing high will act as a support.

Indicators are in the positive territory. RSI has crossed its 70 level, Stochastic is in the overbought level (presently at approx. 99.59), ADX is shaping up and just crossed its level 15, CCI is above 170.

Overall, Bulls are totally in control but little correction is expected and very less chance for any downside.
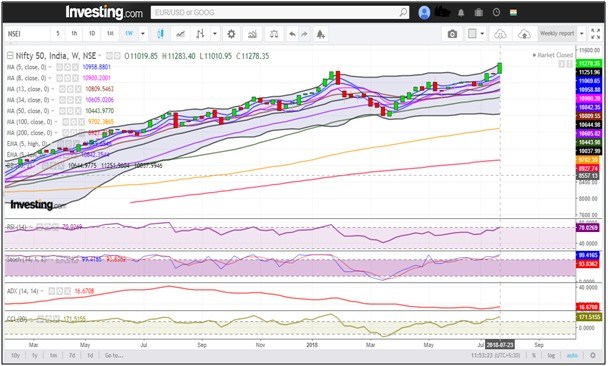
Nifty 50 weekly technical showing Bulls are totally in control but little correction is expected and very less chance for any downside

(Weekly Chart)

You can use stockedge app to get cutting edge over others in both short term trading and investing. Here you not only get data at one particular place but can also create your own combination scans based on your own technical and fundamental parameter. See the video below to know about various features in Stockedge app.
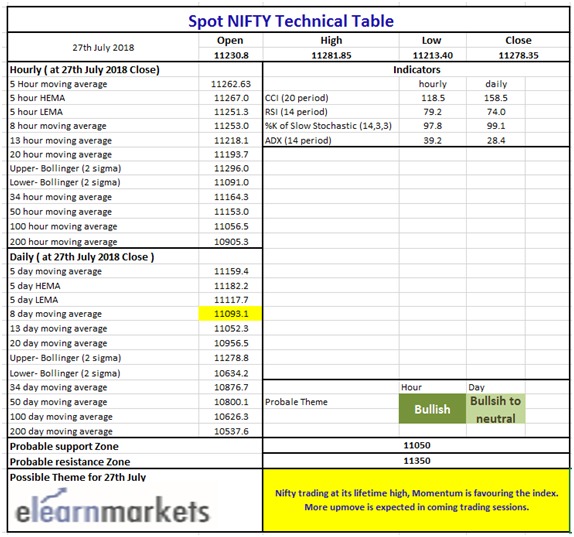
Spot Nifty Technical Table

(Tech Tble)

Tags: englishMarket Wrapnifty reportstock marketstock market reportweekly report
ShareTweetSend
Get Kotak Offer Get Kotak Offer Get Kotak Offer
Previous Post

Things you need to know about CFD trading industry

Next Post

How to build your Investment Strategies for lifetime

Elearnmarkets

Elearnmarkets

Elearnmarkets (ELM) is a complete financial market portal where the market experts have taken the onus to spread financial education. ELM constantly experiments with new education methodologies and technologies to make financial education effective, affordable and accessible to all. You can connect with us on Twitter @elearnmarkets.

Related Posts

Weekly Chart
Market Analysis

Huge Sell-Off Makes the Market Close in a Negative Note on the Expiry Week

August 22, 2023
191
Hourly Chart
Market Analysis

Nifty Ends in Green. Rupee Appreciates and Falling Crude Price Helped the Market to Recover Approx. 140 Point

August 31, 2023
133
Hourly Chart
Market Analysis

Sell Off Continues. Nifty Ends The Week With Three Consecutive Red Candles

September 4, 2023
147
Nifty Hourly Chart
Market Analysis

Nifty Witnessed A Flash Crash But Managed To Close Above 11100 Level

August 17, 2023
349

Leave a Reply Cancel reply

Your email address will not be published. Required fields are marked *

Elearnmarkets Logo

Follow Us

Facebook-f Twitter Instagram Linkedin-in Youtube Telegram

Register on Elearnmarkets

Continue your financial learning by creating your own account on Elearnmarkets.com

Register Free Account

Download App

Playstore logo
Download on app store

Categories

  • Basic Finance
  • Derivatives
  • Financial Planning
  • Fundamental Analysis
  • Technical Analysis
  • Marketshala
  • Miscellaneous

Popular On Elearnmarkets

  • Market Superheroes:
  • Vivek Bajaj
  • Chetan Panchamia
  • Ashish Kyal
  • Premal Parekh
  • Abhijit Paul
  • Jegan
  • Sivakumar Jayachadran
  • Vishal Malkan
  • Jyoti Budhia
  • Vivek Gadodia
  • Vishal Mehta
  • Piyush Chaudhry
  • Santosh Pasi
  • Gomathi Shankar
  • Market Superheroes:
  • Vivek Bajaj
  • Chetan Panchamia
  • Ashish Kyal
  • Premal Parekh
  • Abhijit Paul
  • Jegan
  • Sivakumar Jayachadran
  • Vishal Malkan
  • Jyoti Budhia
  • Vivek Gadodia
  • Vishal Mehta
  • Piyush Chaudhry
  • Santosh Pasi
  • Gomathi Shankar
  • Courses:​
  • Options Trading
  • Dow Theory
  • Momentum Trading
  • Stock Investing
  • Stock Market for Beginners
  • Harmonic Chart Patterns
  • Algo Trading
  • Elliot Wave Theory
  • Advanced Excel
  • Cryptocurrency
  • NSE Certification Course
  • Courses:​
  • Options Trading
  • Dow Theory
  • Momentum Trading
  • Stock Investing
  • Stock Market for Beginners
  • Harmonic Chart Patterns
  • Algo Trading
  • Elliot Wave Theory
  • Advanced Excel
  • Cryptocurrency
  • NSE Certification Course
  • Webinars:
  • Bank Nifty Scalping
  • Intraday Trading Strategies
  • Options Trading Strategies
  • Options selling
  • Price Action
  • Relative Strength
  • Tax Planning
  • Options Buying
  • Growth Stocks
  • Portfolio Management
  • Relative Strength Index
  • Risk Management
  • Renko Charts
  • Crude Oil
  • Traders Psychology
  • Moving Average
  • Multibagger Stocks
  • Free Learning Modules:
  • Intraday Trading
  • Options Scalping
  • Swing Trading
  • Financial Modelling
  • RSI Indicator
  • Bollinger Bands
  • Pricing of Futures
  • Personal Finance
  • Initial Public Offerings (IPO)
  • Value Investing
  • Technical Indicators
  • Candlesticks
  • Chart Patterns
  • Option Greeks
  • ELSS Funds
  • Banking and Insurance
  • Real Estate
  • Gold
  • Book Summaries:
  • Rich Dad Poor Dad
  • Psychology of Money
  • The Intelligent Investor
  • The Richest Man in Babylon
  • Think and Trade Like a Champion
  • Value Investing and Behavioural Finance
  • Trading in the Zone
  • Learn to Earn
  • Book Summaries:
  • Rich Dad Poor Dad
  • Psychology of Money
  • The Intelligent Investor
  • The Richest Man in Babylon
  • Think and Trade Like a Champion
  • Value Investing and Behavioural Finance
  • Trading in the Zone
  • Learn to Earn
  • Tools:
  • CAGR Calculator
  • SIP Calculator
  • eLearnOptions
  • Future Value Calculator
  • Present Value Calculator
  • Atal Pension Yojana
  • Cost of Delay Calculator
  • Become a Crorepati
  • Tools:
  • CAGR Calculator
  • SIP Calculator
  • eLearnOptions
  • Future Value Calculator
  • Present Value Calculator
  • Atal Pension Yojana
  • Cost of Delay Calculator
  • Become a Crorepati

© 2023 Elearnmarkets. All Rights Reserved

  • Visit Elearnmarkets
  • Courses
  • Webinars
  • Financial Guides
  • Get Free Counselling
  • Visit Elearnmarkets
  • Courses
  • Webinars
  • Financial Guides
  • Get Free Counselling

Get Elearnmarkets App

No Result
View All Result
  • Article Categories
    • Basic Finance
    • Derivatives
    • Financial Planning
    • Fundamental Analysis
    • Technical Analysis
    • Marketshala
    • Miscellaneous
  • Language
    • Hindi
    • Bengali
    • English
  • Courses
  • Webinars
  • Stories

© 2020 Elearnmarkets All Rights Reserved