Elearnmarkets - Financial Market Learning
  • Categories
    • Basic Finance
    • Derivatives
    • Financial Planning
    • Fundamental Analysis
    • Technical Analysis
    • Marketshala
    • Miscellaneous
  • Language
    • English
    • Hindi
    • Bengali
No Result
View All Result
  • Courses
  • Webinars
  • Learn On Elearnmarkets
Elearnmarkets - Learn Stock Market, trading, investing for Free
No Result
View All Result
Home Technical Analysis Market Analysis
Nifty Hourly Chart

Nifty Closes Near Its Lifetime High, A Bearish Candle In Overbought Area

Elearnmarkets by Elearnmarkets
November 18, 2020
in Market Analysis, Market Wrap
Reading Time: 3 mins read
0
163
VIEWS
Share on FacebookShare on TwitterShare on WhatsApp

Nifty close 11429.50: Index this week ends in a negative note. A bearish candle in the overbought level. However, Index climbed up approximately 70 points this week. Index reacted with bad company results and other macro factors.

In the weekly chart we can see candles size are getting smaller and Nifty forms an indecision candle in the overbought level. It is obvious that it does not mean trend reversal but the Nifty likely to take a halt next week. There is another important psychological factor may take place which is 11500 level, if Nifty able to close above this level we may expect another up move, in case of support 11350 is going to be the major support zone for the index.


Hourly Technical:The hourly chart of Nifty suggesting it is in a support level and a gap up opening in the next trading session may take the Index’s price higher. 11350 to 11375 zone will be the important level for the index and as mentioned earlier 11500 will act as key resistance for the upcoming trading sessions.

Let’s discuss the indicators, RSI is below 50, Stochastic is in the oversold level, ADX is below 20 and the CCI is below -100.

In the hourly chart Indicators are suggesting the index is in the support level and another up move may take place. However, the index has lost the momentum and the strength so how much it would be able to climb up it is questionable.
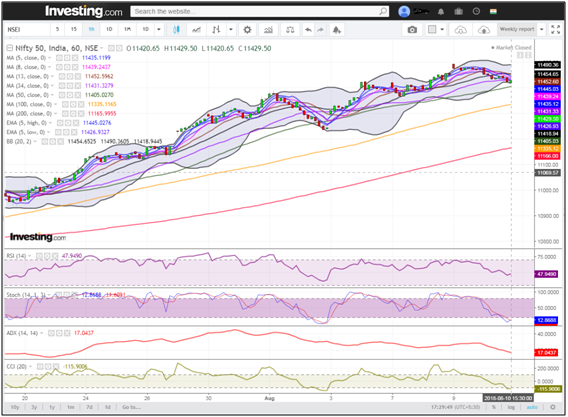
Join TMP Join TMP Join TMP

 Hourly Chart
(Hourly chart)
Daily Technical:  As we can see in the daily chart that the Index has formed a red candle while the indicator RSI and Stochastic being in the overbought level. The index closed just above the MA 5 line (presently at approx. 11425.35) and it is acting as a short term support. There is also a chance to witness a indecision candle or a small bearish candle in the daily chart for the next trading session however, in case of any downside MA lines will act.

Next level for the index will be 11500 level which is near its last swing high, and for support 11350 level is going to be the latest support.

Most of the indicators are in the overbought level RSI is just below the 70 line, Stochastic is above 90, ADX is above 40 and the CCI indicator is just below its 100 level.

Overall, Indicators are suggesting that there is a chance for little correction after this 900 points(approximately) rally. However, in case of downfall we will have the support of 8MA (presently at approx. 11384) and  mid Bollinger line (presently at approx.. 11222)
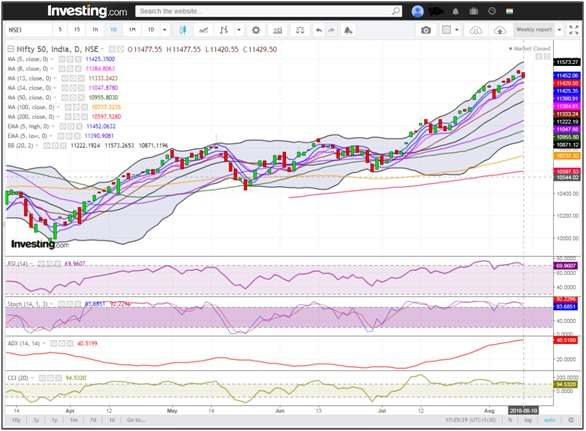
Daily Chart

(Daily chart)

Weekly Technical:Nifty has formed a Doji candle in the weekly chart so there is indecision in the market. 11500 is a psychological resistance level and we have seen that the index went up to 11492(approximate) level.  It can be assumed that profit booking can take place. Due to this there is a chance for correction. In the weekly chart 11100 level is going to be an important support level. Another important factor is that the index has closed above upper line of the Bollinger Band (Presently at approx.. 11409) and from the past behaviour of the index, we can decipher it will try to give a close within the band.

In the weekly chart, Indicators are suggesting that index is trading at its overbought level. RSI is above 70, Stochastic is above 90, CCI is above 190 and ADX is about to cross 20 level.

So overall, a correction is expected from the upcoming trading sessions. In case of uptrend, closing above 11500 level may create attention of the investors.
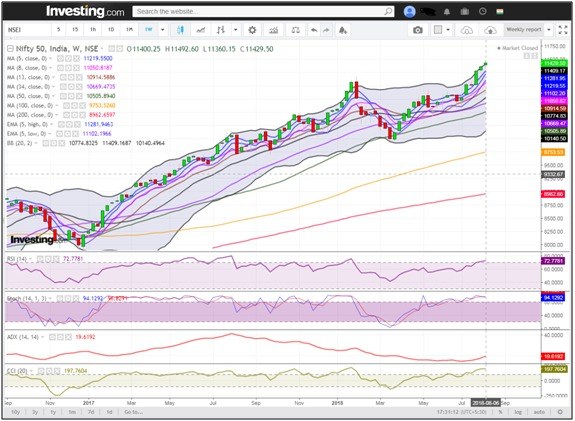
 Weekly Chart

(Weekly chart)
You can use stockedge app to get cutting edge over others in both short term trading and investing. Here you not only get data at one particular place but can also create your own combination scans based on your own technical and fundamental parameter. See the video below to know about various features in Stockedge app.

Technical Chart

Technical Chart

Tags: english
ShareTweetSend
Previous Post

Credit Default Swaps in the Indian Financial Markets

Next Post

How to use Open Interest Strategy to increase profitability?

Elearnmarkets

Elearnmarkets

Elearnmarkets (ELM) is a complete financial market portal where the market experts have taken the onus to spread financial education. ELM constantly experiments with new education methodologies and technologies to make financial education effective, affordable and accessible to all. You can connect with us on Twitter @elearnmarkets.

Related Posts

Hourly Chart
Market Analysis

Nifty Ends on Positive Note, Gains Approx. 475 Points on Positive Global Factors

November 18, 2020
378
Weekly Chart
Market Analysis

Huge Sell-Off Makes the Market Close in a Negative Note on the Expiry Week

November 18, 2020
175
Hourly Chart
Market Analysis

Nifty Ends in Green. Rupee Appreciates and Falling Crude Price Helped the Market to Recover Approx. 140 Point

November 18, 2020
129
Hourly Chart
Market Analysis

Sell Off Continues. Nifty Ends The Week With Three Consecutive Red Candles

November 18, 2020
141

Leave a Reply Cancel reply

Your email address will not be published. Required fields are marked *

Follow Us

Facebook-f Twitter Instagram Linkedin-in Youtube Telegram

Register on Elearnmarkets

Continue your financial learning by creating your own account on Elearnmarkets.com

Register Free Account

Download App

Categories

  • Basic Finance
  • Derivatives
  • Financial Planning
  • Fundamental Analysis
  • Technical Analysis
  • Marketshala
  • Miscellaneous

Popular On Elearnmarkets

  • Market Superheroes:
  • Vivek Bajaj
  • Chetan Panchamia
  • Ashish Kyal
  • Premal Parekh
  • Abhijit Paul
  • Jegan
  • Sivakumar Jayachadran
  • Vishal Malkan
  • Jyoti Budhia
  • Vivek Gadodia
  • Vishal Mehta
  • Piyush Chaudhry
  • Santosh Pasi
  • Gomathi Shankar
  • Market Superheroes:
  • Vivek Bajaj
  • Chetan Panchamia
  • Ashish Kyal
  • Premal Parekh
  • Abhijit Paul
  • Jegan
  • Sivakumar Jayachadran
  • Vishal Malkan
  • Jyoti Budhia
  • Vivek Gadodia
  • Vishal Mehta
  • Piyush Chaudhry
  • Santosh Pasi
  • Gomathi Shankar
  • Courses:​
  • Options Trading
  • Dow Theory
  • Momentum Trading
  • Stock Investing
  • Stock Market for Beginners
  • Harmonic Chart Patterns
  • Algo Trading
  • Elliot Wave Theory
  • Advanced Excel
  • Cryptocurrency
  • NSE Certification Course
  • Courses:​
  • Options Trading
  • Dow Theory
  • Momentum Trading
  • Stock Investing
  • Stock Market for Beginners
  • Harmonic Chart Patterns
  • Algo Trading
  • Elliot Wave Theory
  • Advanced Excel
  • Cryptocurrency
  • NSE Certification Course
  • Webinars:
  • Bank Nifty Scalping
  • Intraday Trading Strategies
  • Options Trading Strategies
  • Options selling
  • Price Action
  • Relative Strength
  • Tax Planning
  • Options Buying
  • Growth Stocks
  • Portfolio Management
  • Relative Strength Index
  • Risk Management
  • Renko Charts
  • Crude Oil
  • Traders Psychology
  • Moving Average
  • Multibagger Stocks
  • Free Learning Modules:
  • Intraday Trading
  • Options Scalping
  • Swing Trading
  • Financial Modelling
  • RSI Indicator
  • Bollinger Bands
  • Pricing of Futures
  • Personal Finance
  • Initial Public Offerings (IPO)
  • Value Investing
  • Technical Indicators
  • Candlesticks
  • Chart Patterns
  • Option Greeks
  • ELSS Funds
  • Banking and Insurance
  • Real Estate
  • Gold
  • Book Summaries:
  • Rich Dad Poor Dad
  • Psychology of Money
  • The Intelligent Investor
  • The Richest Man in Babylon
  • Think and Trade Like a Champion
  • Value Investing and Behavioural Finance
  • Trading in the Zone
  • Learn to Earn
  • Book Summaries:
  • Rich Dad Poor Dad
  • Psychology of Money
  • The Intelligent Investor
  • The Richest Man in Babylon
  • Think and Trade Like a Champion
  • Value Investing and Behavioural Finance
  • Trading in the Zone
  • Learn to Earn
  • Tools:
  • CAGR Calculator
  • SIP Calculator
  • eLearnOptions
  • Future Value Calculator
  • Present Value Calculator
  • Atal Pension Yojana
  • Cost of Delay Calculator
  • Become a Crorepati
  • Tools:
  • CAGR Calculator
  • SIP Calculator
  • eLearnOptions
  • Future Value Calculator
  • Present Value Calculator
  • Atal Pension Yojana
  • Cost of Delay Calculator
  • Become a Crorepati

© 2023 Elearnmarkets. All Rights Reserved

  • Visit Elearnmarkets
  • Courses
  • Webinars
  • Financial Guides
  • Get Free Counselling
  • Visit Elearnmarkets
  • Courses
  • Webinars
  • Financial Guides
  • Get Free Counselling

Get Elearnmarkets App

No Result
View All Result
  • Article Categories
    • Basic Finance
    • Derivatives
    • Financial Planning
    • Fundamental Analysis
    • Technical Analysis
    • Marketshala
    • Miscellaneous
  • Language
    • Hindi
    • Bengali
    • English
  • Courses
  • Webinars

© 2020 Elearnmarkets All Rights Reserved

Suggested Learning

Technical Analysis Made Easy

Certification in Online Technical Analysis

Online NSE Academy Certified Capital Market Professional (E-NCCMP)