Nifty close 10096.4 : Nifty after taking support from 200 Hour moving average in the very first hour (presently at approx. 9981.7), it moved gradually higher in today’s session. As mentioned in yesterday’s report, it bounced from the first level of support which was basically a make or break level for Nifty.
Hourly Technical:
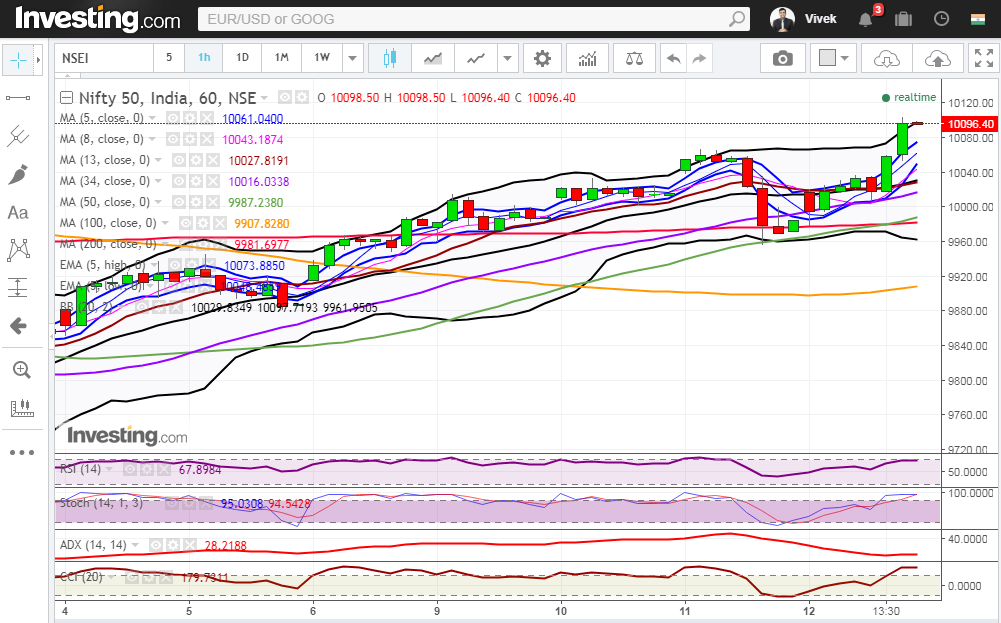
In the Hourly chart, Nifty took support from the 200 Hour moving average and saw a strong bounce back signalling the control of the bulls. The probable support in the hourly chart comes at 5 Hour moving average (presently at approx. 10061), 8 Hour moving average (presently at approx. 10043.2) and 34 Hour moving average (presently at approx. 10016).
On the upside, Nifty may face resistance at all time high of 10180.
Stochastic and CCI are in the overbought zone while RSI is very close to the upper bound of the normal zone. ADX have turned up indicating gain of momentum. Overall Nifty remains bullish in the Hourly chart.
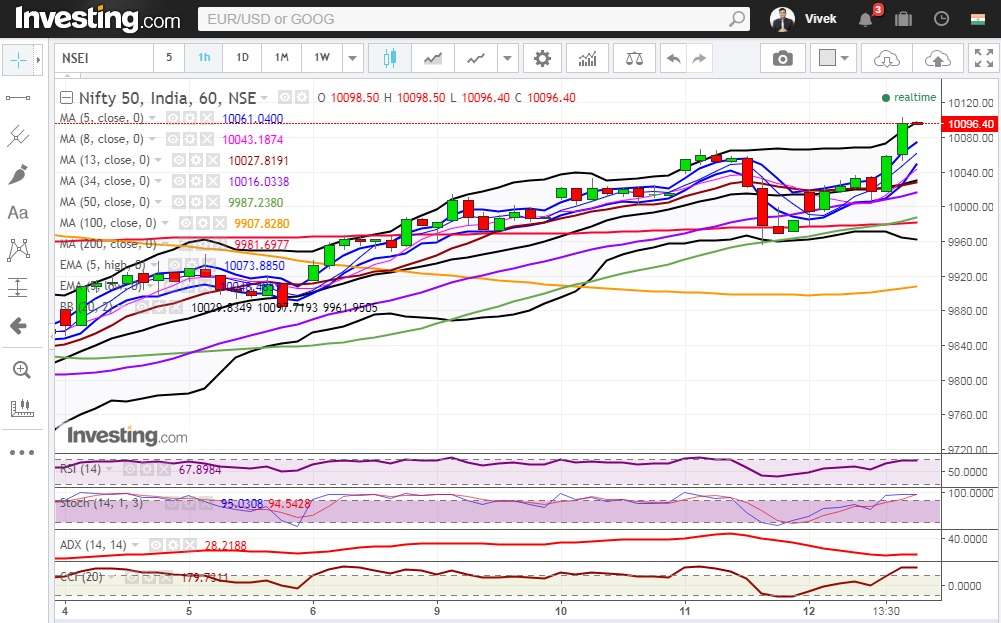
Figure: Hourly Chart
Daily Technical:
Similarly in the daily chart, Nifty took support from 20 DMA (presently at approx. 9973.4) and closed almost at today’s high. Moreover, Nifty has closed above 5 Day High EMA (presently at approx. 10045.2) and also above most moving average which is a positive sign in the daily chart.
The probable support in the daily chart comes at 5 Day High EMA (presently at approx. 10045.2), 5 DMA (presently at approx.10013.3) and 20 DMA (presently at approx.9973.4).
On the upside, Nifty may face resistance at upper Bollinger line (presently at approx.10231.1).
Daily CCI, RSI and Stochastic are very close to their respective upper bound. Overall Nifty remains bullish to neutral in the Daily chart.
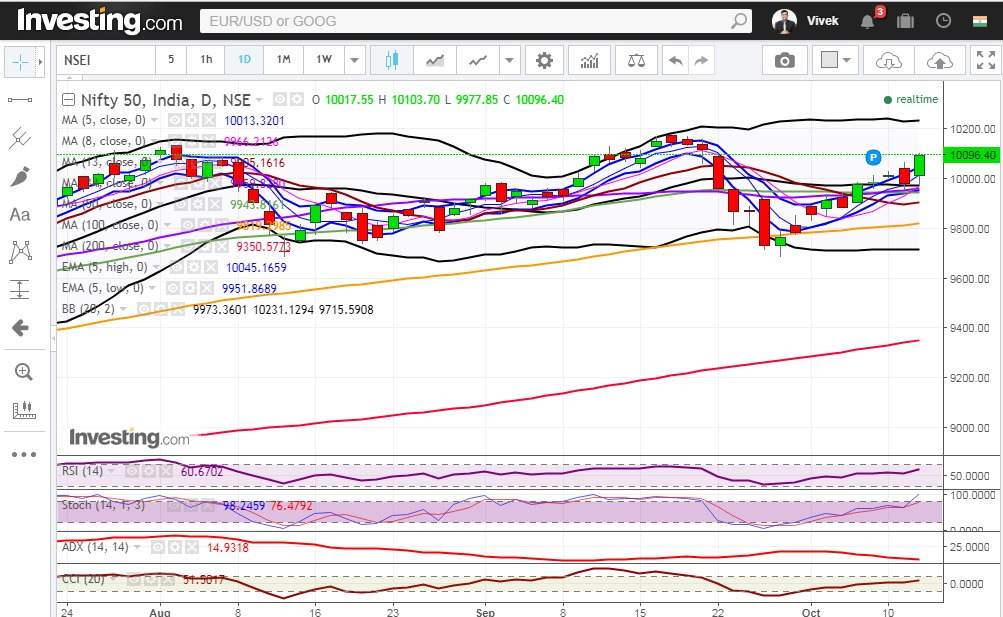
Figure: Daily Chart
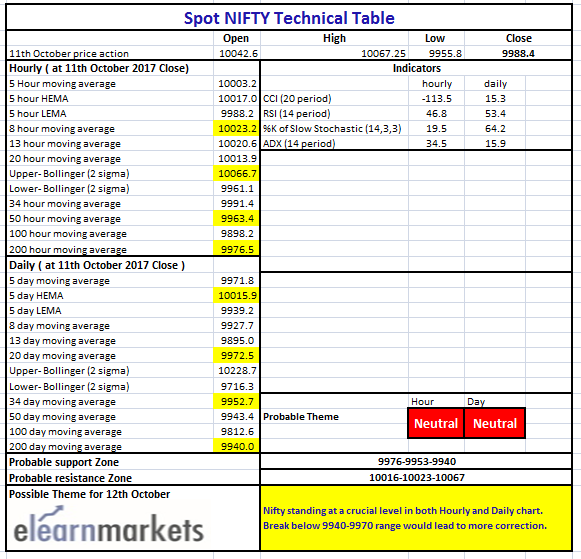
Figure: Tech Table


