Elearnmarkets - Financial Market Learning
  • Categories
    • Basic Finance
    • Derivatives
      • Futures
      • Options
    • Financial Planning
    • Fundamental Analysis
    • Technical Analysis
    • Marketshala
    • Miscellaneous
  • Language
    • English
    • Hindi
    • Bengali
No Result
View All Result
  • Courses
  • Webinars
  • Stories
Elearnmarkets - Learn Stock Market, trading, investing for Free
No Result
View All Result
Home Technical Analysis

Meet the Doji (s) : Dragonfly and Gravestone

Elearnmarkets by Elearnmarkets
August 29, 2023
in Technical Analysis, Charts, Patterns & Indicators
Reading Time: 5 mins read
0
4.8k
VIEWS
Share on FacebookShare on XShare on WhatsApp

Bestowed with catchy names these Doji candlestick patterns have important messages to deliver.

Before we get into specifications, let’s understand what is a Doji.

DOJI
DOJI

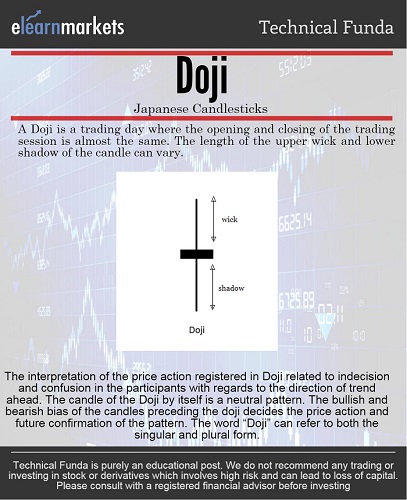
A Doji is a candlestick with no real body.

Also Read: All you need to know about the Japanese Candlestick

This means it has the same closing and opening price for the trading period under consideration.

It resembles confusion and indecision in the market.

The same has been depicted in the above info-graph with some additional information.

What is important to keep in mind when looking at a Doji is- it is not a trend reversal pattern.

RelatedPosts

5 Important Volatility Indicators that Traders should know 3

5 Important Volatility Indicators that Traders should know

September 19, 2023
58k
Top 5 Momentum Indicators that Analyses Trend Strength 4

Top 5 Momentum Indicators that Analyses Trend Strength

September 7, 2023
93.4k
5 important roles of Relative Strength Index (RSI) 5

5 important roles of Relative Strength Index (RSI)

September 11, 2023
41.4k

It is a neutral pattern which may or may not result in a trend reversal.

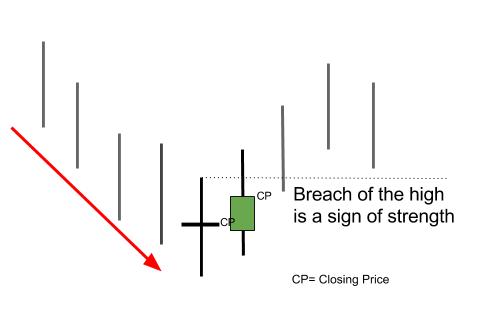
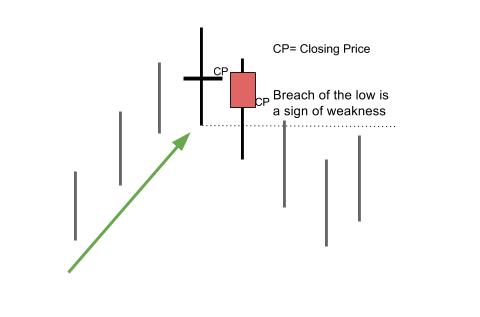
It is important to take note of the next day’s Closing Price and the High (if the Doji occurs after a downtrend) and Low (if the doji occurs after an uptrend) of the candle to determine the trend continuation/change after the appearance of the doji.

Want to learn more about Dojis? Enroll in NSE Academy Certified Technical Analysis course on Elearnmarkets.

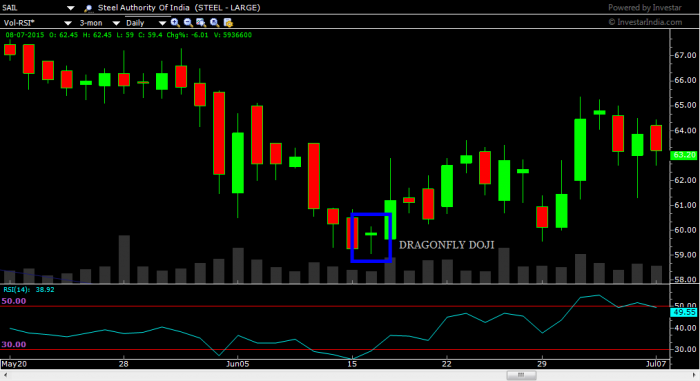
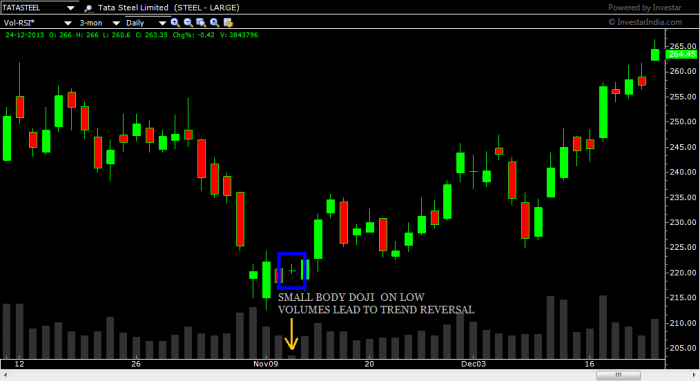
As evident on the images, in case a doji occurs after a downtrend, breach of the high of the Doji and a better close can lead the trend to reverse and continue upward at least for a few trading sessions.

Similarly, if the Doji occurs after an uptrend then a breach of its low with a poorer closing will lead to at least a few down trading sessions.

Doji occurring after an downtrend
Doji occurring after a downtrend
Doji occurring after an uptrend

So far we have understood that a doji is formed when the opening and closing are same.

Now, what if the high or the low join this party?

Then we have a Dragonfly or Gravestone Doji respectively.

Meet the Doji (s) : Dragonfly and Gravestone 1
GRAVESTONE DOJI

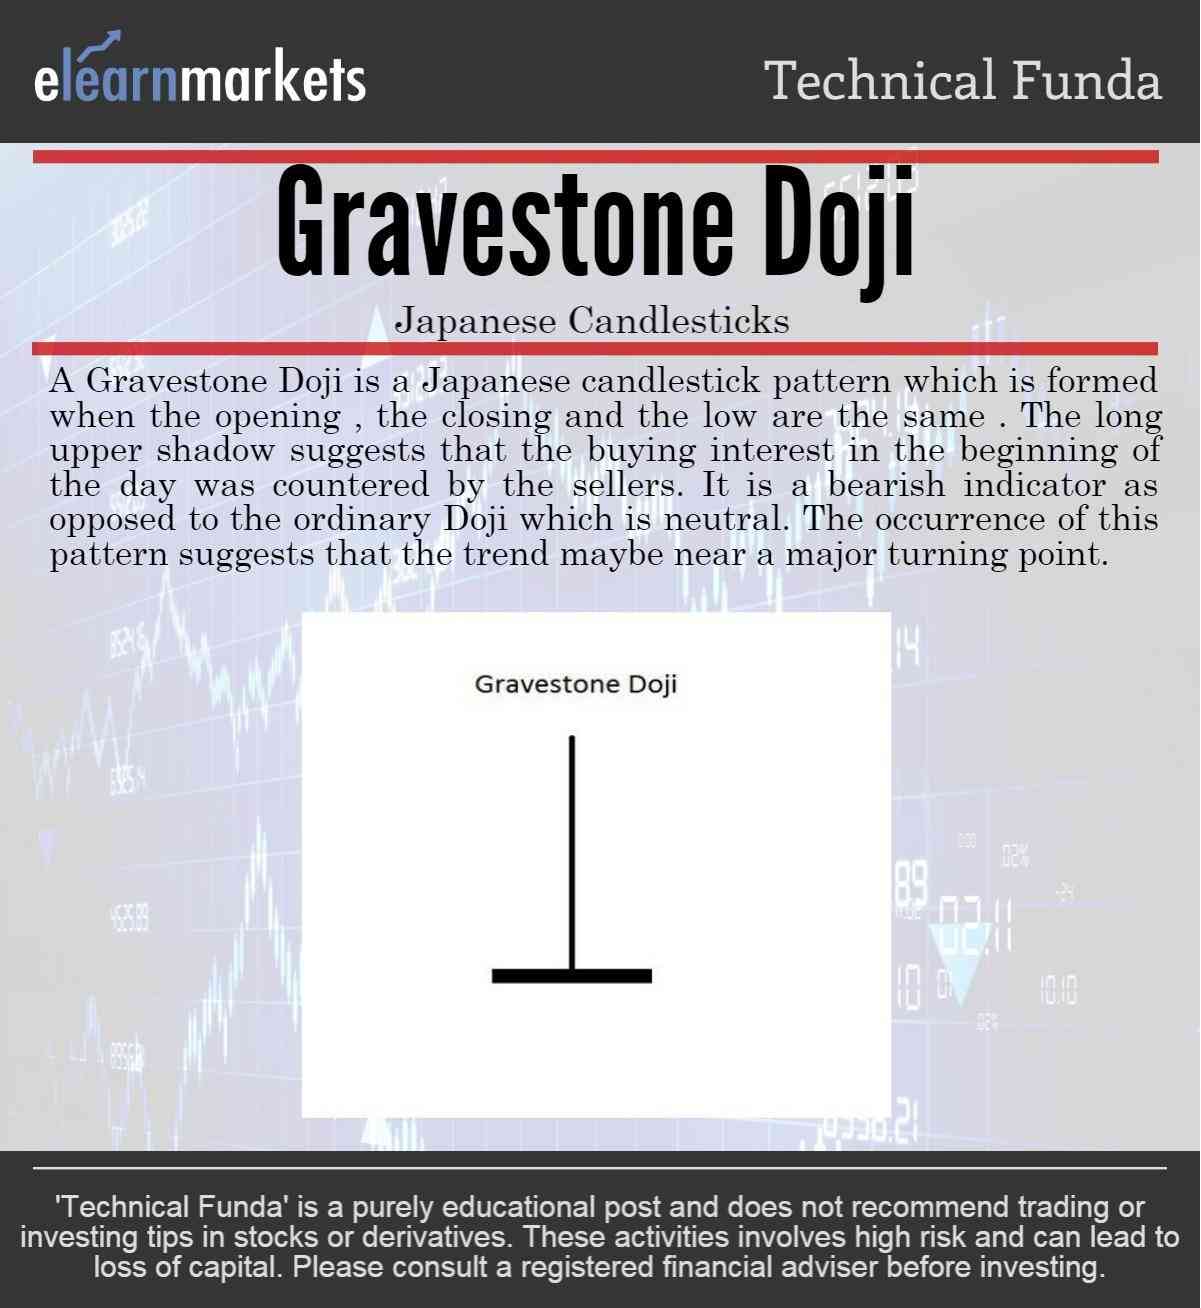
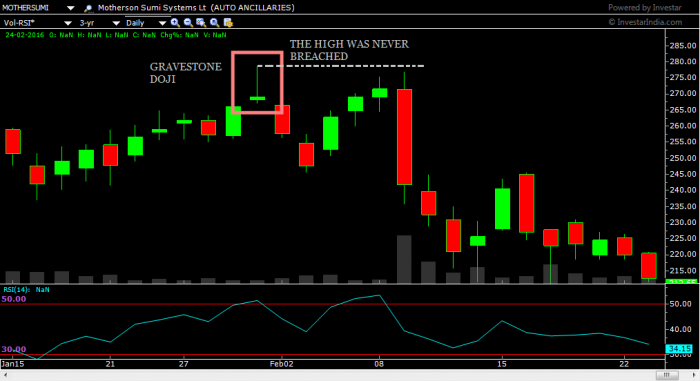
A Gravestone Doji is formed when the prices open and shoot higher instantly indicating new buying interest and strong bulls , but as the day comes to an end, the buying interest not just diminished but profit booking takes the prices back to the low or the opening price and finally closing where it opening, at or near the low.

The upper wick is very long but it has a very small lower shadow or ideally no lower shadow at all.

DRAGONFLY DOJI
DRAGONFLY DOJI

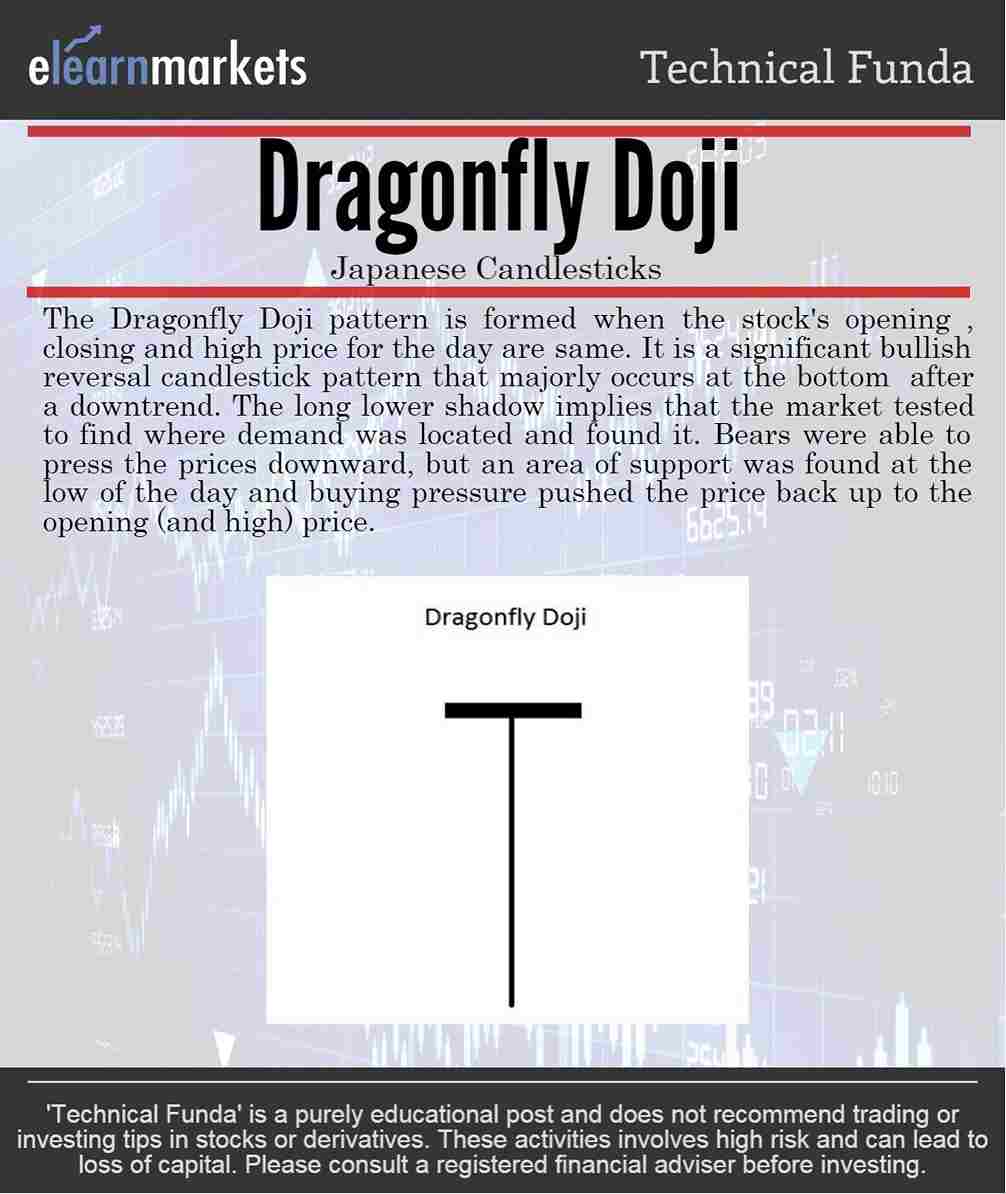
Whereas a Dragonfly Doji is formed when the prices open and heavy selling drags the price lower and lower until the selling vaporizes and the prices are low enough such that fresh buying interest and short covering take the prices higher and back to the opening price near the high.

There is a long lower shadow but barely a wick.

Ideally, there is no wick at all in a Dragonfly Doji.

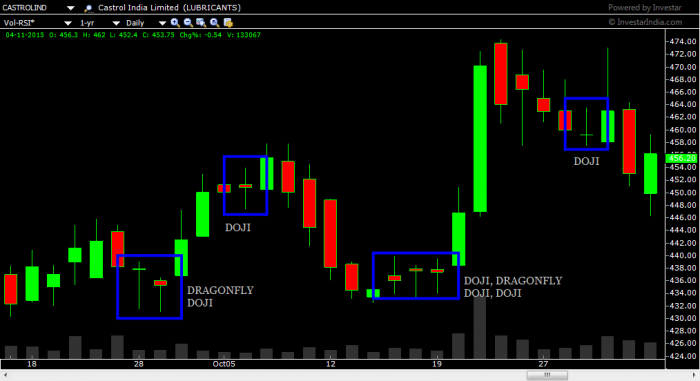
In the graphs givens below, you will find real appearances of the Doji and its variants.

Closely observe the instances when trend corrected for a few days and when there was no change in the price momentum whatsoever.

MOTHERSUN SUMI chart showing a GRAVESTONE DOJI
Meet the Doji (s) : Dragonfly and Gravestone 2
NIFTY chart showing doji pattern and trend changes there after
SAIL shows DRAGONFLY DOJI
TATASTEEL shows a trend reversal after DOJI

Bottomline:

We hope that the above write up has helped you to grasp the concept of Dragonfly and Gravestone Doji Patterns in a better manner.

Feel free to give us your feedback by writing in the comment box below.

Happy Learning!!

Tags: Dojidragonfly dojienglishgravestone dojimothersun suminiftysail
ShareTweetSend
Get Kotak Offer Get Kotak Offer Get Kotak Offer
Previous Post

Margin of safety matters!

Next Post

Market Wrap for 24th Feb, 2016: Nifty extends losing streak, Niftyit and BankNifty join the parade

Elearnmarkets

Elearnmarkets

Elearnmarkets (ELM) is a complete financial market portal where the market experts have taken the onus to spread financial education. ELM constantly experiments with new education methodologies and technologies to make financial education effective, affordable and accessible to all. You can connect with us on Twitter @elearnmarkets.

Related Posts

5 Important Volatility Indicators that Traders should know 6
Technical Analysis

5 Important Volatility Indicators that Traders should know

September 19, 2023
58k
Top 5 Momentum Indicators that Analyses Trend Strength 7
Technical Analysis

Top 5 Momentum Indicators that Analyses Trend Strength

September 7, 2023
93.4k
5 important roles of Relative Strength Index (RSI) 8
Technical Analysis

5 important roles of Relative Strength Index (RSI)

September 11, 2023
41.4k
NR4 and NR7 Trading Strategy Setup 9
Technical Analysis

NR4 and NR7 Trading Strategy Setup

September 14, 2023
82.5k

Leave a Reply Cancel reply

Your email address will not be published. Required fields are marked *

Elearnmarkets Logo

Follow Us

Facebook-f Twitter Instagram Linkedin-in Youtube Telegram

Register on Elearnmarkets

Continue your financial learning by creating your own account on Elearnmarkets.com

Register Free Account

Download App

Playstore logo
Download on app store

Categories

  • Basic Finance
  • Derivatives
  • Financial Planning
  • Fundamental Analysis
  • Technical Analysis
  • Marketshala
  • Miscellaneous

Popular On Elearnmarkets

  • Market Superheroes:
  • Vivek Bajaj
  • Chetan Panchamia
  • Ashish Kyal
  • Premal Parekh
  • Abhijit Paul
  • Jegan
  • Sivakumar Jayachadran
  • Vishal Malkan
  • Jyoti Budhia
  • Vivek Gadodia
  • Vishal Mehta
  • Piyush Chaudhry
  • Santosh Pasi
  • Gomathi Shankar
  • Market Superheroes:
  • Vivek Bajaj
  • Chetan Panchamia
  • Ashish Kyal
  • Premal Parekh
  • Abhijit Paul
  • Jegan
  • Sivakumar Jayachadran
  • Vishal Malkan
  • Jyoti Budhia
  • Vivek Gadodia
  • Vishal Mehta
  • Piyush Chaudhry
  • Santosh Pasi
  • Gomathi Shankar
  • Courses:​
  • Options Trading
  • Dow Theory
  • Momentum Trading
  • Stock Investing
  • Stock Market for Beginners
  • Harmonic Chart Patterns
  • Algo Trading
  • Elliot Wave Theory
  • Advanced Excel
  • Cryptocurrency
  • NSE Certification Course
  • Courses:​
  • Options Trading
  • Dow Theory
  • Momentum Trading
  • Stock Investing
  • Stock Market for Beginners
  • Harmonic Chart Patterns
  • Algo Trading
  • Elliot Wave Theory
  • Advanced Excel
  • Cryptocurrency
  • NSE Certification Course
  • Webinars:
  • Bank Nifty Scalping
  • Intraday Trading Strategies
  • Options Trading Strategies
  • Options selling
  • Price Action
  • Relative Strength
  • Tax Planning
  • Options Buying
  • Growth Stocks
  • Portfolio Management
  • Relative Strength Index
  • Risk Management
  • Renko Charts
  • Crude Oil
  • Traders Psychology
  • Moving Average
  • Multibagger Stocks
  • Free Learning Modules:
  • Intraday Trading
  • Options Scalping
  • Swing Trading
  • Financial Modelling
  • RSI Indicator
  • Bollinger Bands
  • Pricing of Futures
  • Personal Finance
  • Initial Public Offerings (IPO)
  • Value Investing
  • Technical Indicators
  • Candlesticks
  • Chart Patterns
  • Option Greeks
  • ELSS Funds
  • Banking and Insurance
  • Real Estate
  • Gold
  • Book Summaries:
  • Rich Dad Poor Dad
  • Psychology of Money
  • The Intelligent Investor
  • The Richest Man in Babylon
  • Think and Trade Like a Champion
  • Value Investing and Behavioural Finance
  • Trading in the Zone
  • Learn to Earn
  • Book Summaries:
  • Rich Dad Poor Dad
  • Psychology of Money
  • The Intelligent Investor
  • The Richest Man in Babylon
  • Think and Trade Like a Champion
  • Value Investing and Behavioural Finance
  • Trading in the Zone
  • Learn to Earn
  • Tools:
  • CAGR Calculator
  • SIP Calculator
  • eLearnOptions
  • Future Value Calculator
  • Present Value Calculator
  • Atal Pension Yojana
  • Cost of Delay Calculator
  • Become a Crorepati
  • Tools:
  • CAGR Calculator
  • SIP Calculator
  • eLearnOptions
  • Future Value Calculator
  • Present Value Calculator
  • Atal Pension Yojana
  • Cost of Delay Calculator
  • Become a Crorepati

© 2023 Elearnmarkets. All Rights Reserved

  • Visit Elearnmarkets
  • Courses
  • Webinars
  • Financial Guides
  • Get Free Counselling
  • Visit Elearnmarkets
  • Courses
  • Webinars
  • Financial Guides
  • Get Free Counselling

Get Elearnmarkets App

No Result
View All Result
  • Article Categories
    • Basic Finance
    • Derivatives
    • Financial Planning
    • Fundamental Analysis
    • Technical Analysis
    • Marketshala
    • Miscellaneous
  • Language
    • Hindi
    • Bengali
    • English
  • Courses
  • Webinars
  • Stories

© 2020 Elearnmarkets All Rights Reserved

View Details
View Course Details
Guidebook On Chart Patterns
Take Your Trading To The Next Level With Strategies Shared In This Ebook
Download Now