Bestowed with catchy names these Doji candlestick patterns have important messages to deliver.
Before we get into specifications, let’s understand what is a Doji.
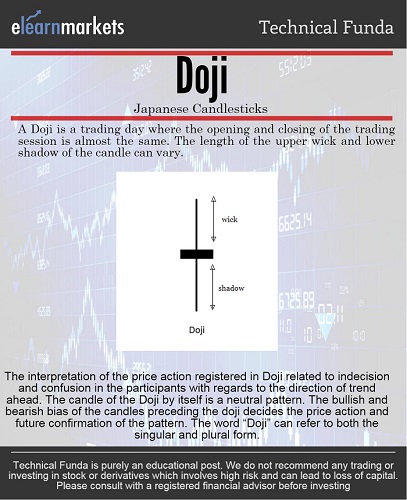
A Doji is a candlestick with no real body.
Also Read: All you need to know about the Japanese Candlestick
This means it has the same closing and opening price for the trading period under consideration.
It resembles confusion and indecision in the market.
The same has been depicted in the above info-graph with some additional information.
What is important to keep in mind when looking at a Doji is- it is not a trend reversal pattern.
It is a neutral pattern which may or may not result in a trend reversal.
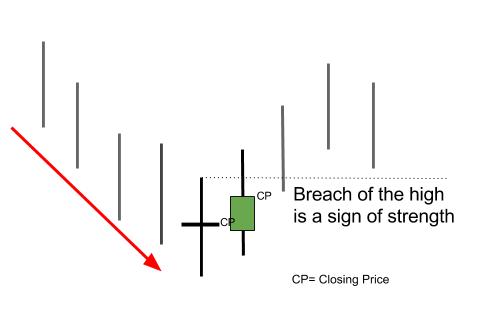
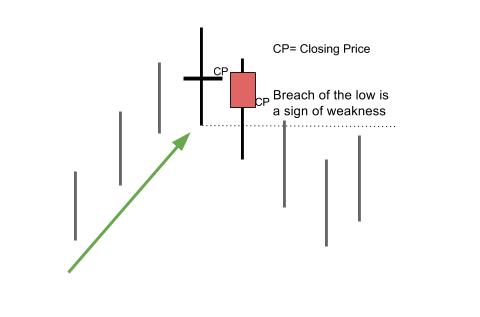
It is important to take note of the next day’s Closing Price and the High (if the Doji occurs after a downtrend) and Low (if the doji occurs after an uptrend) of the candle to determine the trend continuation/change after the appearance of the doji.
Want to learn more about Dojis? Enroll in NSE Academy Certified Technical Analysis course on Elearnmarkets.
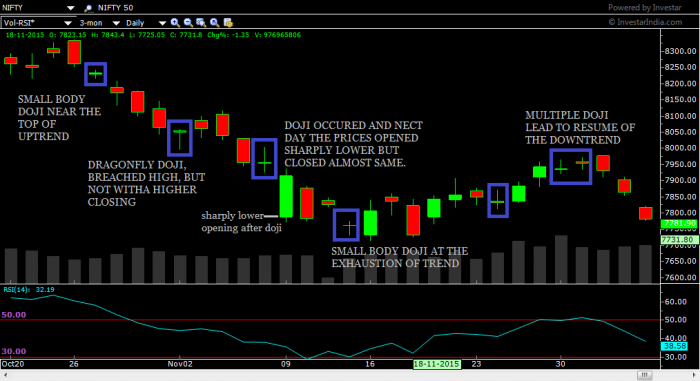
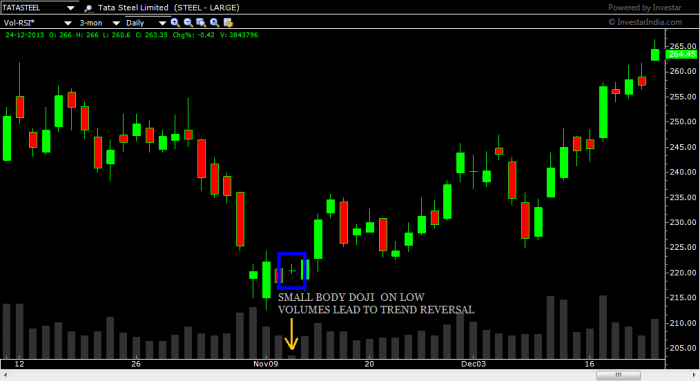
As evident on the images, in case a doji occurs after a downtrend, breach of the high of the Doji and a better close can lead the trend to reverse and continue upward at least for a few trading sessions.
Similarly, if the Doji occurs after an uptrend then a breach of its low with a poorer closing will lead to at least a few down trading sessions.
So far we have understood that a doji is formed when the opening and closing are same.
Now, what if the high or the low join this party?
Then we have a Dragonfly or Gravestone Doji respectively.
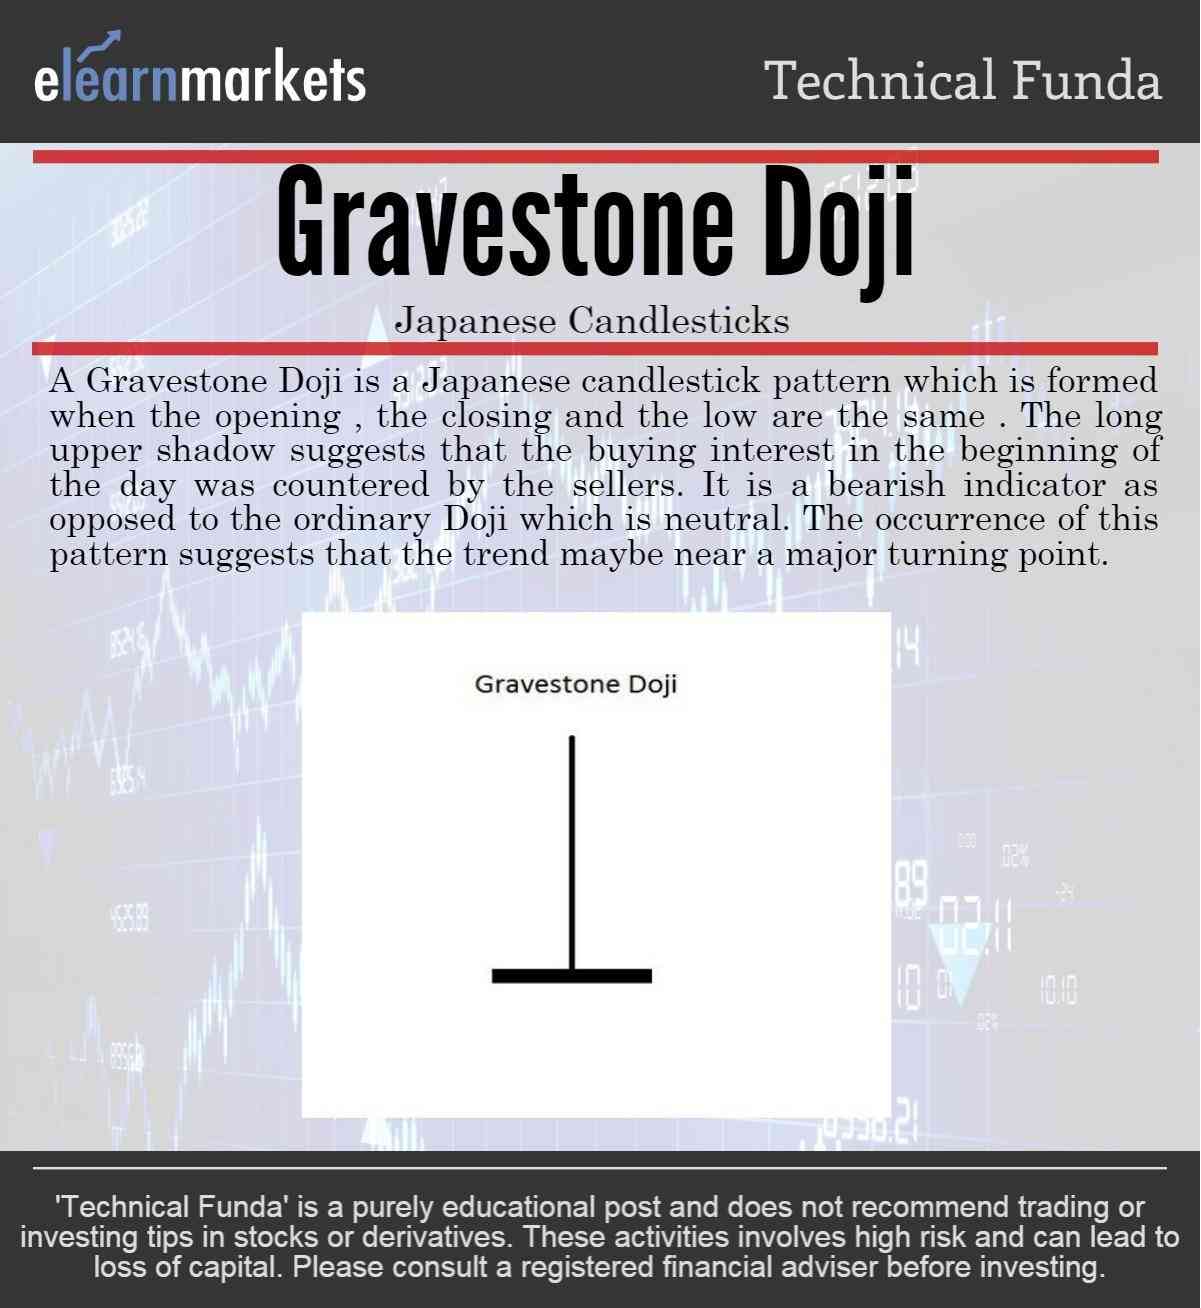
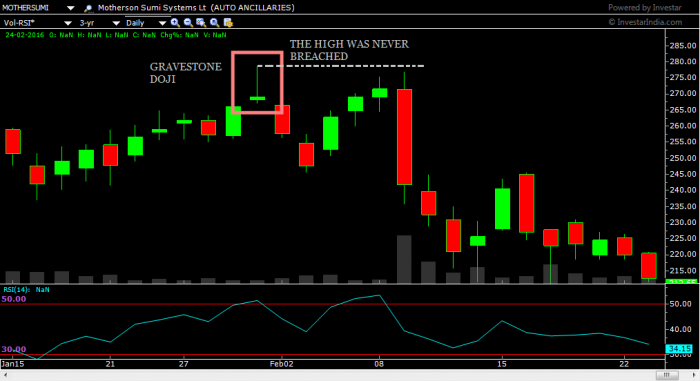
A Gravestone Doji is formed when the prices open and shoot higher instantly indicating new buying interest and strong bulls , but as the day comes to an end, the buying interest not just diminished but profit booking takes the prices back to the low or the opening price and finally closing where it opening, at or near the low.
The upper wick is very long but it has a very small lower shadow or ideally no lower shadow at all.
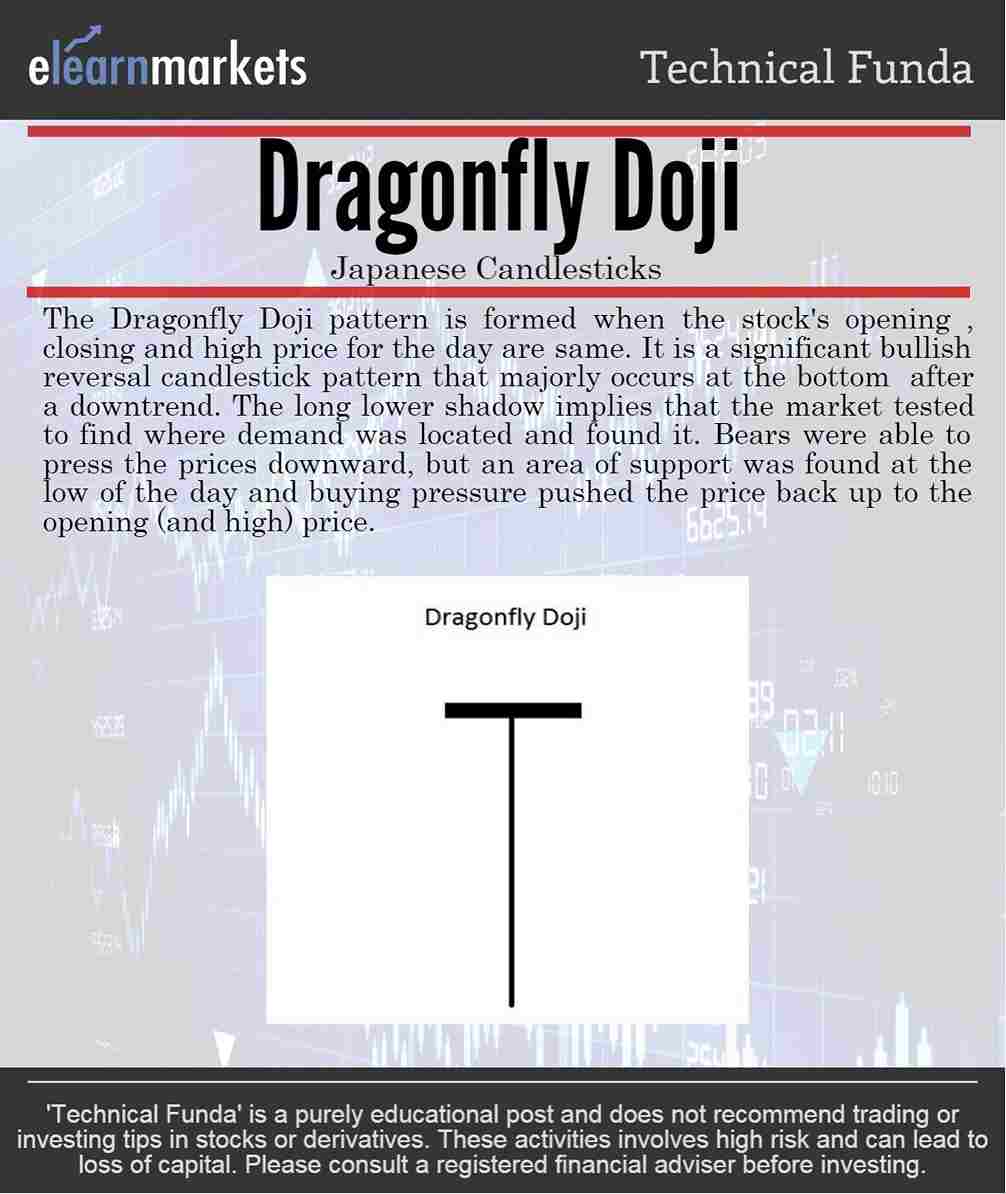
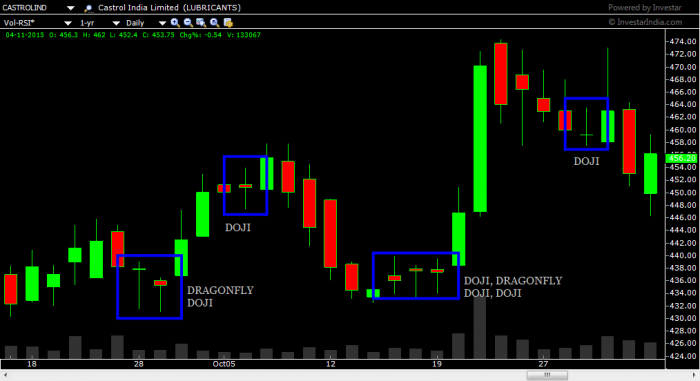
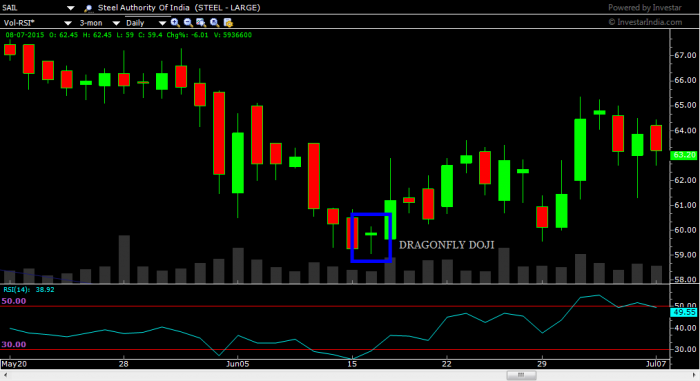
Whereas a Dragonfly Doji is formed when the prices open and heavy selling drags the price lower and lower until the selling vaporizes and the prices are low enough such that fresh buying interest and short covering take the prices higher and back to the opening price near the high.
There is a long lower shadow but barely a wick.
Ideally, there is no wick at all in a Dragonfly Doji.
In the graphs givens below, you will find real appearances of the Doji and its variants.
Closely observe the instances when trend corrected for a few days and when there was no change in the price momentum whatsoever.
Bottomline:
We hope that the above write up has helped you to grasp the concept of Dragonfly and Gravestone Doji Patterns in a better manner.
Feel free to give us your feedback by writing in the comment box below.
Happy Learning!!
