Nifty close 9964.4 : Nifty closed below its psychological 10000 mark after North Korea threat indicated another Hydrogen bomb test. Bears took total control over bulls in Friday’s session and dragged Nifty down by 1.56% (157.50 points).
Hourly Technical:
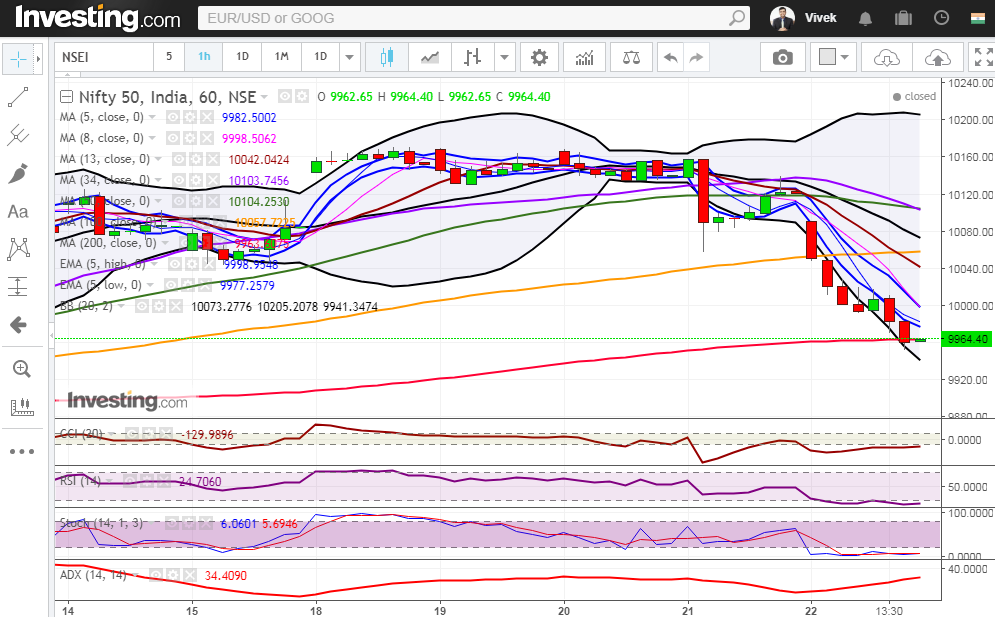
Nifty opened gap down and the fall continued throughout the day. In the Hourly chart, Nifty has closed just below 200 Hourly moving average (presently at approx. 9963.6) which is a very crucial level for Nifty; further break from here would lead to more downside.
The probable support in the hourly chart comes at lower Bollinger line (presently at approx. 9941.3).
On the upside, Nifty may face resistance at 8 Hourly moving average (presently at approx. 9998.5) and 13 Hourly moving average (presently at approx.10042).
Hourly Stochastic, RSI and CCI have entered the oversold zone and Hourly ADX has finally turned up thus indicating gain in momentum. Overall Nifty remains Bearish in Daily timeframe.
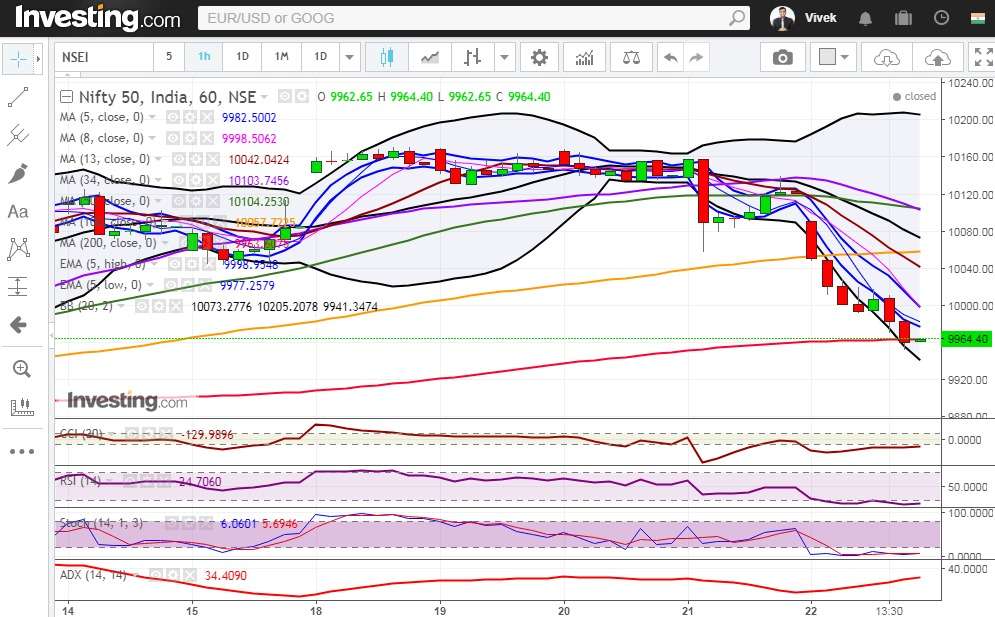
Figure: Hourly Chart
Daily Technical:
In the daily chart, Nifty has closed below 20 DMA or the mid-Bollinger line (presently at approx. 10000.5). The probable support in the daily chart comes at 34 DMA (presently at approx. 9947.5) and 50 DMA (presently at approx. 9953.9) which are the crucial levels for Nifty in the coming days.
On the upside, Nifty may face resistance at 20 DMA (presently at approx. 10000.5) and 5 Day Low EMA (presently at approx.10042.2).
Daily Stochastic, RSI and CCI have entered the respective normal zone. Daily ADX has finally turned up thus indicating loss in momentum. Overall Nifty remains Bearish in Daily timeframe.
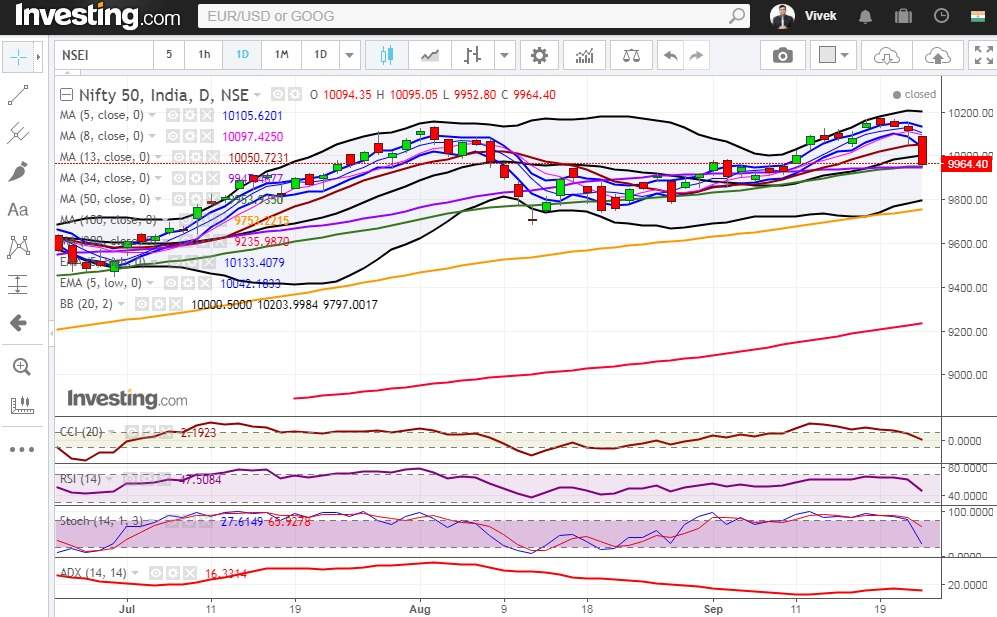
Figure: Daily Chart
Weekly Technical:
In the weekly chart, the bearish engulfing candlestick formation at the top makes the outlook neutral to bearish. Moreover, Nifty has entered the 5 EMA high-low band suggesting neutral view.
Weekly stochastic, RSI and CCI are close to the upper bound of the respective normal zone. Overall Nifty remains neutral to bearish view in the weekly timeframe.
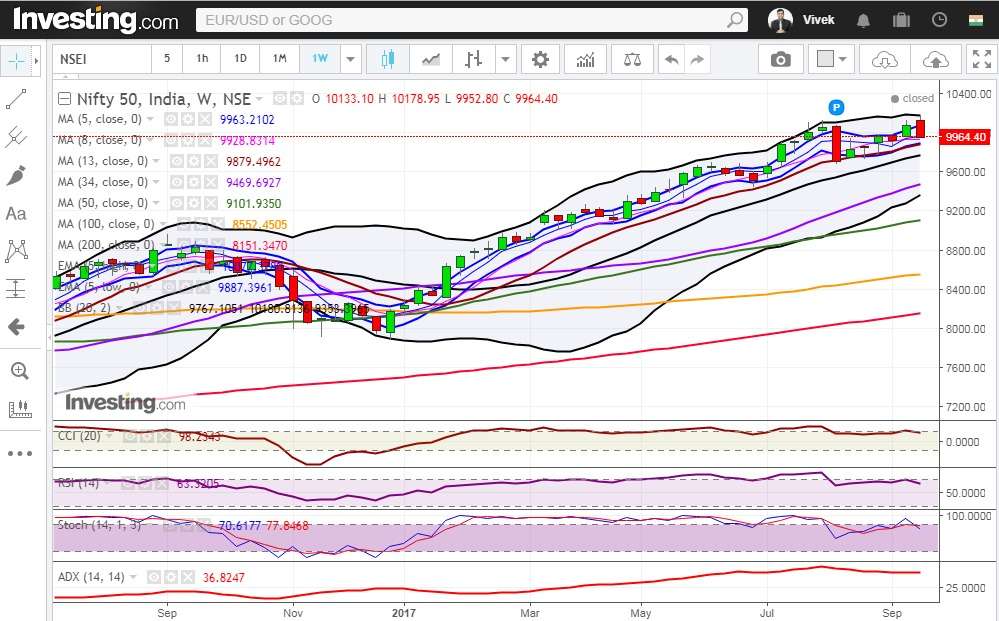
Figure: Weekly Chart

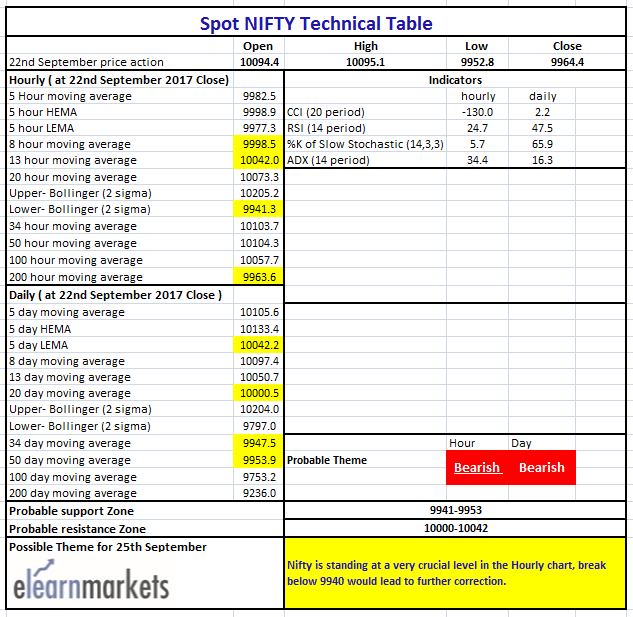
Figure: Tech Table
MSCI Data
iShares MSCI Emerging Markets (close, approx. 45.38) : The Index is still bullish in daily chart. However, CCI, RSI, slow stochastic all moving back into normal zone can be indication of fatigue.
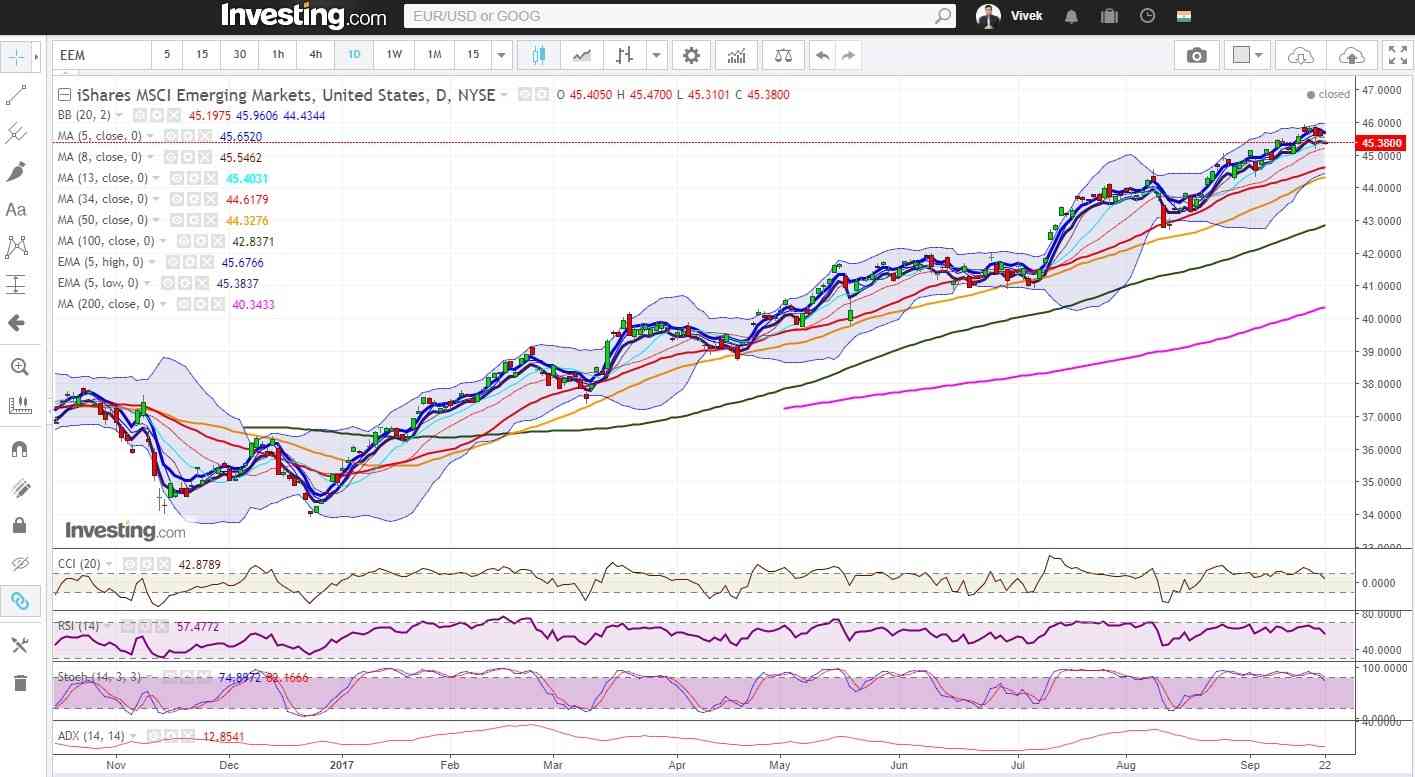
Figure: ishare MSCI Emerging Markets Daily Chart
The situation gets clearer when we look at the weekly chart. The Index is at multi-year resistance and a decisive move above 46.50 is crucial to change the scenario.
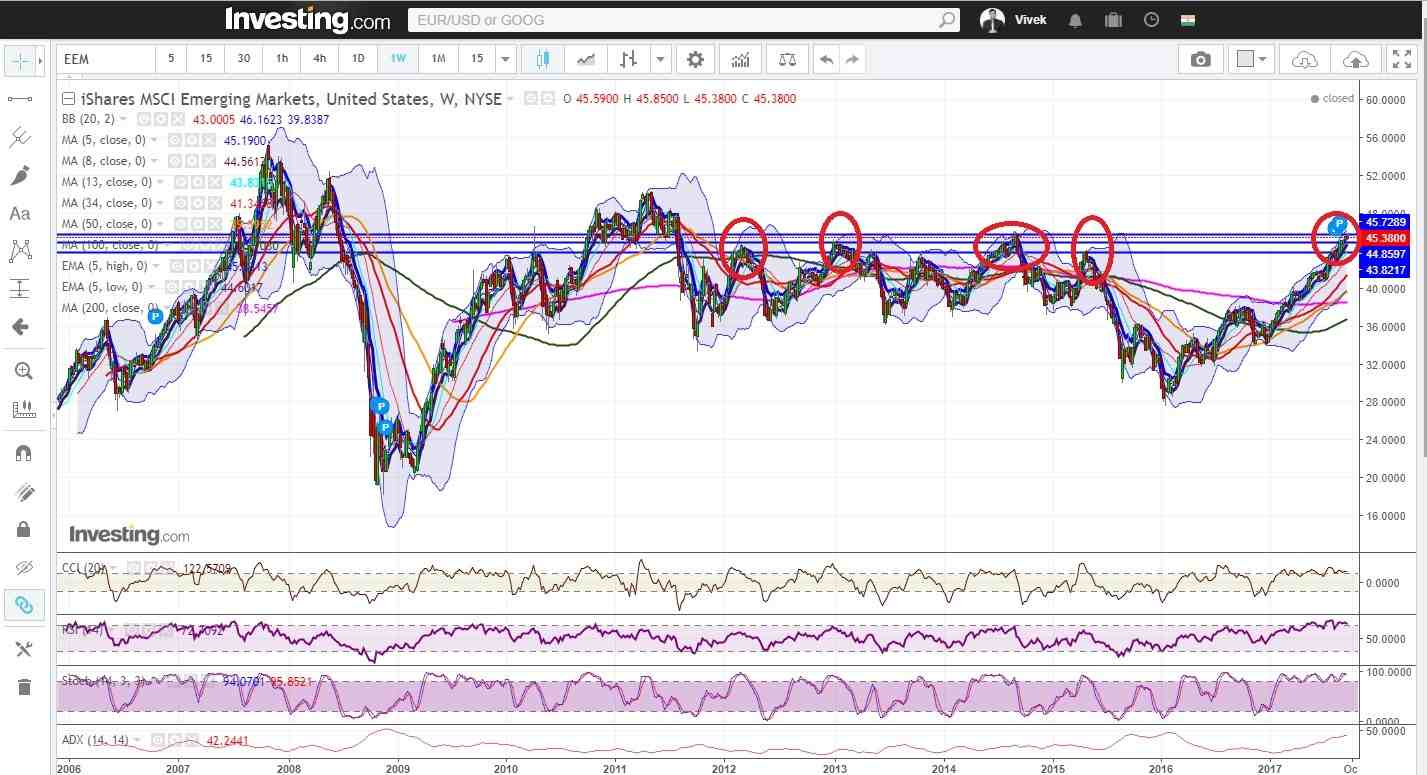
Figure: ishare MSCI Emerging Markets Weekly Chart


