Nifty posted a dull closing today, closing at 7482, forming a Doji pattern. On the indicator front we has RSI hinting at furthur weakness. Adescription of the intrday 5 min and 30 mins chart of Nifty is available in the Video attached. The zone of 7250-7320 , this zone is also the 38.20% fibonacci support.
Bank nifty was much weaker than Nifty, down 1.26% today.
The gainers- Unitech +15%, Steel stocks like Hindalco, SAIL, Jindal Steel were up 4-8% and some oil stocks.
The losers:Justdial was down 15% today after having posted gains of 20% and 15% in the last week.Other than this the banks were poor performers especially Bankof Baroda and SBIN.
The international picture was grim with the chinese Shanghai Composite closing flat, where as Hang Seng, and the European indices like FTSE 100, CAC 40 and DAX were nearly .70-1% lower.
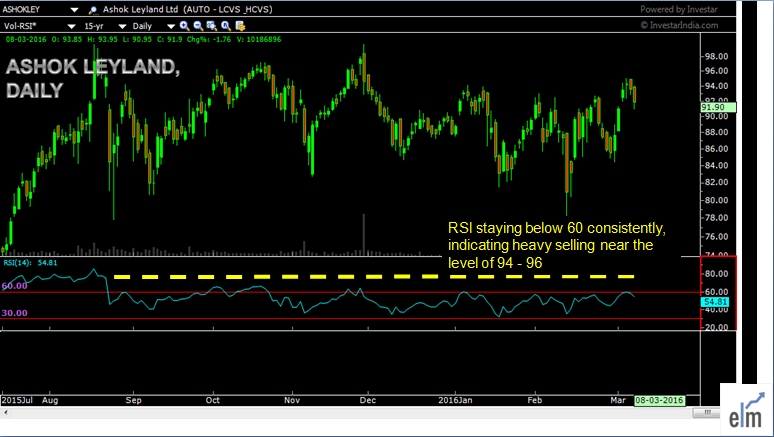
CHART OF THE DAY
Ashok Leyland has witnessed a very steady upmove in the past few months however on the weekly chart we see that the RSI has divergered and starting slipped whereas the price is in a consolidation phase. On the daily chart if we analyse the consolidation, it is evident that RSI is shy of the level of 60 and this is a cause of concern, and indicates that 94-96 is a heavy selling zone for the stock .
On an ending note i would like you to know that the government has withdrawn the taxation on EPF which is a huge relief to the salaried class.
___________________________________________________________________________________________________________________________
Read more articles here:
https://blog.elearnmarkets.com/market/nifty-chart/


