Elearnmarkets - Financial Market Learning
  • Categories
    • Basic Finance
    • Derivatives
    • Financial Planning
    • Fundamental Analysis
    • Technical Analysis
    • Marketshala
    • Miscellaneous
  • Language
    • English
    • Hindi
    • Bengali
No Result
View All Result
  • Courses
  • Webinars
  • Learn On Elearnmarkets
Elearnmarkets - Learn Stock Market, trading, investing for Free
No Result
View All Result
Home Technical Analysis Market Analysis Market Wrap

Market Wrap for 4th April, ’16: Nifty closes above 7750

Elearnmarkets by Elearnmarkets
February 26, 2020
in Market Wrap, Market Analysis
Reading Time: 2 mins read
0
41
VIEWS
Share on FacebookShare on TwitterShare on WhatsApp

Nifty has given a closing above the icy level of 7750. In order to confirm a breakout from the consolidation being witnessed at the level of 7750, nifty needs to surpass the level of 7800. On the intraday 10 mins chart of nifty, we see that the opening gap which had formed in the morning was closed during the weakness witnessed in the first half of the day , however the second half of the day was better for the index as it rallied some 50 points and closed in green with a gain of 45 points from yesterday.

On the indices  front we see that the NIfty It index was the leader with a closing of 1.80% higher followed by the Nifty Infra index. The weakest in the lot was Nifty Realty which closed 0.77% lower and the Nifty midcap 50 which was down by 0.30% almost. The bank nifty closed a mere 0.7% higher as contrary to nifty which had its foot well ahead on the positive horizon with a closing of 0.60% higher.

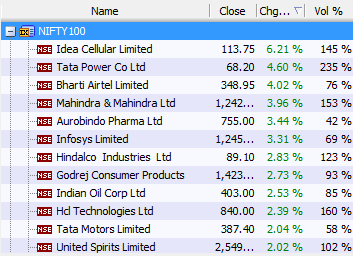
The gainers for the day has some Telecommunication names like Idea cellular and Bharti Airtel, some pharma names like Auropharma and some motors companies like M&M and TataMotors.

Winners of the day for 4th April, '16
Winners of the day for 4th April, ’16

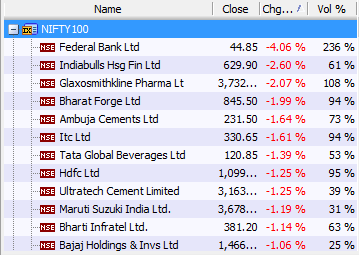
The losers on the other hand comprises of some banking stocks like Federal bank and HDFC ltd, the cigarette leader ITC and Ambuja cement.

Losers of the day for 4th April, '16
Losers of the day for 4th April, ’16

On the international front there is relatively a better sentiment being witnessed than the previous few days. The DJIA and NASDAQ futures aretrading in green as is Crude oil which is up .27%, with a red Gold , trading-0.27% lower. The US indices DOW and NASDAQ closed a good more than half poercent into the green inspite of the sharply falling european markets on friday last. The European indices however, have somewhat made up for the losses today as the trade almost a percent higher.The Asian indices, except for Nikkie and Hangseng have also closed on the stronger side with moderate gains.
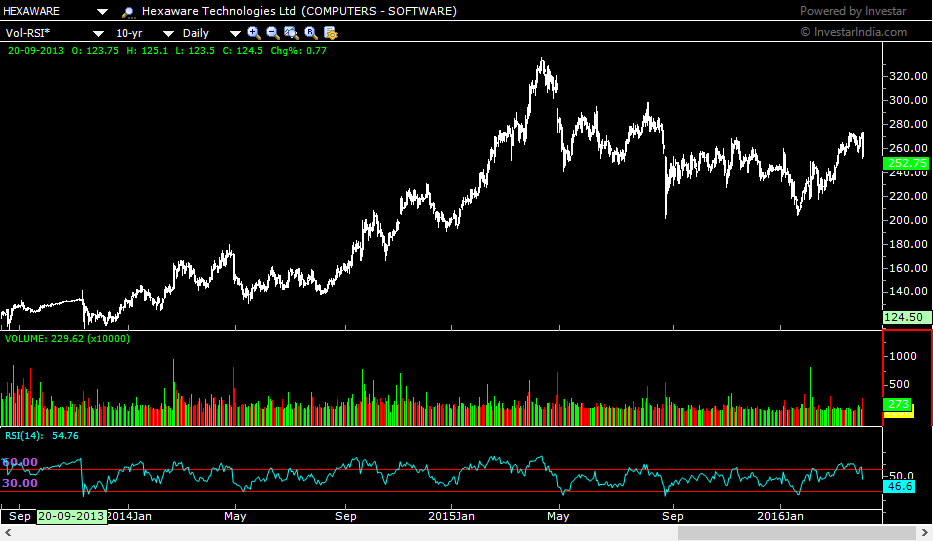
CHART OF THE DAY:

Join TMP Join TMP Join TMP

On the weekly chart of Hexaware, we can see that the stock has come off the high quite some time ago. The RSI index has a story to narrate here and hint at what the future might hold. On the weekly chart we se that during the rally, RSI was seen tradig in the range of 35-70+, however ever since the stock has abondoned the top the RSI has also given up on the level of 70. It is now shying away from the upper overbought zone and dipping below the oversold zone of 30 onn corrections. This is an indication of impending weakness in the stock.

HEXAWARE DAILY chart showing RSI shying away from the level of 70 on the upside and dipping below 30 on corrections


___________________________________________________________________________________________________________________________


Read more articles here:

http://blog.elearnmarkets.com/market/nifty-chart/

http://blog.elearnmarkets.com/market/nifty-live/

http://blog.elearnmarkets.com/market/nifty-live-chart/


Tags: niftyrsi
ShareTweetSend
Previous Post

Gold Demystified!

Next Post

Market Wrap for 5th April, ’16 RBI cuts Repo rate by 25BPs sending Nifty for a spin.

Elearnmarkets

Elearnmarkets

Elearnmarkets (ELM) is a complete financial market portal where the market experts have taken the onus to spread financial education. ELM constantly experiments with new education methodologies and technologies to make financial education effective, affordable and accessible to all. You can connect with us on Twitter @elearnmarkets.

Related Posts

Hourly Chart
Market Analysis

Nifty Ends on Positive Note, Gains Approx. 475 Points on Positive Global Factors

November 18, 2020
378
Weekly Chart
Market Analysis

Huge Sell-Off Makes the Market Close in a Negative Note on the Expiry Week

November 18, 2020
175
Hourly Chart
Market Analysis

Nifty Ends in Green. Rupee Appreciates and Falling Crude Price Helped the Market to Recover Approx. 140 Point

November 18, 2020
129
Hourly Chart
Market Analysis

Sell Off Continues. Nifty Ends The Week With Three Consecutive Red Candles

November 18, 2020
141

Leave a Reply Cancel reply

Your email address will not be published. Required fields are marked *

Follow Us

Facebook-f Twitter Instagram Linkedin-in Youtube Telegram

Register on Elearnmarkets

Continue your financial learning by creating your own account on Elearnmarkets.com

Register Free Account

Download App

Categories

  • Basic Finance
  • Derivatives
  • Financial Planning
  • Fundamental Analysis
  • Technical Analysis
  • Marketshala
  • Miscellaneous

Popular On Elearnmarkets

  • Market Superheroes:
  • Vivek Bajaj
  • Chetan Panchamia
  • Ashish Kyal
  • Premal Parekh
  • Abhijit Paul
  • Jegan
  • Sivakumar Jayachadran
  • Vishal Malkan
  • Jyoti Budhia
  • Vivek Gadodia
  • Vishal Mehta
  • Piyush Chaudhry
  • Santosh Pasi
  • Gomathi Shankar
  • Market Superheroes:
  • Vivek Bajaj
  • Chetan Panchamia
  • Ashish Kyal
  • Premal Parekh
  • Abhijit Paul
  • Jegan
  • Sivakumar Jayachadran
  • Vishal Malkan
  • Jyoti Budhia
  • Vivek Gadodia
  • Vishal Mehta
  • Piyush Chaudhry
  • Santosh Pasi
  • Gomathi Shankar
  • Courses:​
  • Options Trading
  • Dow Theory
  • Momentum Trading
  • Stock Investing
  • Stock Market for Beginners
  • Harmonic Chart Patterns
  • Algo Trading
  • Elliot Wave Theory
  • Advanced Excel
  • Cryptocurrency
  • NSE Certification Course
  • Courses:​
  • Options Trading
  • Dow Theory
  • Momentum Trading
  • Stock Investing
  • Stock Market for Beginners
  • Harmonic Chart Patterns
  • Algo Trading
  • Elliot Wave Theory
  • Advanced Excel
  • Cryptocurrency
  • NSE Certification Course
  • Webinars:
  • Bank Nifty Scalping
  • Intraday Trading Strategies
  • Options Trading Strategies
  • Options selling
  • Price Action
  • Relative Strength
  • Tax Planning
  • Options Buying
  • Growth Stocks
  • Portfolio Management
  • Relative Strength Index
  • Risk Management
  • Renko Charts
  • Crude Oil
  • Traders Psychology
  • Moving Average
  • Multibagger Stocks
  • Free Learning Modules:
  • Intraday Trading
  • Options Scalping
  • Swing Trading
  • Financial Modelling
  • RSI Indicator
  • Bollinger Bands
  • Pricing of Futures
  • Personal Finance
  • Initial Public Offerings (IPO)
  • Value Investing
  • Technical Indicators
  • Candlesticks
  • Chart Patterns
  • Option Greeks
  • ELSS Funds
  • Banking and Insurance
  • Real Estate
  • Gold
  • Book Summaries:
  • Rich Dad Poor Dad
  • Psychology of Money
  • The Intelligent Investor
  • The Richest Man in Babylon
  • Think and Trade Like a Champion
  • Value Investing and Behavioural Finance
  • Trading in the Zone
  • Learn to Earn
  • Book Summaries:
  • Rich Dad Poor Dad
  • Psychology of Money
  • The Intelligent Investor
  • The Richest Man in Babylon
  • Think and Trade Like a Champion
  • Value Investing and Behavioural Finance
  • Trading in the Zone
  • Learn to Earn
  • Tools:
  • CAGR Calculator
  • SIP Calculator
  • eLearnOptions
  • Future Value Calculator
  • Present Value Calculator
  • Atal Pension Yojana
  • Cost of Delay Calculator
  • Become a Crorepati
  • Tools:
  • CAGR Calculator
  • SIP Calculator
  • eLearnOptions
  • Future Value Calculator
  • Present Value Calculator
  • Atal Pension Yojana
  • Cost of Delay Calculator
  • Become a Crorepati

© 2023 Elearnmarkets. All Rights Reserved

  • Visit Elearnmarkets
  • Courses
  • Webinars
  • Financial Guides
  • Get Free Counselling
  • Visit Elearnmarkets
  • Courses
  • Webinars
  • Financial Guides
  • Get Free Counselling

Get Elearnmarkets App

No Result
View All Result
  • Article Categories
    • Basic Finance
    • Derivatives
    • Financial Planning
    • Fundamental Analysis
    • Technical Analysis
    • Marketshala
    • Miscellaneous
  • Language
    • Hindi
    • Bengali
    • English
  • Courses
  • Webinars

© 2020 Elearnmarkets All Rights Reserved

Suggested Learning

Technical Analysis Made Easy

Certification in Online Technical Analysis

Online NSE Academy Certified Capital Market Professional (E-NCCMP)