Today was the end of the FY 15-16. So lets discuss how Nifty has done in the year 15-16. But first, let’s discuss today’s market.
On the daily chart of nifty, we can see that in a narrow range day, the index closed with a gain of just 13 points, with in the resistance range of 7730-7750. On the intraday 10 mins chart, it is evident that today was a volatile session as the candles are seen whipping up and down on the chart. The fall in the second half of the day was seen due to pressure coming in from Banks like ICICI, HDFC and SBIN, along with Reliance Inds. However, the index covered soon and closed on the green side.
Banknifty has also closed in green however, thecandle is a form of Doji, resistance coming in from the zone of 16180-16200. Another resistance is present at 17000, and the bullishness is being indicated by the RSI indicator as well.
The gainers of the day are:
The losers of the day are:
TATAsteel is under pressure, because of it Britain division which is under the heat of Nationalisation and is heading towards being closed.
The indices have given good performance with NSE Realty index which closed 1.67% higher.
Now coming the FY 15-16 performance. Nifty closed some 8% lower, from 8491, down to 7748. Inspite of this YoY down performance the month of March was a big cheer for the index, as Nifty gained 11% in this month alone thereby wiping off a huge chunck of the loss. 11% in a single month is the most Nifty has gained in the past 4 years , and it was the best March ending in the last 7 years!
INTERNATIONAL PICTURE:
The DJIA and NASDAQ futures are slightly under pressure, crude oil is also half a percent higher though the metals are doing well currently, with gold trading 0.6% higher.
In US, Dow and NASDAQ indices closed a good half percent higher yesterday. The European indices are weak today amidst the steel industry crisis stemming up from Britain. In Asia also, there is a fair share of trouble with S&P downgrading China’s growth outlook which has casting clouds on China’s performance for tomorrow.
CHART OF THE DAY
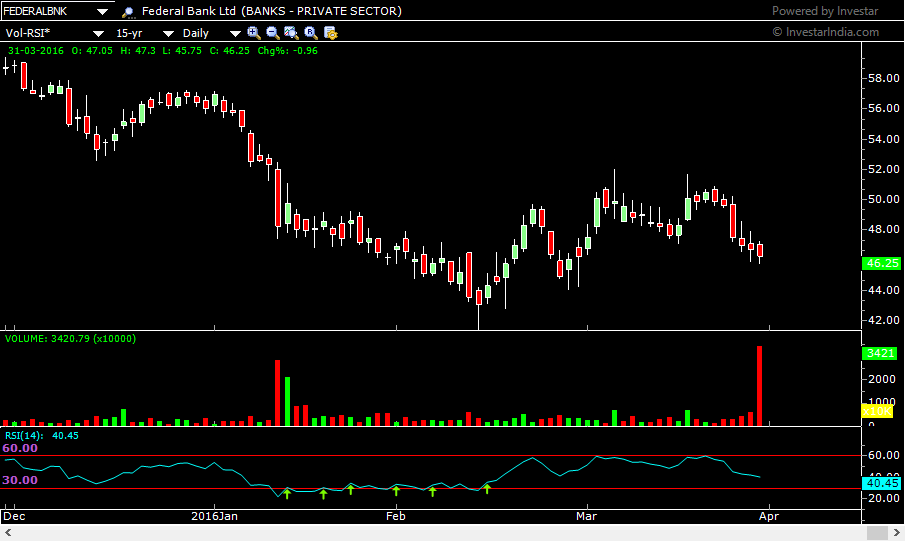
With the Non Performing Asset (NPA) crisis of the banks going on, we ll have a look at the chart of Federal Bank. Here we can see that the momentum in the stock is not very strong with RSI also dropping at the level of 60. Every attempt of the stock to make a higher high has been met with a stubborn RSI indicator which is refusing to mirror the act. However lets not rush in to say that the stock is weak because on the charts we can see in the last steep decent the indicator had also managed to keep its nose above 30 and that is an indication of underlying strength. We can expect the stock to maybe come out of the weakness and show some strength and to determine that we will have to keep an eye on the RSI’s behaviour.
___________________________________________________________________________________________________________________________
Read more articles here:
https://blog.elearnmarkets.com/market/nifty-chart/


