Balance Sheet shows the financial position of a company at a particular point of time. For analysing a company, we should know how to read and analyse its balance sheet. Now, what is meant by financial position?
| Table of Contents |
|---|
| How the Balance Sheet Works? |
| What are Assets? |
| What are Liabilities? |
| What are shareholders’ funds? |
| Analyse the Balance Sheet with Ratios |
| Reading of a Balance Sheet |
| Bottomline |
How the Balance Sheet Works?
Well, every business has assets, using which they carry out their business operation. These assets are either funded by capital of the owners of the company (Equity) or by borrowed capital from external parties. A business also has some liabilities that they owe to external parties.
The above concept can be summed in the Accounting Equation.
Shareholder’s Equity + Liabilities = Assets.
Therefore, a balance sheet represents the constituents of the accounting equation in a detailed manner.
The Balance Sheet and other financial statements of companies in India are to be prepared as per the format mentioned in Schedule III of the Companies Act, 2013.
What are Assets?
An asset is a resource owned or controlled by the entity from which future economic benefits are expected to flow to the entity. The items in the asset side are classified into two sub-heading:
Know the Types of Assets
Non-current Assets
These are basically assets expected to be used for a longer duration of time (at a minimum, more than 12 months). They include tangible, intangible and financial assets of long-term nature.
Learn from Experts : How to Read a Balance Sheet (for Professionals)
The items have been shown below from an ITC Balance sheet extract.
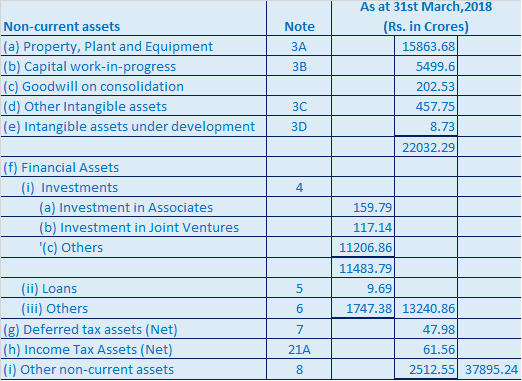
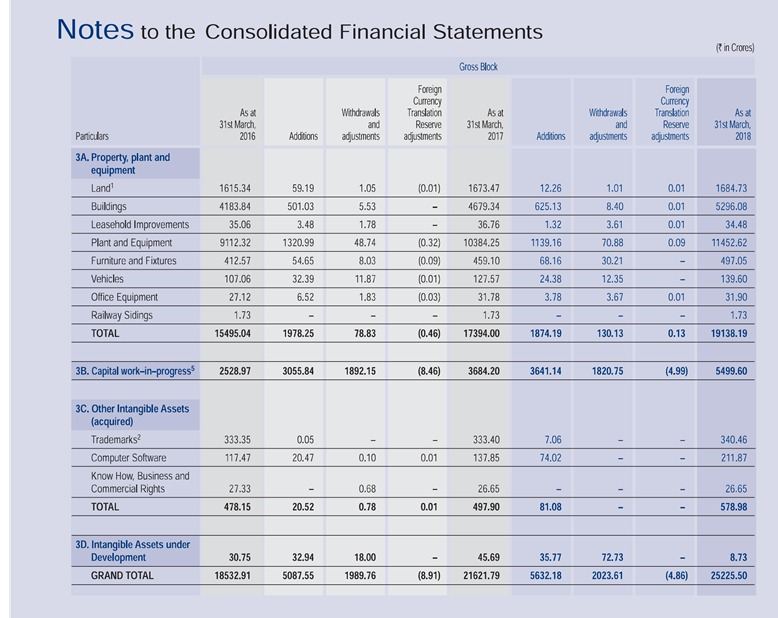
To see the details of the financial items in the balance sheet, you have to refer the notes to accounts.
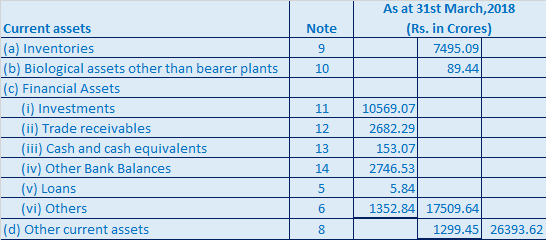
Current Assets
An entity considers an asset to be a current asset when it expects to consume, sell or realise it, in its normal operating cycle (usually within 12 months).

What are Liabilities?
A liability is an obligation of the entity, the settlement of which is expected to result in an outflow of economic resources of the entity. The items in the liability side are classified into two sub-heading:
Suggested Read : The Role Of Assets And Liabilities
Know the Types of Liabilities
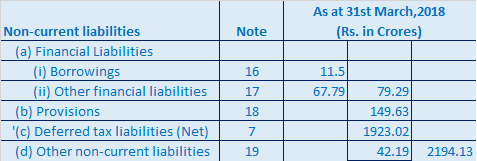
Non-current Liabilities
The liabilities which need not be settled within the current operating cycle (usually within 12 months) from the time of reporting. These obligations can be carried forward and settled later.
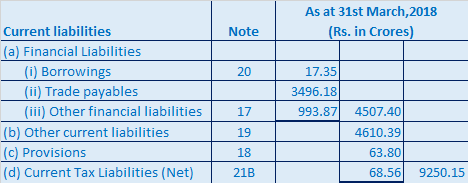
Current Liabilities
These are obligations which the entity expects to settle within the current operating cycle (usually within 12 months).
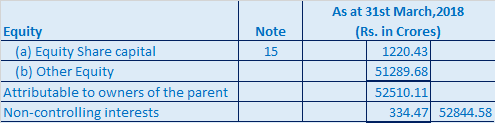
What are shareholders’ funds?
Equity
Equity is the residual interest in the assets of the entity after all the liabilities have been deducted. It is the initial cash/capital brought into the entity by its owners and the additional surplus in the form of profit and loss. It is divided into sub-parts such as securities premium, reserve fund, and retained earnings.
Analyse the Balance Sheet with Ratios
The Balance Sheet is an important document which reports a lot of information about a company. The users of financial statements like the investors, analysts and other stakeholders can derive a lot of knowledge about the company from the balance sheet and other financial statements.
We can use different ratios to analyse the balance sheet numbers.
- The Debt-to-Equity ratio
The Debt to Equity ratio is an important measure of the capital structure of a company.
Debt-to-Equity ratio= Total Debt/ Shareholder’s Equity
In our example of ITC Ltd.
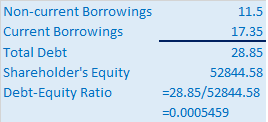
It is measured by dividing total debt by shareholder’s equity. It shows how much a company is leveraged. What portion of the total assets is being funded by debt capital can be measured from this ratio.
A higher ratio means the company is highly leveraged. Although being leveraged is beneficial because of reduced cost of capital but if the business doesn’t do well, leverage or high debt will be a major problem.
Debt capital has an advantage because of the tax benefits the entity receives from interest payment. But, if the business is not making enough profit, the interest payment itself becomes a financial burden.
- Return on Equity (ROE)
The Return on Equity ratio is a measure of profitability.
Return on Equity (ROE) = (Net Profit (PAT)/Equity Share Capital) X 100
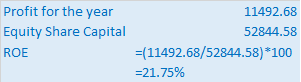
The main purpose of any for-profit business is creating wealth for the shareholders. This ratio shows at what rate the shareholders are earning.
Higher the ratio, better it is. This ratio can be broken as per Du-Pont analysis which will reveal a lot of information.
- Current Ratio
Current Ratio is a measure of liquidity of a company.
Current Ratio = Current Assets/ Current Liabilities
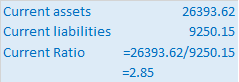
It shows whether the company’s short-term assets are available to pay off its short-term liabilities. A high current ratio is not necessarily good and low current ratio is not necessarily bad. We have to compare other liquidity aspects as well.
It is conceptually based on liquidation of all company’s current assets to meet all of its current liabilities. But, in reality, this is not likely to occur since a business is a going concern.
It’s the time taken to convert a company’s working capital assets to pay its current obligation is the key to its liquidity which can be measured by Cash Conversion Cycle.
Reading of a Balance Sheet
Now as you can see at the ITC Ltd. balance sheet at year end 31.03.2018. The balance sheet has four columns.
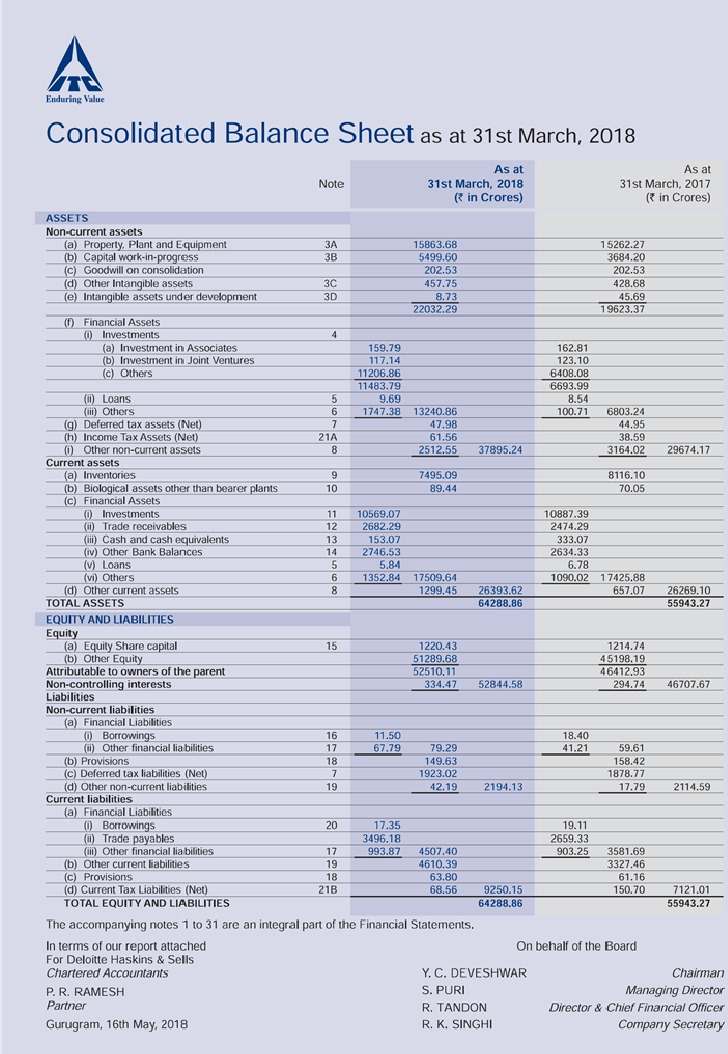
- Column 1 – is the particulars. i.e. the financial items
- Column 2 – is the notes on accounts reference.
- Column 3 – is the numbers at year end 31.03.2018. (Just Concluded Year)
- Column 4 – is the numbers at year end 31.03.2017. (Last Year)
The notes on accounts is a vital part of financial statements. It explains the constituents of the financial items in detail.
Watch this video to know in detail about the Balance sheet –
Bottomline
A balance sheet of a company provides the users of financial statements with a lot of important information. This information can be studied to draw various conclusion about the financial health of a company. Therefore, understanding and analysing the balance sheet data is an integral part of financial analysis as a whole.


Hmm it appears like your website ate my first comment (it was super long) so I guess I’ll just sum it up what I submitted and say, I’m thoroughly enjoying your blog. I too am an aspiring blog writer but I’m still new to the whole thing. Do you have any points for inexperienced blog writers? I’d genuinely appreciate it.