Elearnmarkets - Financial Market Learning
  • Categories
    • Basic Finance
    • Derivatives
    • Financial Planning
    • Fundamental Analysis
    • Technical Analysis
    • Marketshala
    • Miscellaneous
  • Language
    • English
    • Hindi
    • Bengali
No Result
View All Result
  • Courses
  • Webinars
  • Learn On Elearnmarkets
Elearnmarkets - Learn Stock Market, trading, investing for Free
No Result
View All Result
Home Technical Analysis Charts, Patterns & Indicators
Gravestone Doji

Gravestone Doji – The Graveyard in the Sky

Elearnmarkets by Elearnmarkets
September 26, 2022
in Charts, Patterns & Indicators, Technical Analysis
Reading Time: 4 mins read
0
16.5k
VIEWS
Share on FacebookShare on TwitterShare on WhatsApp

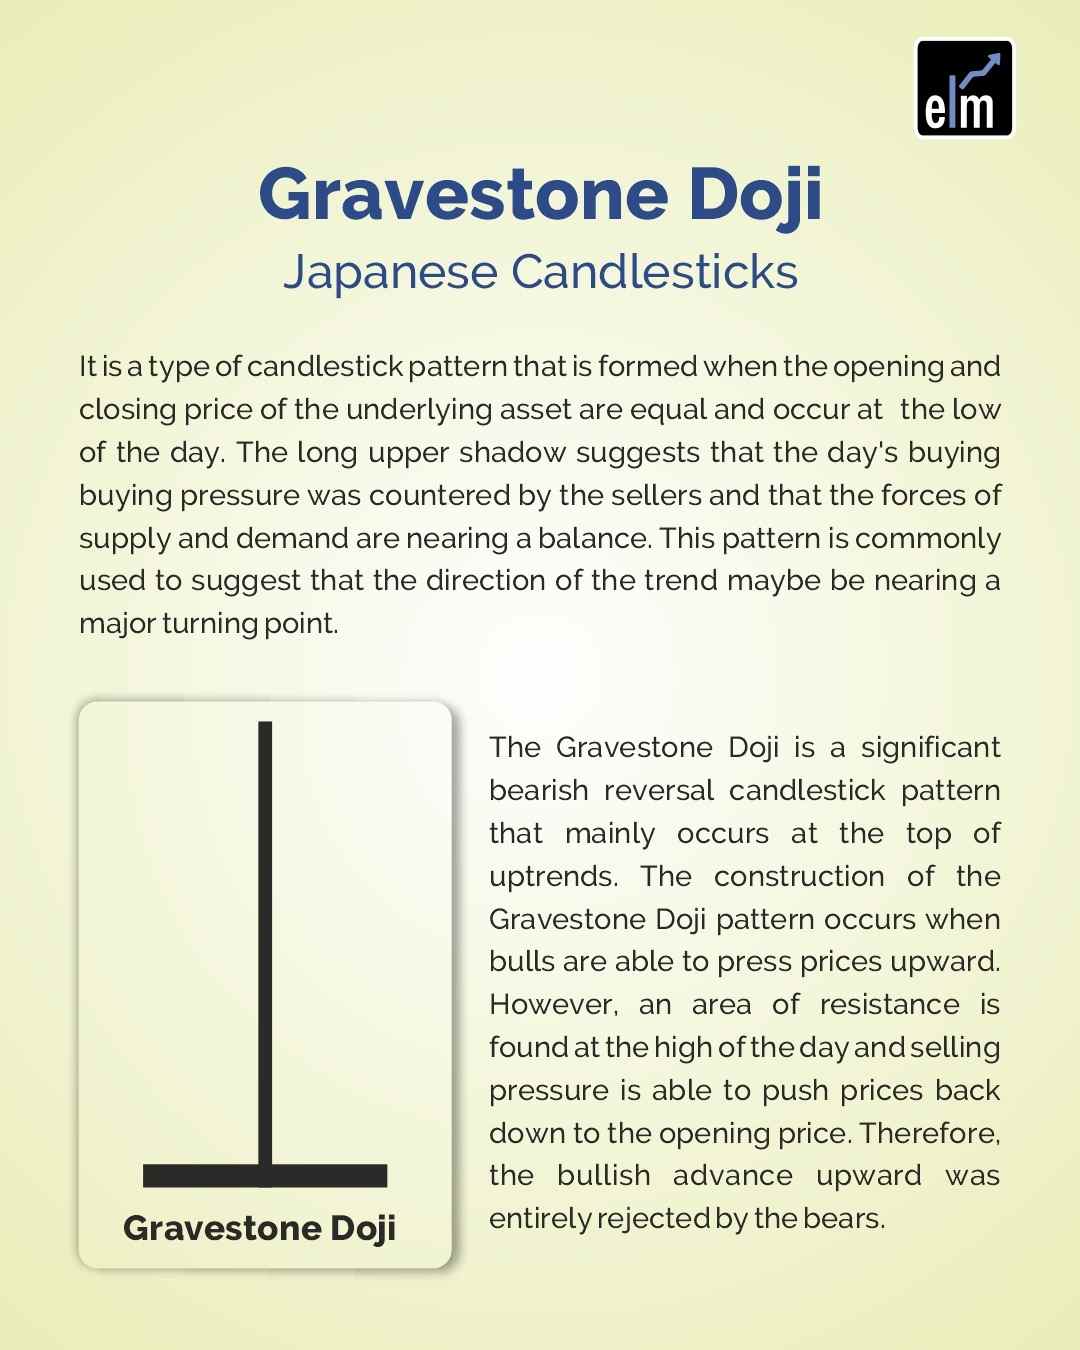
The Gravestone Doji is a candlestick pattern that shows the opening and closing of the candle at the low of the day and is quite bearish.

It is typically seen at the end of an advance where the upper shadow represents new high ground for the move.

The fact that prices end the day at the opening (after all the work at higher levels) is indicative of a change in psychology and is really a sign of exhaustion.

Table of Contents
Construction of Gravestone Doji Pattern
Examples of Gravestone Doji
Bottomline

In the case of this candlestick pattern, the longer the shadow, the more negative is the candle.

In simple words, the Doji candle ended the session at the same price in which it began.

Join TMP Join TMP Join TMP

Looking at the candle, we can interpret the basic underlying psychology of the candle is to reflect a session that ends in indecision.

The basic characteristic that defines this japanese candlesticks is a small real body and an unusually long upper shadow.

Gravestone Doji Pattern

Construction of Gravestone Doji Pattern

The construction of the Gravestone Doji pattern occurs when the bulls are able to press prices upward.

But, an area of resistance is formed when it reaches the high of the day and the selling pressure pushes the prices back down to the opening price of the day.

Learn to Identify Trend Reversals with Candlesticks in just 2 hours by Market Experts

This indicates that the bullish rally upward has been completely rejected by the markets.

It is an extremely helpful pattern to help traders visually see where resistance and supply are likely to be located.

After an uptrend, the Gravestone Doji can signal to traders that the uptrend could be over and that long positions should probably be exited.

But other indicators should be used in conjunction with the Gravestone Doji pattern to determine an actual sell signal.

A potential trigger could be a break of the upward trendline support.

Examples of Gravestone Doji

Adani Ports

In the daily chart of Adani ports, we can see a Gravestone Doji formation on the date 22.05.2015. The Doji was formed with a prior uptrend from the levels of 300 to 348.

Adani Ports Chart

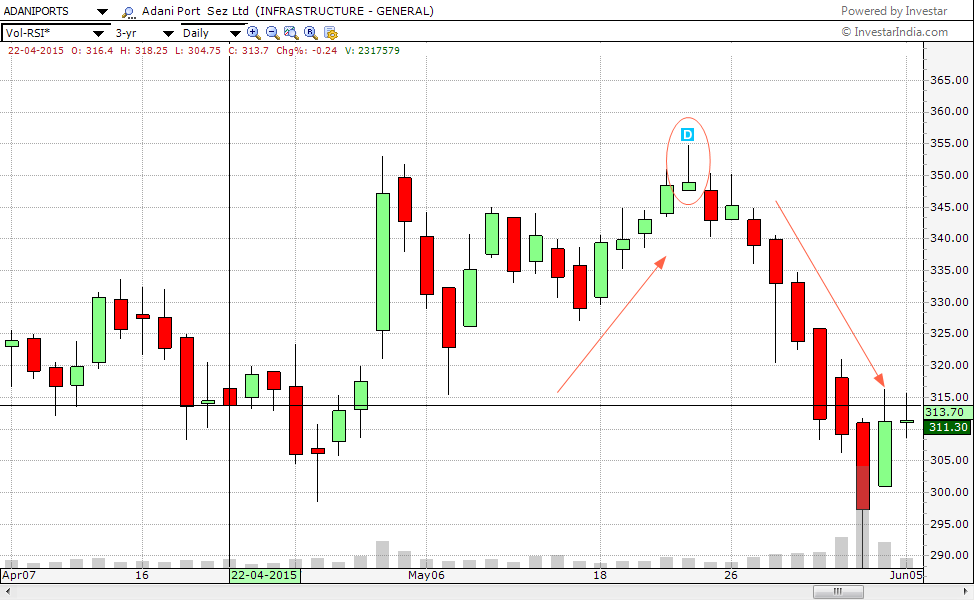
This was a rally of 16 percent and after the formation of the Gravestone Doji, the stock fell from the level of 350 to the levels of 298 which was again a fall of about 15 percent

Andhra Bank:

Andhra Bank chart

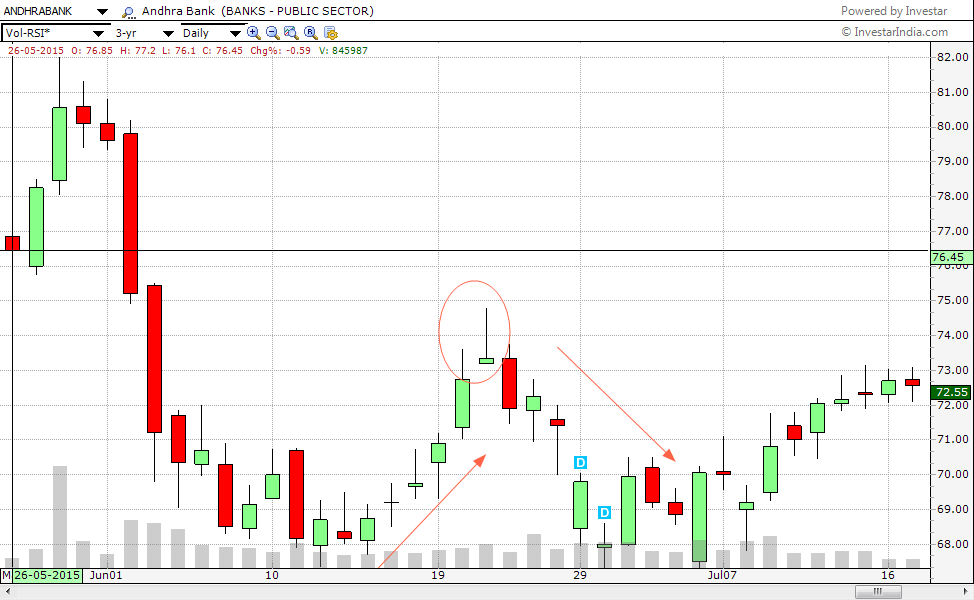
This daily chart of Andhra bank is another example of the Doji pattern. With a prior uptrend of about 7% from the level of 68, it formed at Doji at 73 and then reversed its trend to go back to the levels of 69.

Bottom line:

We hope that the above write-up has helped you to get a clear understanding of this Doji pattern.

Feel free to give your feedback by writing to us in the comment box below.

In order to get the latest updates about Financial Markets visit https://stockedge.com/

Happy Learning!!

Tags: candlestickcandlestick patternDojienglishgravestone doji
ShareTweetSend
Previous Post

Nifty gains 1 percent, Rate cut hopes lift market.

Next Post

Nifty below 7850, Indian Markets Nervous

Elearnmarkets

Elearnmarkets

Elearnmarkets (ELM) is a complete financial market portal where the market experts have taken the onus to spread financial education. ELM constantly experiments with new education methodologies and technologies to make financial education effective, affordable and accessible to all. You can connect with us on Twitter @elearnmarkets.

Related Posts

How to trade with Renko Charts Efficiently? 1
Technical Analysis

How to trade with Renko Charts Efficiently?

June 6, 2023
2.1k
Technical Analysis in Stock Trading 2
Technical Analysis

Technical Analysis in Stock Trading

May 31, 2023
7.1k
The Ultimate guide to Trading Divergences 3
Technical Analysis

The Ultimate guide to Trading Divergences

May 26, 2023
1.1k
Trading Psychology: Guide to Master Your Mind in 5 Steps 4
Technical Analysis

Trading Psychology: Guide to Master Your Mind in 5 Steps

May 24, 2023
3.2k

Leave a Reply Cancel reply

Your email address will not be published. Required fields are marked *

Follow Us

Facebook-f Twitter Instagram Linkedin-in Youtube Telegram

Register on Elearnmarkets

Continue your financial learning by creating your own account on Elearnmarkets.com

Register Free Account

Download App

Categories

  • Basic Finance
  • Derivatives
  • Financial Planning
  • Fundamental Analysis
  • Technical Analysis
  • Marketshala
  • Miscellaneous

Popular On Elearnmarkets

  • Market Superheroes:
  • Vivek Bajaj
  • Chetan Panchamia
  • Ashish Kyal
  • Premal Parekh
  • Abhijit Paul
  • Jegan
  • Sivakumar Jayachadran
  • Vishal Malkan
  • Jyoti Budhia
  • Vivek Gadodia
  • Vishal Mehta
  • Piyush Chaudhry
  • Santosh Pasi
  • Gomathi Shankar
  • Market Superheroes:
  • Vivek Bajaj
  • Chetan Panchamia
  • Ashish Kyal
  • Premal Parekh
  • Abhijit Paul
  • Jegan
  • Sivakumar Jayachadran
  • Vishal Malkan
  • Jyoti Budhia
  • Vivek Gadodia
  • Vishal Mehta
  • Piyush Chaudhry
  • Santosh Pasi
  • Gomathi Shankar
  • Courses:​
  • Options Trading
  • Dow Theory
  • Momentum Trading
  • Stock Investing
  • Stock Market for Beginners
  • Harmonic Chart Patterns
  • Algo Trading
  • Elliot Wave Theory
  • Advanced Excel
  • Cryptocurrency
  • NSE Certification Course
  • Courses:​
  • Options Trading
  • Dow Theory
  • Momentum Trading
  • Stock Investing
  • Stock Market for Beginners
  • Harmonic Chart Patterns
  • Algo Trading
  • Elliot Wave Theory
  • Advanced Excel
  • Cryptocurrency
  • NSE Certification Course
  • Webinars:
  • Bank Nifty Scalping
  • Intraday Trading Strategies
  • Options Trading Strategies
  • Options selling
  • Price Action
  • Relative Strength
  • Tax Planning
  • Options Buying
  • Growth Stocks
  • Portfolio Management
  • Relative Strength Index
  • Risk Management
  • Renko Charts
  • Crude Oil
  • Traders Psychology
  • Moving Average
  • Multibagger Stocks
  • Free Learning Modules:
  • Intraday Trading
  • Options Scalping
  • Swing Trading
  • Financial Modelling
  • RSI Indicator
  • Bollinger Bands
  • Pricing of Futures
  • Personal Finance
  • Initial Public Offerings (IPO)
  • Value Investing
  • Technical Indicators
  • Candlesticks
  • Chart Patterns
  • Option Greeks
  • ELSS Funds
  • Banking and Insurance
  • Real Estate
  • Gold
  • Book Summaries:
  • Rich Dad Poor Dad
  • Psychology of Money
  • The Intelligent Investor
  • The Richest Man in Babylon
  • Think and Trade Like a Champion
  • Value Investing and Behavioural Finance
  • Trading in the Zone
  • Learn to Earn
  • Book Summaries:
  • Rich Dad Poor Dad
  • Psychology of Money
  • The Intelligent Investor
  • The Richest Man in Babylon
  • Think and Trade Like a Champion
  • Value Investing and Behavioural Finance
  • Trading in the Zone
  • Learn to Earn
  • Tools:
  • CAGR Calculator
  • SIP Calculator
  • eLearnOptions
  • Future Value Calculator
  • Present Value Calculator
  • Atal Pension Yojana
  • Cost of Delay Calculator
  • Become a Crorepati
  • Tools:
  • CAGR Calculator
  • SIP Calculator
  • eLearnOptions
  • Future Value Calculator
  • Present Value Calculator
  • Atal Pension Yojana
  • Cost of Delay Calculator
  • Become a Crorepati

© 2023 Elearnmarkets. All Rights Reserved

  • Visit Elearnmarkets
  • Courses
  • Webinars
  • Financial Guides
  • Get Free Counselling
  • Visit Elearnmarkets
  • Courses
  • Webinars
  • Financial Guides
  • Get Free Counselling

Get Elearnmarkets App

No Result
View All Result
  • Article Categories
    • Basic Finance
    • Derivatives
    • Financial Planning
    • Fundamental Analysis
    • Technical Analysis
    • Marketshala
    • Miscellaneous
  • Language
    • Hindi
    • Bengali
    • English
  • Courses
  • Webinars

© 2020 Elearnmarkets All Rights Reserved