Elearnmarkets - Financial Market Learning
  • Courses
  • Webinars
  • Stories
  • Language
    • English
    • Hindi
    • Bengali
No Result
View All Result
Get Free Course
  • Basic Finance
  • Derivatives
    • Futures
    • Options
  • Financial Planning
  • Fundamental Analysis
  • Technical Analysis
  • Mutual Funds
  • Marketshala
  • Miscellaneous
Elearnmarkets - Learn Stock Market, trading, investing for Free
  • Courses
  • Webinars
  • Stories
  • Language
    • English
    • Hindi
    • Bengali
No Result
View All Result
Get Free Course
Elearnmarkets - Learn Stock Market, trading, investing for Free
No Result
View All Result
Home Technical Analysis
opening range breakouts

How to Trade Opening Range Breakouts

Elearnmarkets by Elearnmarkets
June 20, 2024
in Technical Analysis, Charts, Patterns & Indicators
Reading Time: 8 mins read
11
66.7k
VIEWS
Share on FacebookShare on XShare on WhatsApp

Opening range breakouts are one of the important reversal and continuation chart patterns,  designed to capture move or reversal during this first hour.

The first hour of the trading day is the most active and dynamic period. Though it is the time period where you can make most of your money quickly, you may also lose without a trading plan. The first hour is the most volatile time frame during the trading day.

In this blog we will understand what is opening range and method to trade them:

Table of Contents
What is Opening Range breakouts?
Size of the Opening Range Breakouts
Opening Range Breakout Calculator
ORB Trading Strategy

What is Opening Range breakouts?

The opening range is high and low for a given period after the market opens. This period is generally the first 30 or 60 minutes of trading. It is one most important chart patterns to make money in the stock market.

During this period we need to identify the highs and lows of the day. Also, we need to identify pre-market highs and lows, as these levels act like a magnet on price action after the market opens.

The opening hour of the market is associated with big trading volumes and volatility. This time of the trading session provides many trading opportunities. In this way, traders use the opening range to set the entry points and to predict and forecast the price action for the day.

Size of the Opening Range Breakouts

The first thing you should do before trading is to measure the size of the opening range. When the market opens, you need to see two candles which will help you to measure the size of the range.

The last candle from yesterday’s trading session is the first candle and the second candle is the first one that is created when the market opens.

Learn to make profit out of failed breakouts in just 2 hours by Market Experts

To get the range size you need to take the high or low of yesterday’s last candle and the high or low of today’s opening candle. The difference between these two prices is the size of the opening range. Let’s see from the chart below how it measures the size of a range:

opening range size

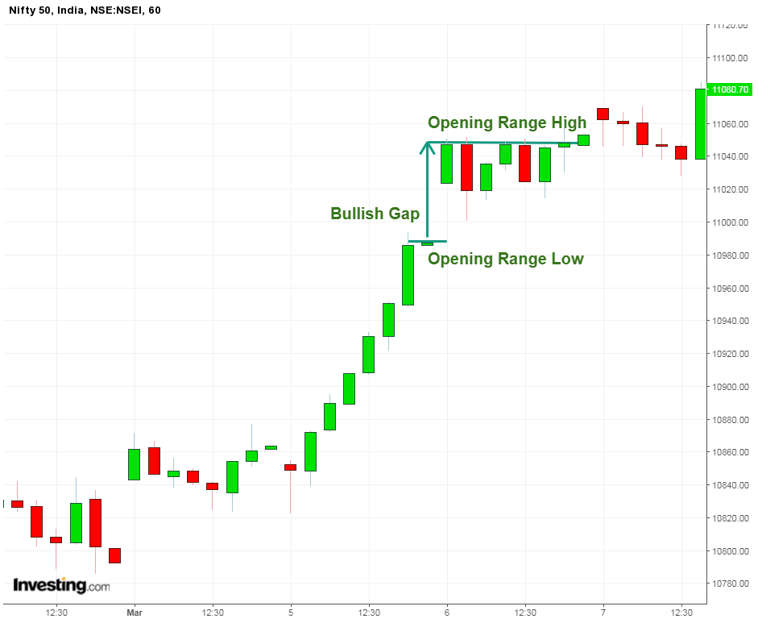
The green lines, as shown on the chart measure the size of the range. The upper line shows the opening range high and the lower horizontal line is the opening range low.

Opening Range Breakout Calculator

The most important part of the opening range trading is the breakout.

Also Read: Most Important Chart Patterns to Make Money in Stock Market

The opening range breakouts determine the further price direction. When the price breaks out of the range, there is a big chance that the price action will continue in the same direction. Therefore opening range trading strategies use the range breakout as entry points on the charts.

opening range calculator

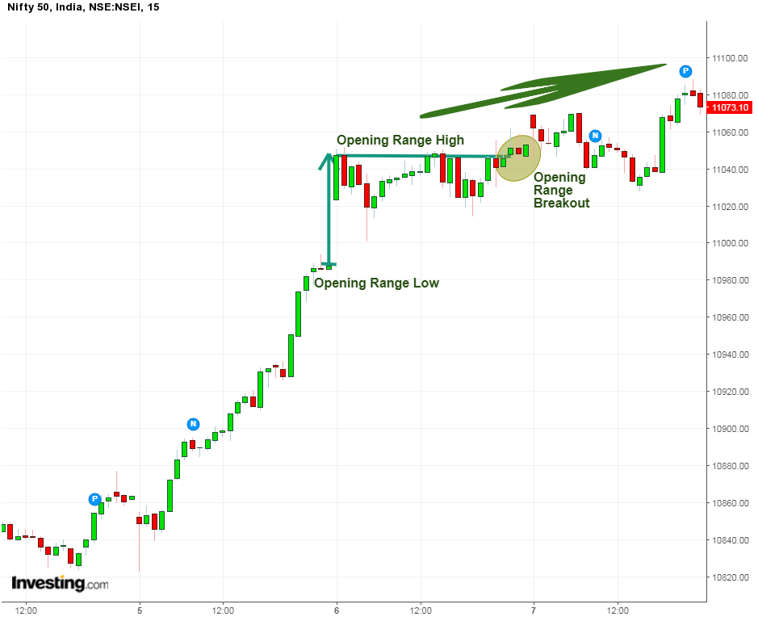
This is opening range breakouts. The size of the range is marked with green horizontal lines on the chart. The range breakout is located in the green circle and the price shoots up after the opening range breakouts.

ORB Trading Strategy

The stock market opening bell can be approached in many ways. Let’s discuss a day trading strategy:

1. Early Morning Range Breakout:

This is one of the popular opening range success formulas. The early morning range breakout focuses on the size of the gap and also on the breakthrough its high/low.

In this strategy, we need to trade in the direction of the breakout when we identify the boundaries of gaps. The breakouts later in the day should be taken as caution.

One should always use a stop-loss order when trading the early morning range breakout. The stop loss should be the mid-point of the gap.

early morning range

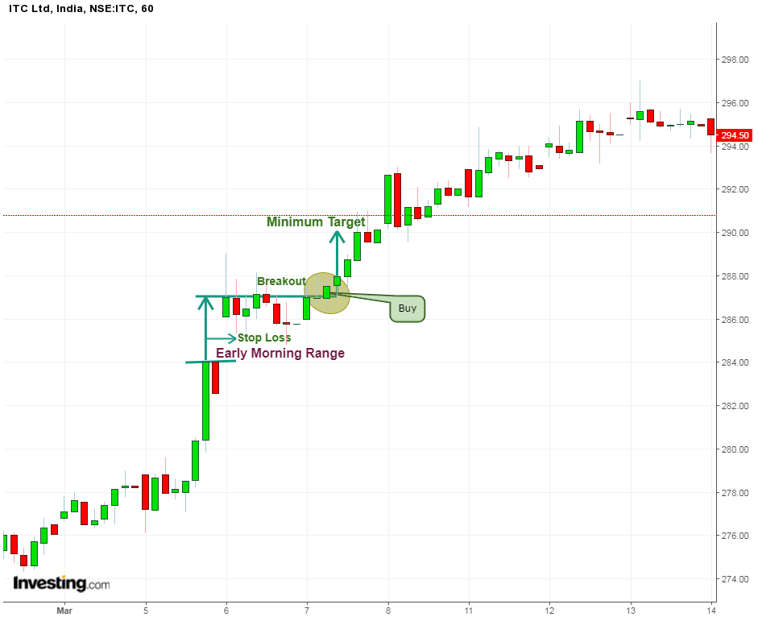
The picture above shows the hourly chart of ITC ltd, which exhibits an early morning range breakout.

The opening range is outlined with two parallel lines. We enter into a trade when the price breaks the upper level of the early morning range. The stop loss should be located in the middle of the range.

2. Chart Pattern Gap Pullback Buy

This is another approach for trading the opening range but is applied only to bullish gaps.

Once we spot a bullish gap on the chart, the price immediately starts moving contrary to the gap direction.

This is known as the pullback. As the gap is bullish, then the pullback would be bearish.

The main purpose of this strategy is to predict the end of the pullback.

In this strategy, one should know when to purchase the pullback.

This can be done by looking for a reversal candlestick pattern.

After identifying a reversal, one should wait for confirmation and then enter a long trade.

When you use this opening range trading strategy, you should use a stop-loss order for protecting your trades.

Also, the proper location of your stop should be below the lowest point of the opening range.

You should hold your trade for a minimum bullish move equal to the size of the gap.

3. Gap Reversal

The gap reversal is another way of approaching the opening morning range of stock.

There is a gap reversal when the price creates a gap, but the range is broken in the opposite direction.

If the gap is bullish, there is a gap reversal when the price breaks the lower level of the opening range.

Similarly, If the gap is bearish, then there is a gap reversal when the price breaks the upper level of the opening range.

When you open your gap reversal trade then you should also secure the trade with a stop-loss order.

The stop loss should be the mid-point of the opening range.

When you trade the gap reversal, then you should hold the trade for a minimum price move equal to the size of the gap.

Improve your trading strategies. Enroll in our Candlestick Pattern Course and start making more informed trading decisions!

Key Takeaways

1. In order to measure the size of the range you should take the distance between the High/low of the closing candle in the previous trading session and the High/low of the opening candle in the new trading session.

2. The most important thing of the opening range trading is the breakout from the opening range.

  • When the stock breaks the opening range upwards, then the price action is likely to continue in a bullish direction
  • When the stock breaks the opening range downwards, then the price action is expected to continue in a bearish direction.

3. Early Morning Range Breakout

  • When the price action breaks out of the opening range, enter a trade.
  • Open the trade in the direction of the breakout whether uptrend or downtrend.
  • Place a stop loss in the middle of the opening range.
  • Stay in the trade for a minimum price move which is equal to the size of the morning gap.

Happy Learning!

Tags: englishintermediate
Share14TweetSend
Get Kotak Offer Get Kotak Offer Get Kotak Offer
Previous Post

How to successfully trade Cup and Handle pattern?

Next Post

How Multi time frame analysis can multiply your returns?

Elearnmarkets

Elearnmarkets

Elearnmarkets (ELM) is a complete financial market portal where the market experts have taken the onus to spread financial education. ELM constantly experiments with new education methodologies and technologies to make financial education effective, affordable and accessible to all. You can connect with us on Twitter @elearnmarkets.

Related Posts

Understand Slippage in Trading
Technical Analysis

What is Slippage in Trading? Meaning & Examples

March 28, 2025
284
Breakout trading strategies
Technical Analysis

Top 5 Breakout Trading Strategies

March 12, 2025
1k
5 stocks for today
Technical Analysis

5 Stocks to Buy Today That Could Beat the NIFTY in 2025!

May 5, 2025
390
Image describing What is marginal trading facility
Technical Analysis

 What is a Margin Trading Facility? Advantages & Risks

April 4, 2025
657

Comments 11

  1. anand says:
    6 years ago

    in above article of opening range breakout you have explained range as difference between high/low of previous candle and high/low of following candle, but in charts you have shown it as difference of open/close of previous candle and open/close of following candle. please explain

    Reply
    • Sakshi Agarwal says:
      6 years ago

      Hi Anand,

      Thank you for your feedback. We will change it as soon as possible.

      Thank you for reading!

      Keep Reading!

      Reply
  2. Online task Search Engines says:
    5 years ago

    Saved as a favorite, I like your web site!

    Reply
  3. agen domino qq terbaik says:
    5 years ago

    Keep on working, great job!

    Reply
  4. Ajit says:
    5 years ago

    Hi
    How can we use previous data for opening range calculation for next day trading if we do not use chart?

    Reply
    • Sakshi Agarwal says:
      5 years ago

      Hi,

      This pattern is chart-based, you have to look at the charts when analyzing this pattern.

      Thank you for Reading!

      Reply
  5. Sourabh says:
    5 years ago

    Nice!

    Reply
  6. V V SUBRAHMANYAM says:
    3 years ago

    Thank you for dessiminating knowledge on ORB.
    Anand pointed out on the range markings. It has been two years you promised to change the range markings. Kindly do so immediately at least now.

    Reply
    • Sakshi Agarwal says:
      3 years ago

      Hi,

      We really appreciated that you liked our blog.

      Keep Reading!

      Reply
  7. Chris says:
    3 years ago

    Very nice explanation I like it! Thank you.

    Reply
    • Sakshi Agarwal says:
      3 years ago

      Hi,

      We really appreciated that you liked our blog! Thank you for your feedback!

      Keep Reading!

      Reply

Leave a Reply Cancel reply

Your email address will not be published. Required fields are marked *

Disclaimer

Elearnmarkets (Kredent InfoEdge Pvt. Ltd.) is a SEBI-registered Research Analyst (RA) entity (SEBI Registration No.: INH300007493). The information provided in this article is for educational and informational purposes only and should not be considered as an offer to buy or sell any securities or investment products.

The stocks, securities, and investment instruments mentioned herein are not recommendations under SEBI (Research Analysts) Regulations, 2014. Readers are advised to conduct their own due diligence and seek independent financial advice before making any investment decisions.

Investments in securities markets are subject to market risks. Please read all related documents carefully before investing. Investing in Equity Shares,
Derivatives, Mutual Funds, or other instruments carry inherent risks, including potential loss of capital. Elearnmarkets (Kredent InfoEdge Pvt. Ltd.) does not provide any guarantee or assurance of returns on any investments. Past performance is not indicative of future performance.

Elearnmarkets Logo

Follow Us

Facebook-f X-twitter Instagram Linkedin-in Youtube Telegram

Register on Elearnmarkets

Continue your financial learning by creating your own account on Elearnmarkets.com

Register Free Account

Download App

Playstore logo
Download on app store

Categories

  • Basic Finance
  • Derivatives
  • Financial Planning
  • Fundamental Analysis
  • Technical Analysis
  • Mutual Funds
  • Miscellaneous

Popular On Elearnmarkets

  • Market Superheroes:
  • Vivek Bajaj
  • Chetan Panchamia
  • Ashish Kyal
  • Premal Parekh
  • Abhijit Paul
  • Jegan
  • Sivakumar Jayachadran
  • Jyoti Budhia
  • Vivek Gadodia
  • Vishal Mehta
  • Piyush Chaudhry
  • Santosh Pasi
  • Gomathi Shankar
  • Market Superheroes:
  • Vivek Bajaj
  • Chetan Panchamia
  • Ashish Kyal
  • Premal Parekh
  • Abhijit Paul
  • Jegan
  • Sivakumar Jayachadran
  • Jyoti Budhia
  • Vivek Gadodia
  • Vishal Mehta
  • Piyush Chaudhry
  • Santosh Pasi
  • Gomathi Shankar
  • Courses:​
  • Options Trading
  • Dow Theory
  • Momentum Trading
  • Stock Investing
  • Harmonic Chart Patterns
  • Algo Trading
  • Elliot Wave Theory
  • Advanced Excel
  • Cryptocurrency
  • NSE Certification Course
  • Courses:​
  • Options Trading
  • Dow Theory
  • Momentum Trading
  • Stock Investing
  • Harmonic Chart Patterns
  • Algo Trading
  • Elliot Wave Theory
  • Advanced Excel
  • Cryptocurrency
  • NSE Certification Course
  • Webinars:
  • Bank Nifty Scalping
  • Intraday Trading Strategies
  • Options Trading Strategies
  • Options selling
  • Price Action
  • Relative Strength
  • Tax Planning
  • Options Buying
  • Growth Stocks
  • Portfolio Management
  • Risk Management
  • Renko Charts
  • Crude Oil
  • Traders Psychology
  • Moving Average
  • Multibagger Stocks
  • Free Learning Modules:
  • Intraday Trading
  • Options Scalping
  • Swing Trading
  • Financial Modelling
  • RSI Indicator
  • Bollinger Bands
  • Pricing of Futures
  • Personal Finance
  • Initial Public Offerings (IPO)
  • Value Investing
  • Technical Indicators
  • Candlesticks
  • Chart Patterns
  • Option Greeks
  • ELSS Funds
  • Banking and Insurance
  • Real Estate
  • Gold
  • Book Summaries:
  • Rich Dad Poor Dad
  • Psychology of Money
  • The Intelligent Investor
  • The Richest Man in Babylon
  • Think and Trade Like a Champion
  • Value Investing and Behavioural Finance
  • Trading in the Zone
  • Learn to Earn
  • Book Summaries:
  • Rich Dad Poor Dad
  • Psychology of Money
  • The Intelligent Investor
  • The Richest Man in Babylon
  • Think and Trade Like a Champion
  • Value Investing and Behavioural Finance
  • Trading in the Zone
  • Learn to Earn
  • Tools:
  • CAGR Calculator
  • SIP Calculator
  • eLearnOptions
  • Future Value Calculator
  • Present Value Calculator
  • Atal Pension Yojana
  • Cost of Delay Calculator
  • Become a Crorepati
  • Tools:
  • CAGR Calculator
  • SIP Calculator
  • eLearnOptions
  • Future Value Calculator
  • Present Value Calculator
  • Atal Pension Yojana
  • Cost of Delay Calculator
  • Become a Crorepati

© 2025 Elearnmarkets. All Rights Reserved

  • Visit Elearnmarkets
  • Courses
  • Webinars
  • Financial Guides
  • Get Free Counselling
  • Visit Elearnmarkets
  • Courses
  • Webinars
  • Financial Guides
  • Get Free Counselling

Download Our App

No Result
View All Result
  • Article Categories
    • Basic Finance
    • Derivatives
    • Financial Planning
    • Fundamental Analysis
    • Technical Analysis
    • ETFs & Mutual Funds
    • Marketshala
    • Miscellaneous
  • Language
    • Hindi
    • Bengali
    • English
  • Courses
  • Webinars
  • Stories
Get Free Course

© 2024 Elearnmarkets All Rights Reserved

A Handbook of Technical Analysis
To start your trading journey as a seasoned technical analyst
Download Guide For FREE
Guidebook On Chart Patterns
Take Your Trading To The Next Level With Strategies Shared In This Ebook
Download Guide For FREE
Trading Day 2025