
Do you know penny stocks swiftly grow a small investment into a sizeable quantity of money, but they can also quickly lose those funds?
The kind of stocks that are sold at extremely low costs are known as penny stocks. These stocks, which are issued by businesses with extremely low market capitalizations, trade for less than 10 rupees a share.
Investors are constantly drawn to the stocks because of their low price, but it is important to realise that these stocks carry a high level of risk, which results in significant premiums for market makers.
The good news is that trading penny stocks doesn’t have to result in the big losses that some traders do. The majority of traders waste their money on the wrong stocks, at the wrong prices, and frequently for the wrong reasons, which causes them to cling to such equities for an excessive amount of time.
For instance, the traders who purchase penny stocks traded on over-the-counter (OTC) marketplaces are probably going to lose money. On the other hand, traders will more likely increase their chances of success if they purchase well-known companies on regulated, significant Indian stock markets. Most of these are respectable businesses with tested business models.
In today’s blog let us discuss how one can start trading in penny stocks:
Table of Contents
What are Penny Stocks?
Penny stocks are companies with very low market capitalizations. The market capitalization of a firm is the sum of its trading market-available shares.
Low liquidity exists for these stocks. Therefore, it is possible to manipulate the market by either offloading shares to cause price drops or buying a significant amount of shares to cause price spikes.
Because of their higher volatility, penny stocks have bigger potential rewards but also higher potential risks.
Sudden delisting and regulatory attention are additional dangers for these stocks because they are vulnerable to market manipulation.
How to find Penny Stocks for Trading?
There are more efficient approaches to finding the greatest penny stocks than simply choosing a trending ticker on Twitter. First and foremost, “the best” refers to equities that provide the most potential for making a significant move.
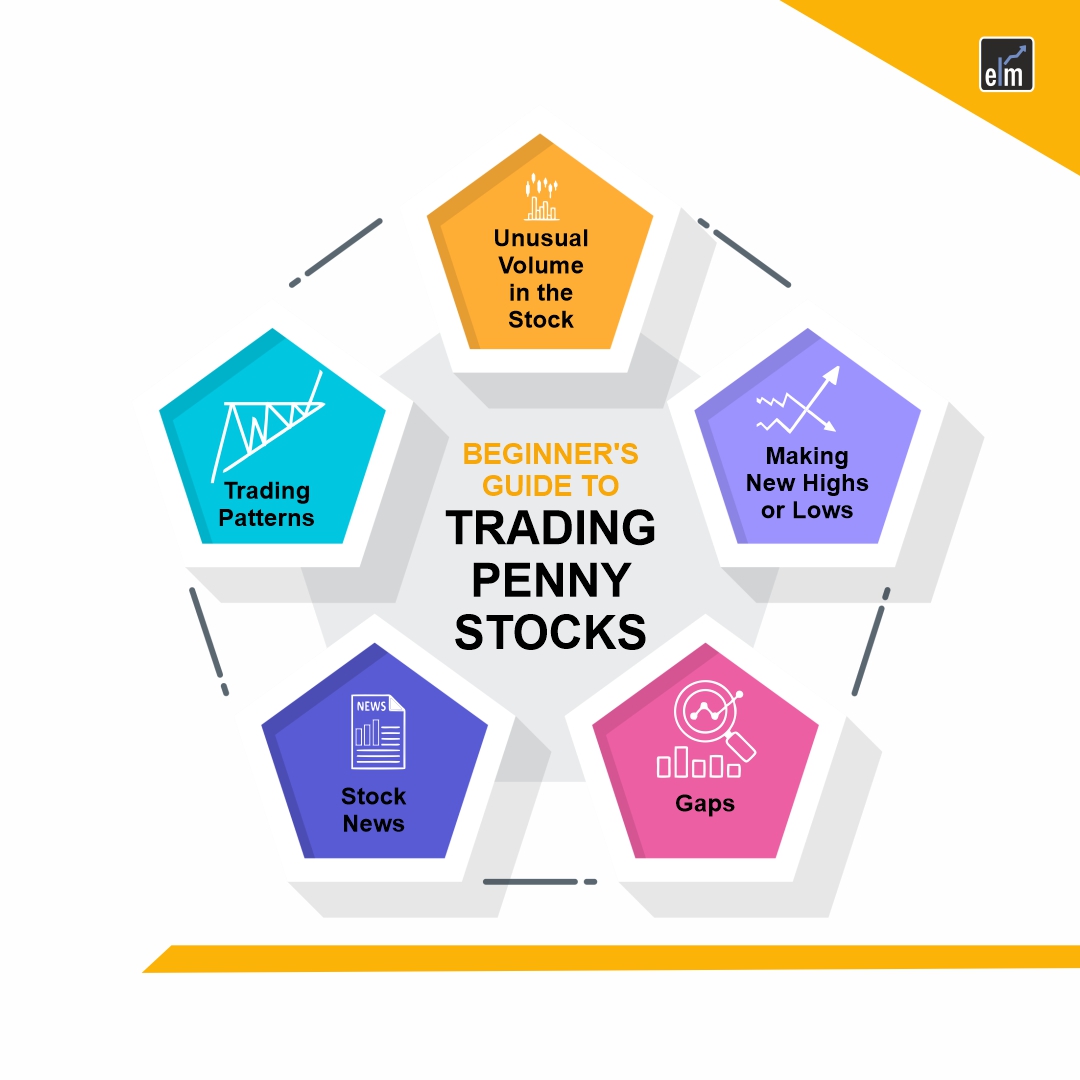
1. Unusual Volume in the Stock
Stocks with erratic or above-average volume are among the first things you should look for. This approach enables you to essentially “follow the money” since extraordinary volume is generally accompanied by an “unusual” event that could serve as a catalyst.

For instance, even if the company has no news, certain penny stocks may show up in a scan for “unusual volume”. This would be relevant for anything like business news.
2. Making New Highs or Lows
On a penny stock chart, the daily range should be taken into account while discussing significant levels. Based on market momentum, you might be able to spot fresh, positive trading chances at daily highs.
Stocks rise for a reason, and if you notice volume increasing concurrently, you can generally bet on the stock making another move. While not infallible, this is one method of locating possible penny stock investments. New daily highs and lows are sought after by some traders, who then designate them as the pivot point to establish an entry-level.
Let’s take the case of a penny stock making its opening morning high. Before purchasing penny stocks, some traders choose to wait for the fall from those highs. The majority of the time, this strategy works. Penny stocks will come back, but if the momentum is really strong, they will then rise again.
In that instance, waiting a little while can put you in a far better cost-average position than making a purchase “at the top”. It’s a similar approach when it comes to new daily lows, only that you’re dealing with a downtrend. Therefore, you should watch to see whether more buyers enter the market when a stock hits a new low. A “bottom bounce” can occasionally be just as beneficial as investing during a bull run.
3. Gaps
Penny stocks that gap can also be an excellent tool to spot chances, similar to highs and lows. On the other side, they can also assist you in averting a negative circumstance.
When the price of penny stocks opens considerably higher or lower than it did the prior session, there is a price gap. The majority of gap scanners will prioritise creating gaps.
One should also note that you shouldn’t purchase anything just because it gaps. These are excellent opportunities for buyers from earlier in the week, month, or year to switch to selling. On the other hand, a gap down does not necessarily indicate that shares are “cheap.” Prices may continue to decline simply because investors are losing faith. If there is a true opportunity in front of you, it will be easier for you to recognise it if you have a basic understanding of the businesses and/or industries in question.
4. Stock News
Are there any company-related or industry-related announcements? A genuine business event, such as FDA approval or a new joint venture, may indicate that the market is positive.
On the other side, it might be speculative if penny stocks are moving without any direct catalyst. Stocks that don’t often trade but get a sympathy trade on speculative grounds won’t typically have a long-lasting bullish trend.
Keep in mind that when it comes to trends, you want to identify stocks with a solid foundation. You should consider these many factors when it comes to penny stock news.
5. Trading Patterns
Gains from penny stocks are highly reliant on rising stock values. Although there are specific situations where you can short penny stocks, the basic rule is to buy low and sell high. Thus, it will be important for you to be able to recognise bullish penny stock chart patterns such as:
1. Bull Flag
Understanding consolidation and continuation is crucial when investing in penny stocks. When there is a significant upward movement, typically in 1-3 green candles, a bull flag chart pattern results. Later, the stock consolidates. We won’t witness “lower lows”; instead, we’ll observe lower highs and steady lows building a flag.
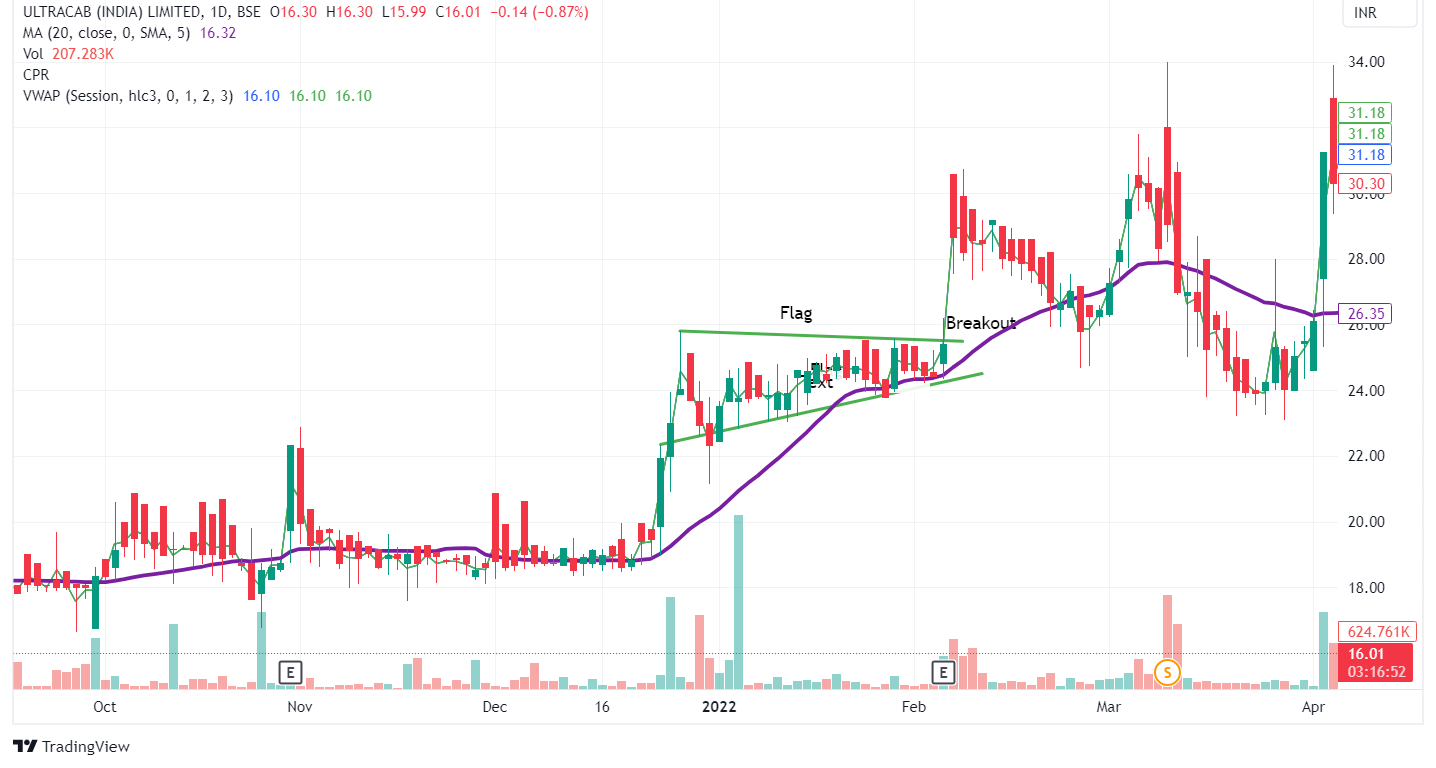
The volume must be high, just like with any other large price change. If a bull flag develops on lower volume, it will probably be more difficult for the stock to truly breakthrough. If a breakout does take place, though, the trend will continue until sellers intervene.
2. Double Bottom
Reversal patterns can be just as profitable for investors as continuation patterns. When the price of a stock hits the same low twice before rising again, it forms a double-bottom penny stock chart pattern. On a stock chart, it typically resembles a “W”.

Investors should ideally start their positions when the stock recovers from the second low. In order to validate an uptrend, traders will also keep an eye on how the stock trades over the coming days.
3. Golden Cross
One of the most sought-after chart patterns is the golden cross. It may also be regarded as a technical indicator. The 50 or 200-day Moving Average, for example, verifies patterns but does not truly foretell them. This is because they are founded on historical data. When the 50-Day Moving Average surpasses the 200-Day Moving Average, a golden cross is formed.
This is viewed as extremely bullish and an indication that a potent uptrend may be developing. The golden cross is used by traders to establish positions for longer-term transactions. In order to validate their decision to purchase penny stocks, seasoned traders will look for additional signs in addition to the golden cross.
Bottomline
With penny stocks, making money appears easy. However, trading them might not be for everybody. You must comprehend risk, have the ability to deal with extreme volatility, and occasionally be able to change your emphasis rapidly.
Frequently Asked Questions (FAQs)
Is Penny Stocks good for beginners?
You don’t need a lot of money to invest in penny stocks. Many can enter the investment world thanks to greater flexibility and cheaper capital requirements. While trading with less money has some advantages, it can be difficult to make large gains with penny stocks.
Is it profitable to buy penny stocks?
Because they have the potential for enormous returns, penny stocks are highly popular among small investors. Gains of up to 500% are possible, or even greater, percentages. You can still make a profit of up to Rs. 500 even with a modest investment of Rs. 100
What are Penny Stocks?
Penny stocks are companies with very low market capitalizations. The market capitalization of a firm is the sum of its trading market-available shares. Low liquidity exists for these stocks. Therefore, it is possible to manipulate the market by either offloading shares to cause price drops or buying a significant amount of shares to cause price spikes.
How do Penny Stocks Work?
You don’t need a lot of money to invest in penny stocks. Many can enter the investment world thanks to greater flexibility and cheaper capital requirements. While trading with less money has some advantages, it can be difficult to make large gains with penny stocks.
What is the difference between penny stocks and stocks?
OTC stocks should only make up a small fraction of any portfolio because they are speculative and should be treated as such. Long-term growth should be consistent and stable with regular stocks. In the short run, penny stocks are for making rapid profits.


