Bank Nifty opened above its 34 DMA (24406 approx). The Index climbed by 361 points from its low and closed above its 5 day EMA ( 24689 approx).
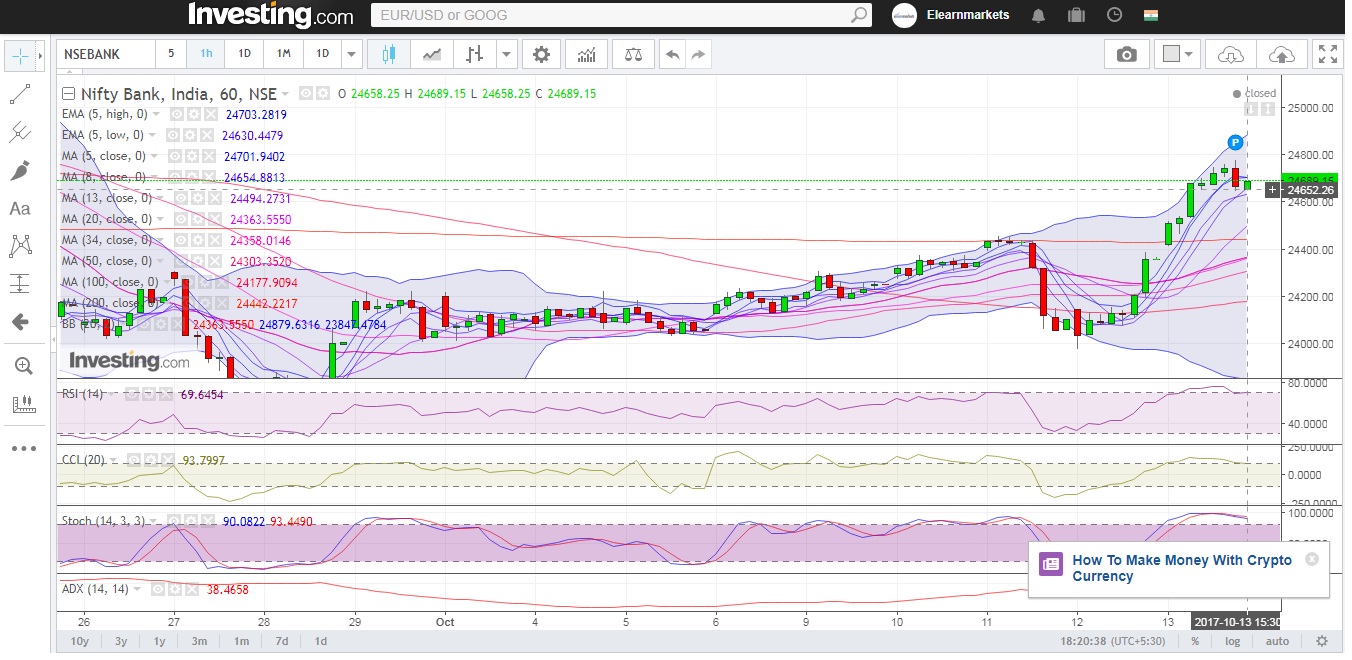
Hourly Technicals:
In the Hourly Chart, Bank Nifty has closed below its 5 hourly high EMA of (24703 approx).The Index is likely to face resistance around the same area. If Bank Nifty breaks and closes below the 8 hourly moving average( 24654 approx), it will find its next support at the 13 hourly moving average ( 24494 approx).
Hourly RSI stands at the higher end of the normal range. CCI however shows that sentiments might are highly positive. The ADX is indicating that volatility is on the cards.
Figure: Bank-Nifty Hourly Chart
Daily Technicals:
The daily chart indicates that Bank Nifty has closed above its 34 DMA of (24406 approx). The Index will face resistance around its intraday high (24477 approx).On the downside however, Bank Nifty will find support around the 50 DMA ( 24396 approx).
The daily RSI and CCI has closed midway between the normal range.The ADX indicates that heavy momentum might not be likely.
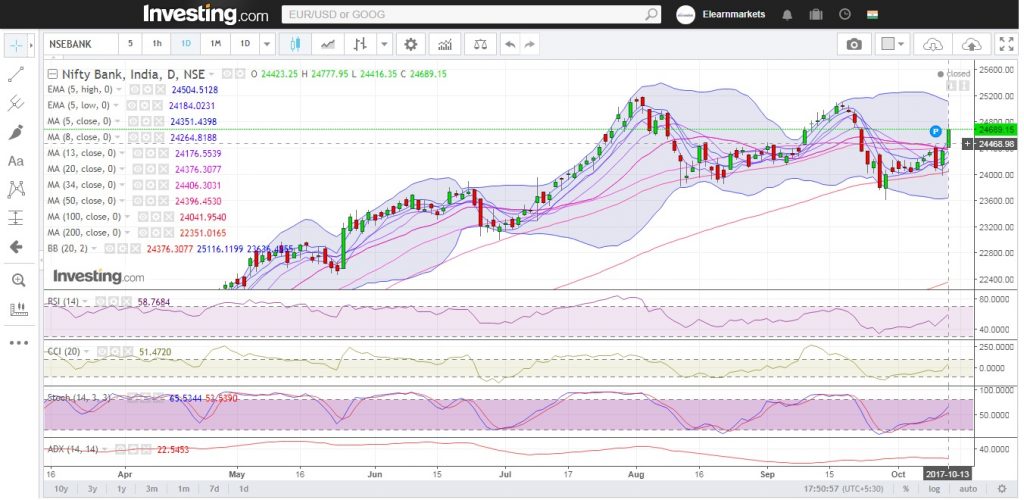
Figure: Bank-Nifty Daily Chart
Weekly Technicals:
In the Weekly Chart, Bank Nifty has closed above its 5 weekly High EMA of (24689 approx).The Index is likely to face immediate resistance around the higher end of the Bollinger Band. If Bank Nifty breaks below its current weekly low (23978 approx), the next support area will be around the 34 weekly moving average(23122 approx).
Weekly RSI and CCI stands at the higher end of the normal range. The ADX is indicating that volatility is on the cards.
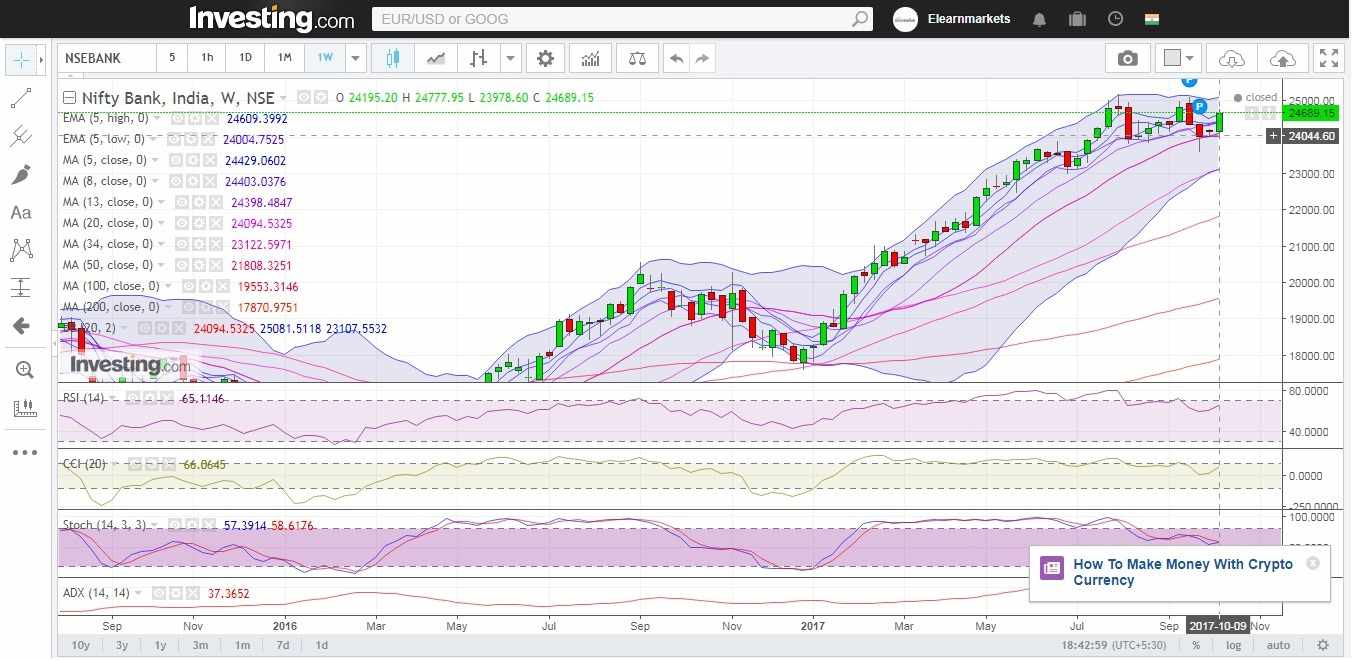
Figure: Bank-Nifty Weekly Chart
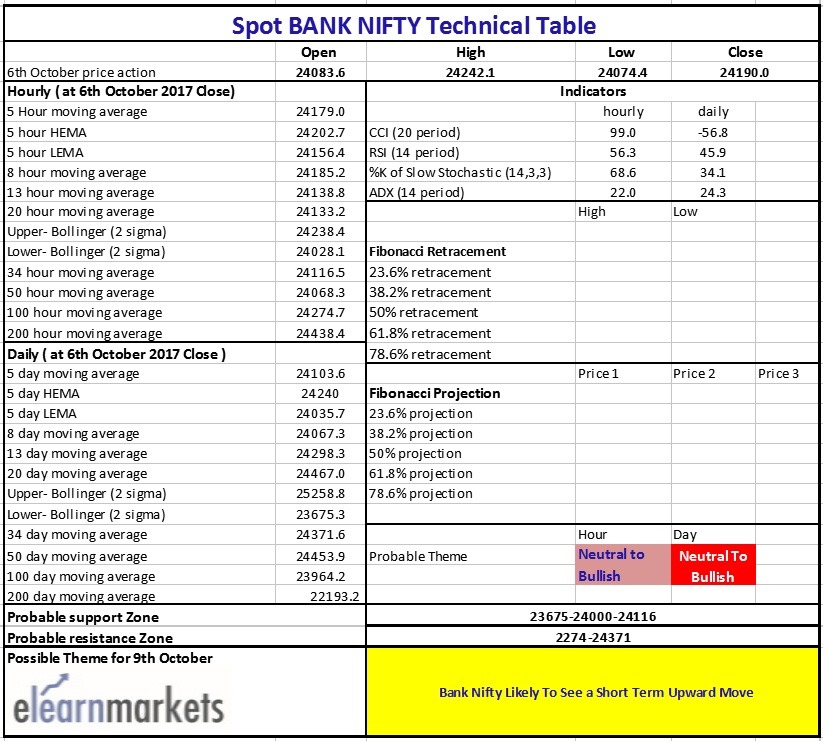
Figure: Bank-Nifty Tech Table
You can also view the Original Report here.


