Elearnmarkets - Financial Market Learning
  • Categories
    • Basic Finance
    • Derivatives
    • Financial Planning
    • Fundamental Analysis
    • Technical Analysis
    • Marketshala
    • Miscellaneous
  • Language
    • English
    • Hindi
    • Bengali
No Result
View All Result
  • Courses
  • Webinars
  • Learn On Elearnmarkets
Elearnmarkets - Learn Stock Market, trading, investing for Free
No Result
View All Result
Home Technical Analysis
Understanding Accumulation and Distribution Line Indicator 1

Understanding Accumulation and Distribution Line Indicator

Elearnmarkets by Elearnmarkets
September 8, 2022
in Technical Analysis
Reading Time: 5 mins read
1
7k
VIEWS
Share on FacebookShare on TwitterShare on WhatsApp

Do you know that Accumulation and Distribution Line Indicator helps us identify divergences between the volume flow and stock prices? Yes! Accumulation and Distribution Line uses price and volume to determine whether the stock is accumulated or distributed.

This volume indicator helps us provide strong insights into whether the stock trend is strong or not. When the Indicator is falling, but the price is increasing, then this suggests that the volume is not strong enough to support the rise in the price and vice versa,

So, in today’s blog, let us discuss the Accumulation and Distribution Line indicator and how to use this Indicator when trading in the stock market:

Table Of Contents
  1. What is Accumulation and Distribution Line Indicator?
  2. How to trade with this Indicator?
  3. Difference between Accumulation and Distribution Line Indicator and On-Balance Volume Indicator
  4. Bottomline

What is Accumulation and Distribution Line Indicator?

The accumulation distribution line indicator is a volume-based indicator formed by the relationship between the price of the stock and volume flow to determine the trend of a stock. The term “accumulation” refers to the level of buying (demand) of a stock, while “distribution” refers to the level of selling (supply). Thus, one can forecast a stock’s future price trend based on its supply and demand pressure.

How to trade with this Indicator?

The A/D Indicator’s main rule is that stock volume comes before price. The number of shares traded is proportional to the stock prices rising and falling. The A/D Indicator, like other volume indicators, predicts volume flow direction. It aids in predicting future stock price movements and thus provides an advantage.

Understanding Accumulation and Distribution Line Indicator 2
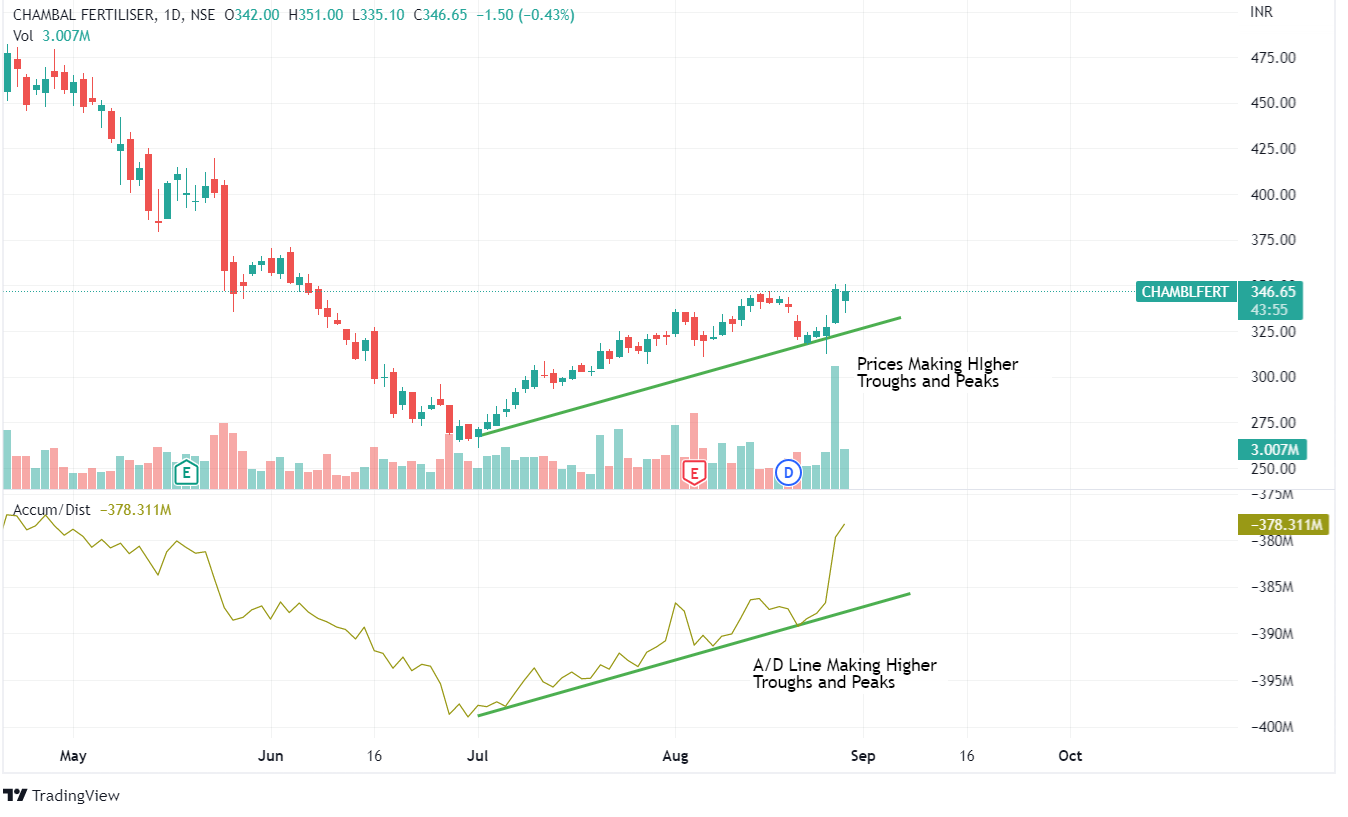
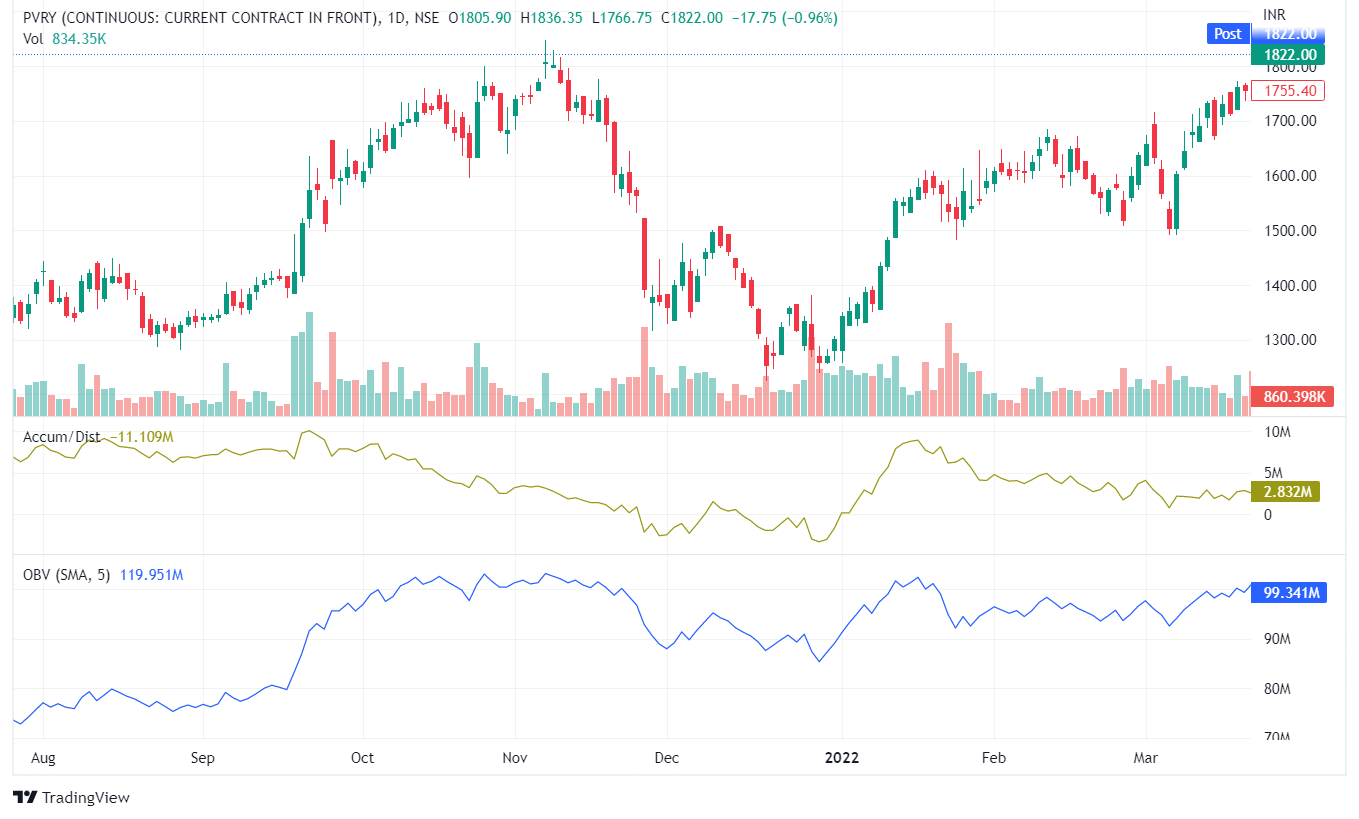
  • When both the Indicator and stock price make higher peaks and through, we may see that the uptrend is going to continue:
Understanding Accumulation and Distribution Line Indicator 3
  • When both the Indicator and stock price make lower peaks and through, we may see that the downtrend is going to continue:
Understanding Accumulation and Distribution Line Indicator 4
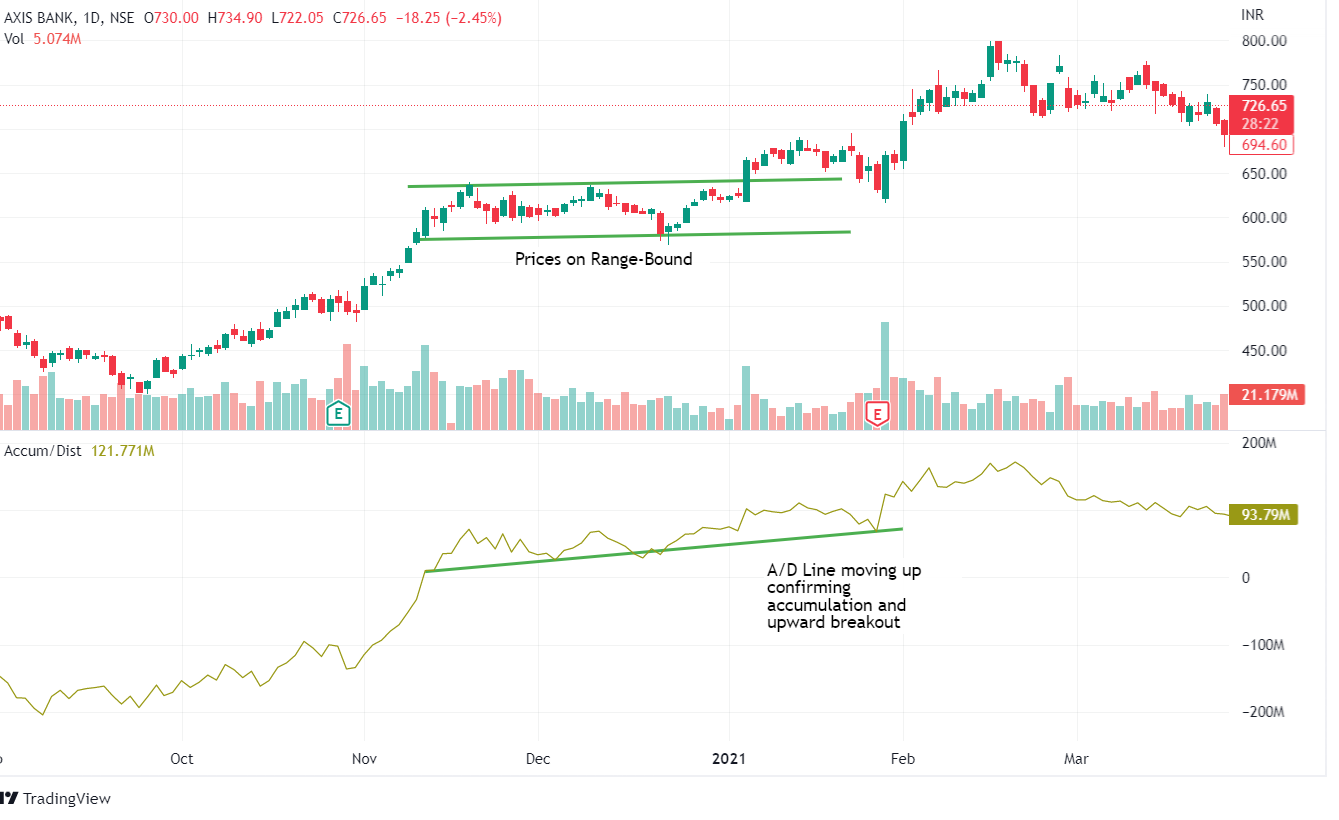
  • During the range-bound market, when the A/D line starts increasing, then we may say there is accumulation in the stock, and the stock may break out in the up direction:
Understanding Accumulation and Distribution Line Indicator 5
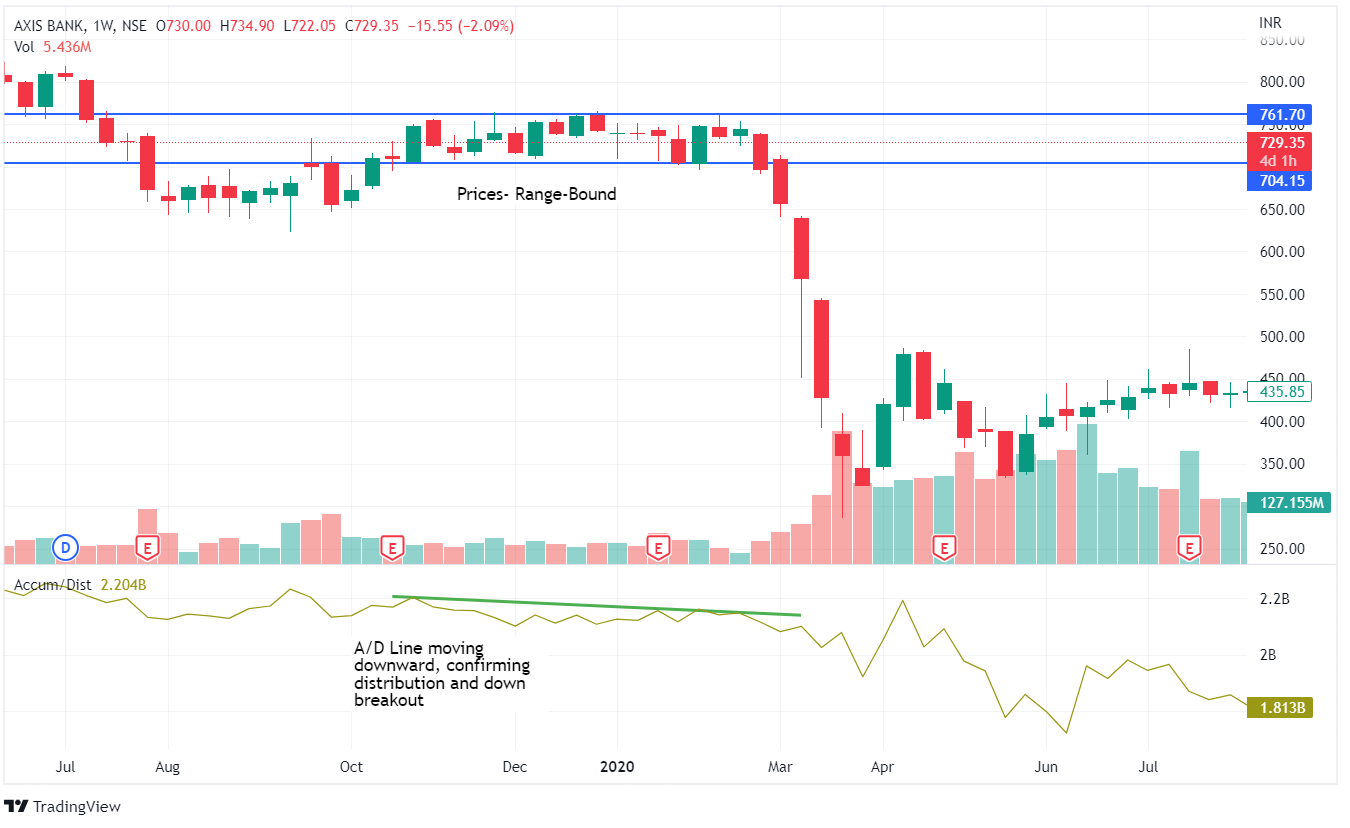
  • During the range-bound market, when the A/D line starts decreasing, then we may say there is distribution in the stock, and the stock may break out in the down direction:
Understanding Accumulation and Distribution Line Indicator 6
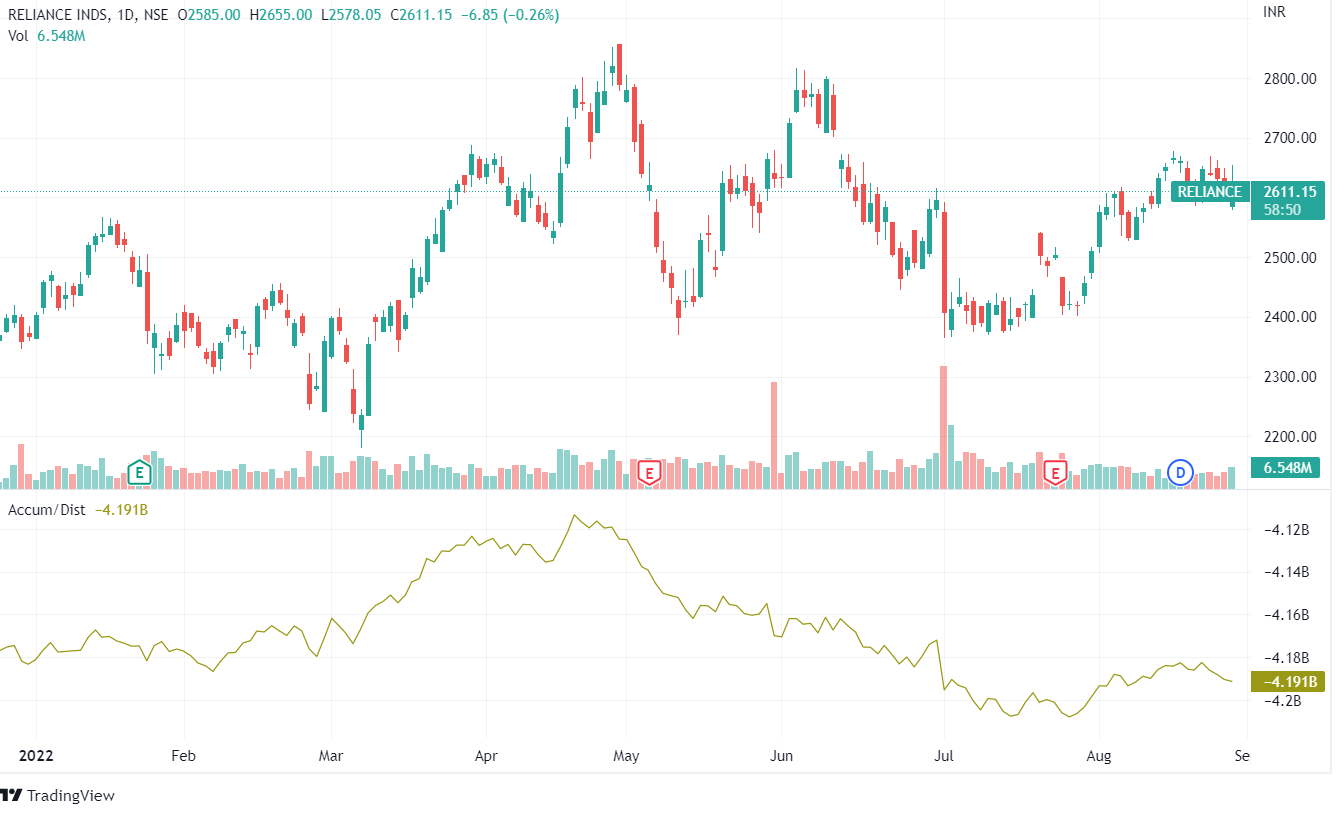
  • When A/D Line makes lower highs, but prices make higher highs, then we may there is negative divergence, and the stock may reverse to a downtrend:
Understanding Accumulation and Distribution Line Indicator 7
  • When A/D Line makes higher highs, but prices make lower highs, then we may there is positive divergence, and the stock may reverse to an uptrend:
Understanding Accumulation and Distribution Line Indicator 8

You can also read our blog on 9 Types of Volume Indicator a trader should know

Difference between Accumulation and Distribution Line Indicator and On-Balance Volume Indicator

Both of these technical indicators, albeit slightly different, use price and volume. On Balance Volume Indicator measures whether the current closing price is higher or lower than the previous close. If the close is higher, the volume of the period is added. If the close is lower, the volume of the period is subtracted.

Join TMP Join TMP Join TMP
accumulation and distribution

The A/D Indicator ignores the previous close and employs a multiplier based on where the price closed within the period’s range. As a result, the indicators use different calculations and may provide different results.

You can also join our course on Certification In Online Technical Analysis

Bottomline

An uptrend indicates that buying pressure is present consistently, whereas a downtrend indicates that selling pressure is present. Bullish and bearish divergences alert for a potential reversal on the price chart. The Accumulation Distribution Line, like all indicators, should be used with other aspects of technical analysis, such as oscillators and chart patterns. It is not a stand-alone metric.

We hope you found this blog informative and use it to its maximum potential in the practical world. Also, show some love by sharing this blog with your family and friends and helping us in our mission of spreading financial literacy.

Happy Investing!

Tags: basicenglishtechnical analysis
ShareTweetSend
Previous Post

Trading with Volume Profile

Next Post

5 Trading Strategies using Relative Strength Index

Elearnmarkets

Elearnmarkets

Elearnmarkets (ELM) is a complete financial market portal where the market experts have taken the onus to spread financial education. ELM constantly experiments with new education methodologies and technologies to make financial education effective, affordable and accessible to all. You can connect with us on Twitter @elearnmarkets.

Related Posts

Technical Analysis in Stock Trading 9
Technical Analysis

Technical Analysis in Stock Trading

May 31, 2023
6.2k
The Ultimate guide to Trading Divergences 10
Technical Analysis

The Ultimate guide to Trading Divergences

May 26, 2023
1k
Trading Psychology: Guide to Master Your Mind in 5 Steps 11
Technical Analysis

Trading Psychology: Guide to Master Your Mind in 5 Steps

May 24, 2023
3.1k
Trading Psychology: 7 Keys to Successful Trading 12
Technical Analysis

Trading Psychology: 7 Keys to Successful Trading

May 22, 2023
3k

Comments 1

  1. Ramanand says:
    8 months ago

    good article

    Reply

Leave a Reply Cancel reply

Your email address will not be published. Required fields are marked *

Follow Us

Facebook-f Twitter Instagram Linkedin-in Youtube Telegram

Register on Elearnmarkets

Continue your financial learning by creating your own account on Elearnmarkets.com

Register Free Account

Download App

Categories

  • Basic Finance
  • Derivatives
  • Financial Planning
  • Fundamental Analysis
  • Technical Analysis
  • Marketshala
  • Miscellaneous

Popular On Elearnmarkets

  • Market Superheroes:
  • Vivek Bajaj
  • Chetan Panchamia
  • Ashish Kyal
  • Premal Parekh
  • Abhijit Paul
  • Jegan
  • Sivakumar Jayachadran
  • Vishal Malkan
  • Jyoti Budhia
  • Vivek Gadodia
  • Vishal Mehta
  • Piyush Chaudhry
  • Santosh Pasi
  • Gomathi Shankar
  • Market Superheroes:
  • Vivek Bajaj
  • Chetan Panchamia
  • Ashish Kyal
  • Premal Parekh
  • Abhijit Paul
  • Jegan
  • Sivakumar Jayachadran
  • Vishal Malkan
  • Jyoti Budhia
  • Vivek Gadodia
  • Vishal Mehta
  • Piyush Chaudhry
  • Santosh Pasi
  • Gomathi Shankar
  • Courses:​
  • Options Trading
  • Dow Theory
  • Momentum Trading
  • Stock Investing
  • Stock Market for Beginners
  • Harmonic Chart Patterns
  • Algo Trading
  • Elliot Wave Theory
  • Advanced Excel
  • Cryptocurrency
  • NSE Certification Course
  • Courses:​
  • Options Trading
  • Dow Theory
  • Momentum Trading
  • Stock Investing
  • Stock Market for Beginners
  • Harmonic Chart Patterns
  • Algo Trading
  • Elliot Wave Theory
  • Advanced Excel
  • Cryptocurrency
  • NSE Certification Course
  • Webinars:
  • Bank Nifty Scalping
  • Intraday Trading Strategies
  • Options Trading Strategies
  • Options selling
  • Price Action
  • Relative Strength
  • Tax Planning
  • Options Buying
  • Growth Stocks
  • Portfolio Management
  • Relative Strength Index
  • Risk Management
  • Renko Charts
  • Crude Oil
  • Traders Psychology
  • Moving Average
  • Multibagger Stocks
  • Free Learning Modules:
  • Intraday Trading
  • Options Scalping
  • Swing Trading
  • Financial Modelling
  • RSI Indicator
  • Bollinger Bands
  • Pricing of Futures
  • Personal Finance
  • Initial Public Offerings (IPO)
  • Value Investing
  • Technical Indicators
  • Candlesticks
  • Chart Patterns
  • Option Greeks
  • ELSS Funds
  • Banking and Insurance
  • Real Estate
  • Gold
  • Book Summaries:
  • Rich Dad Poor Dad
  • Psychology of Money
  • The Intelligent Investor
  • The Richest Man in Babylon
  • Think and Trade Like a Champion
  • Value Investing and Behavioural Finance
  • Trading in the Zone
  • Learn to Earn
  • Book Summaries:
  • Rich Dad Poor Dad
  • Psychology of Money
  • The Intelligent Investor
  • The Richest Man in Babylon
  • Think and Trade Like a Champion
  • Value Investing and Behavioural Finance
  • Trading in the Zone
  • Learn to Earn
  • Tools:
  • CAGR Calculator
  • SIP Calculator
  • eLearnOptions
  • Future Value Calculator
  • Present Value Calculator
  • Atal Pension Yojana
  • Cost of Delay Calculator
  • Become a Crorepati
  • Tools:
  • CAGR Calculator
  • SIP Calculator
  • eLearnOptions
  • Future Value Calculator
  • Present Value Calculator
  • Atal Pension Yojana
  • Cost of Delay Calculator
  • Become a Crorepati

© 2023 Elearnmarkets. All Rights Reserved

  • Visit Elearnmarkets
  • Courses
  • Webinars
  • Financial Guides
  • Get Free Counselling
  • Visit Elearnmarkets
  • Courses
  • Webinars
  • Financial Guides
  • Get Free Counselling

Get Elearnmarkets App

No Result
View All Result
  • Article Categories
    • Basic Finance
    • Derivatives
    • Financial Planning
    • Fundamental Analysis
    • Technical Analysis
    • Marketshala
    • Miscellaneous
  • Language
    • Hindi
    • Bengali
    • English
  • Courses
  • Webinars

© 2020 Elearnmarkets All Rights Reserved