Elearnmarkets - Financial Market Learning
  • Courses
  • Webinars
  • Stories
  • Language
    • English
    • Hindi
    • Bengali
No Result
View All Result
Get Free Course
  • Basic Finance
  • Derivatives
    • Futures
    • Options
  • Financial Planning
  • Fundamental Analysis
  • Technical Analysis
  • Mutual Funds
  • Marketshala
  • Miscellaneous
Elearnmarkets - Learn Stock Market, trading, investing for Free
  • Courses
  • Webinars
  • Stories
  • Language
    • English
    • Hindi
    • Bengali
No Result
View All Result
Get Free Course
Elearnmarkets - Learn Stock Market, trading, investing for Free
No Result
View All Result
Home Technical Analysis
Advance Volume Spread Analysis of Big Players in Stock Market by Mr Karthik Ramachandan

Advance Volume Spread Analysis of Big Players in Stock Market by Mr Karthik Ramachandan

Elearnmarkets by Elearnmarkets
December 20, 2023
in Technical Analysis
Reading Time: 7 mins read
0
12.3k
VIEWS
Share on FacebookShare on XShare on WhatsApp

In an interesting session as a part of the highly popular Face2Face series, conducted by Elearnmarkets, Mr Vivek Bajaj, Co-founder of Elearnmarkets, invited Mr Karthik Ramachandan, a successful stock market investor with many years of experience, to decode the Advance Volume Analysis of Big Players in Stock Market.

Mr Karthik Ramachandan is an engineer passionate about Technical Analysis and practising for more than 15 years. He is also a keen practitioner of Volume Spread Analysis (VSA). 

He provided the first free VSA application on the Amibroker charting platform, which was ported to many other platforms, including a few commercial ones and now on Trading view. 

In this blog, we will discuss about the behaviour and pattern of trading of the big bulls of the market. In addition, in this blog, we will discuss advanced volume analyses used by the big players in the financial sector.

Table Of Contents
  1. What is Volume Spread Analysis?
  2. Practical Application of Volume Spread Analysis
  3. Trade Example-Sign of Weakness
  4. You can watch the entire Face2Face video here
  5. Bottomline

What is Volume Spread Analysis?

Volume Spread Analysis/Volume Threat Analysis/VPA attempts to read the action of the smart money or the strong hands by reading the price action with three parameters: the close of the price, the spread, and the volume.

The basic premise for this Volume Spread Analysis is that the market is being manipulated by smart money it was in the early 1940s Richard Wyckoff, promoted this idea.

He called it, of course, the smart money as a composite man, so he says that they are sitting behind and manipulating the market to your disadvantage, but if you understand how we place it, you can take advantage of that.

We are trying to do this here, and we are trying to understand the smart money more and follow them, so you know it’s like swimming with the sharks.

So, when smart money makes money so we can, that is the basic idea behind the volume spread analysis.

volume spread analysis

There are four phases of manipulation:

  1. Accumulation
  2. Markup
  3. Distribution
  4. Mark Down

Let us look at the practical application of volume spread analysis:

Practical Application of Volume Spread Analysis

Before we go into the practical applications, let’s look at some assumptions or the definitions that will help our analysis.

Advance Volume Spread Analysis of Big Players in Stock Market by Mr Karthik Ramachandan 1
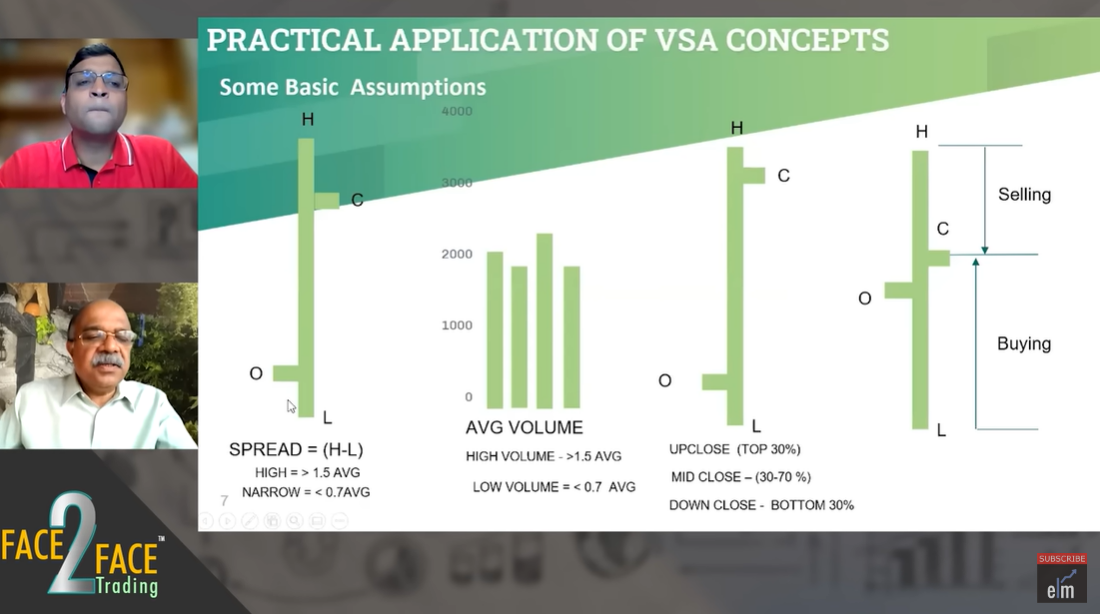
  • Spread- This is the difference between high and low.
  • Average Volume- We take an average of the spread for the last 60 days, and that will be our average spread and any spread which is more than 1.5 per cent 1.5 times of the average we call high and which is less than 0.7 of the average we call it low or small spread.
  • Up/Mid/Down Close– We need to see where the closes now- up close is it is closing in the upper side near the high we say it up close, and if it is in the middle, then we call it the mid close and if it is in the lower side, we call it the down close.
  • Buying/Selling Pressure: In the particular bar, we take the high minus close as the selling pressure and the close minus low as the buying pressure.

Trade Example-Sign of Weakness

Various types of bars show us weakness in the index or a particular stock:

Advance Volume Spread Analysis of Big Players in Stock Market by Mr Karthik Ramachandan 2

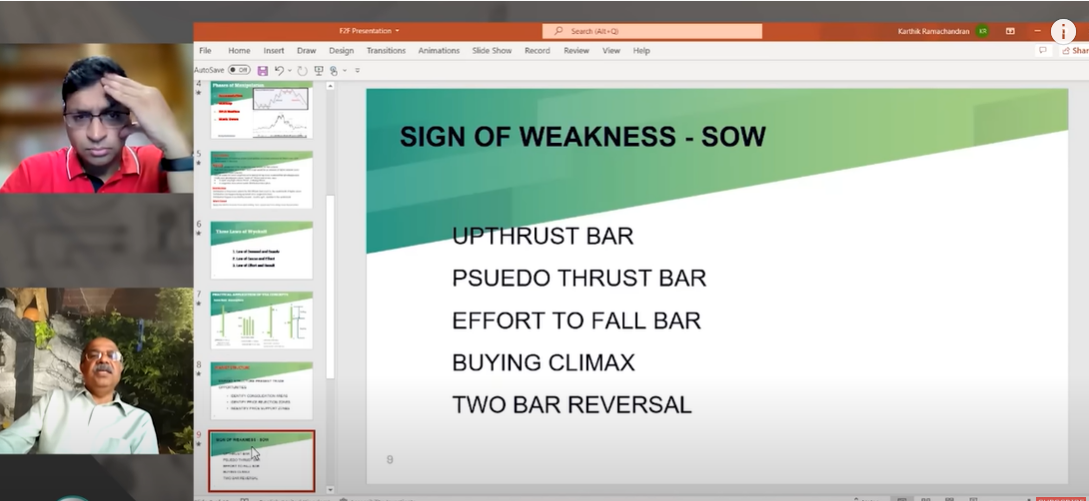
The UpThurst bar is a wide widespread bar; the close is always at the low or near them, and the volume will be high, which normally happens after an upboard or moving into new territory.

It mostly happens after a widespread volume. So let us discuss real-life situations. So let us go to the trading view, where he will show us his software script, which is called VPA 5 point.

Advance Volume Spread Analysis of Big Players in Stock Market by Mr Karthik Ramachandan 3

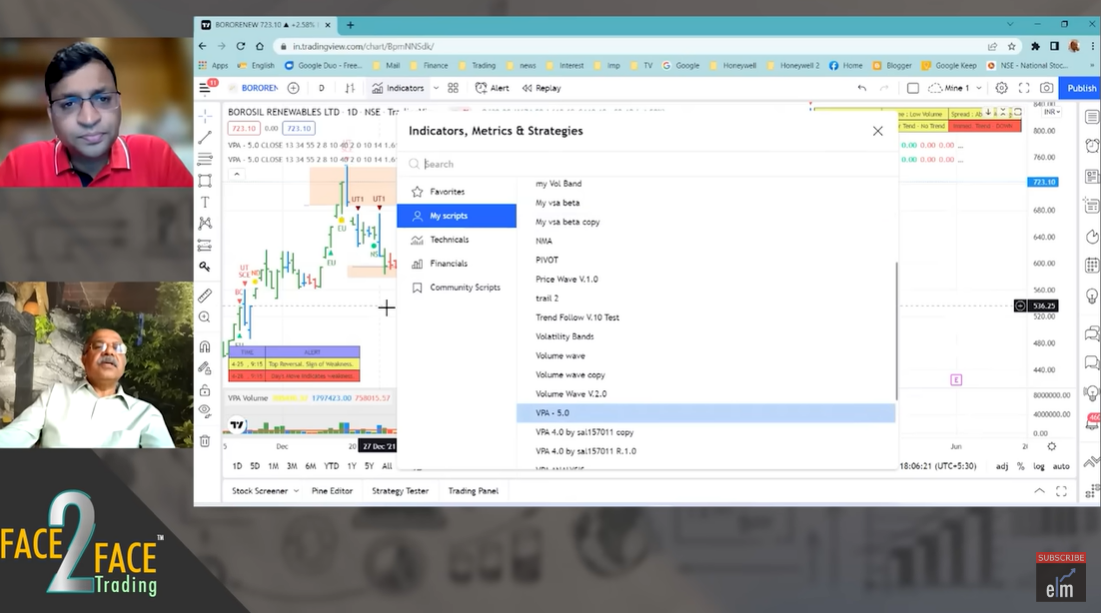
Anybody can search that VPA five-point and a supporting VPA volume. So you can plot these two, and this has got all the necessary information we need.

We need information about the close of the bar right and the high or low volume. This volume and the spread, whether the spread is above average high or low, all this information, so we get here and also he has added some on the trend whether it is a major trend, a minor trend, or any intermediate trend.

You can change the background and show what is called a trend band. This trend information is already available here, so this is redundant. There’s a strength band here; this shows the strength of the bar.

Advance Volume Spread Analysis of Big Players in Stock Market by Mr Karthik Ramachandan 4

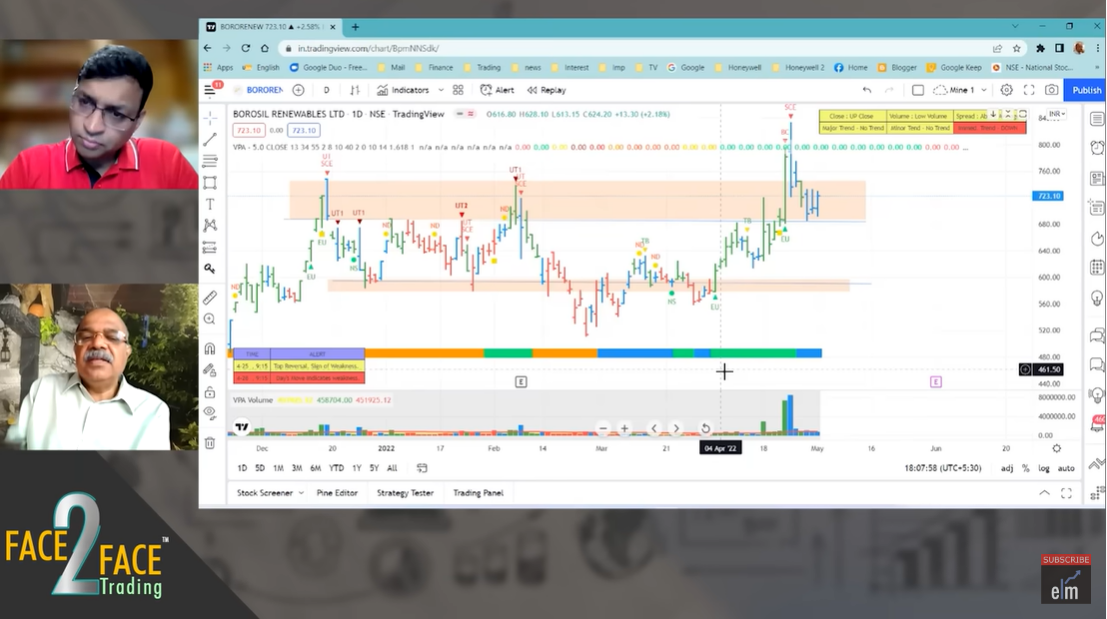
You see, the red one is bearishness or weakness, and you can say the green is strength, and the blue is to be a transition.

The same applies to the bars between these two strengths and weaknesses. Finally, you can add three EMAs that show you a lot of information on whether it is an uptrend or weakening.

Advance Volume Spread Analysis of Big Players in Stock Market by Mr Karthik Ramachandan 5

This is a Upthtust bar, it opened here, moved up to the high here and then came down, and it closed in the low, and you have a very high volume. So this is a typical Upthrust bar where you know when it’s. You had a very wide up bar here, so people feel it is bullish, so the next bar opens higher than the previous one.

Many retail people get in here, so you know the fear of missing out happens and then also this they think it’s a big breakout happening so everybody gets in here and then the is marked down, and it closes below so this is a typical Upthrust bar.

You can also join our course on Certification In Online Technical Analysis

It gapped up, and then it closed down here, so this is like right from the beginning, a lot of selling has been happening, but if you look at intraday.

Maybe the selling happened much later to bring the price down when many people have gotten it, so this is like trapping.

You can watch the entire Face2Face video here

Bottomline

We hope you found this blog informative and use it to its maximum potential in the practical world. Also, show some love by sharing this blog with your family and friends and helping us in our mission of spreading financial literacy.

Happy Investing!

You can also visit web.stockedge.com, a unique platform that is 100% focused on research and analytics.

Tags: englishFace2Face seriestechnical analysisvolume spread analysis
ShareTweetSend
Get Kotak Offer Get Kotak Offer Get Kotak Offer
Previous Post

Relative Strength Index (RSI) Range Shift- A Simple but Effective Trading Strategy

Next Post

Relative Strength Strategy by Mr Matthew Caruso

Elearnmarkets

Elearnmarkets

Elearnmarkets (ELM) is a complete financial market portal where the market experts have taken the onus to spread financial education. ELM constantly experiments with new education methodologies and technologies to make financial education effective, affordable and accessible to all. You can connect with us on Twitter @elearnmarkets.

Related Posts

Understand Slippage in Trading
Technical Analysis

What is Slippage in Trading? Meaning & Examples

March 28, 2025
307
Breakout trading strategies
Technical Analysis

Top 5 Breakout Trading Strategies

March 12, 2025
1.1k
5 stocks for today
Technical Analysis

5 Stocks to Buy Today That Could Beat the NIFTY in 2025!

May 5, 2025
404
Image describing What is marginal trading facility
Technical Analysis

 What is a Margin Trading Facility? Advantages & Risks

April 4, 2025
665

Leave a Reply Cancel reply

Your email address will not be published. Required fields are marked *

Disclaimer

Elearnmarkets (Kredent InfoEdge Pvt. Ltd.) is a SEBI-registered Research Analyst (RA) entity (SEBI Registration No.: INH300007493). The information provided in this article is for educational and informational purposes only and should not be considered as an offer to buy or sell any securities or investment products.

The stocks, securities, and investment instruments mentioned herein are not recommendations under SEBI (Research Analysts) Regulations, 2014. Readers are advised to conduct their own due diligence and seek independent financial advice before making any investment decisions.

Investments in securities markets are subject to market risks. Please read all related documents carefully before investing. Investing in Equity Shares,
Derivatives, Mutual Funds, or other instruments carry inherent risks, including potential loss of capital. Elearnmarkets (Kredent InfoEdge Pvt. Ltd.) does not provide any guarantee or assurance of returns on any investments. Past performance is not indicative of future performance.

Elearnmarkets Logo

Follow Us

Facebook-f X-twitter Instagram Linkedin-in Youtube Telegram

Register on Elearnmarkets

Continue your financial learning by creating your own account on Elearnmarkets.com

Register Free Account

Download App

Playstore logo
Download on app store

Categories

  • Basic Finance
  • Derivatives
  • Financial Planning
  • Fundamental Analysis
  • Technical Analysis
  • Mutual Funds
  • Miscellaneous

Popular On Elearnmarkets

  • Market Superheroes:
  • Vivek Bajaj
  • Chetan Panchamia
  • Ashish Kyal
  • Premal Parekh
  • Abhijit Paul
  • Jegan
  • Sivakumar Jayachadran
  • Jyoti Budhia
  • Vivek Gadodia
  • Vishal Mehta
  • Piyush Chaudhry
  • Santosh Pasi
  • Gomathi Shankar
  • Market Superheroes:
  • Vivek Bajaj
  • Chetan Panchamia
  • Ashish Kyal
  • Premal Parekh
  • Abhijit Paul
  • Jegan
  • Sivakumar Jayachadran
  • Jyoti Budhia
  • Vivek Gadodia
  • Vishal Mehta
  • Piyush Chaudhry
  • Santosh Pasi
  • Gomathi Shankar
  • Courses:​
  • Options Trading
  • Dow Theory
  • Momentum Trading
  • Stock Investing
  • Harmonic Chart Patterns
  • Algo Trading
  • Elliot Wave Theory
  • Advanced Excel
  • Cryptocurrency
  • NSE Certification Course
  • Courses:​
  • Options Trading
  • Dow Theory
  • Momentum Trading
  • Stock Investing
  • Harmonic Chart Patterns
  • Algo Trading
  • Elliot Wave Theory
  • Advanced Excel
  • Cryptocurrency
  • NSE Certification Course
  • Webinars:
  • Bank Nifty Scalping
  • Intraday Trading Strategies
  • Options Trading Strategies
  • Options selling
  • Price Action
  • Relative Strength
  • Tax Planning
  • Options Buying
  • Growth Stocks
  • Portfolio Management
  • Risk Management
  • Renko Charts
  • Crude Oil
  • Traders Psychology
  • Moving Average
  • Multibagger Stocks
  • Free Learning Modules:
  • Intraday Trading
  • Options Scalping
  • Swing Trading
  • Financial Modelling
  • RSI Indicator
  • Bollinger Bands
  • Pricing of Futures
  • Personal Finance
  • Initial Public Offerings (IPO)
  • Value Investing
  • Technical Indicators
  • Candlesticks
  • Chart Patterns
  • Option Greeks
  • ELSS Funds
  • Banking and Insurance
  • Real Estate
  • Gold
  • Book Summaries:
  • Rich Dad Poor Dad
  • Psychology of Money
  • The Intelligent Investor
  • The Richest Man in Babylon
  • Think and Trade Like a Champion
  • Value Investing and Behavioural Finance
  • Trading in the Zone
  • Learn to Earn
  • Book Summaries:
  • Rich Dad Poor Dad
  • Psychology of Money
  • The Intelligent Investor
  • The Richest Man in Babylon
  • Think and Trade Like a Champion
  • Value Investing and Behavioural Finance
  • Trading in the Zone
  • Learn to Earn
  • Tools:
  • CAGR Calculator
  • SIP Calculator
  • eLearnOptions
  • Future Value Calculator
  • Present Value Calculator
  • Atal Pension Yojana
  • Cost of Delay Calculator
  • Become a Crorepati
  • Tools:
  • CAGR Calculator
  • SIP Calculator
  • eLearnOptions
  • Future Value Calculator
  • Present Value Calculator
  • Atal Pension Yojana
  • Cost of Delay Calculator
  • Become a Crorepati

© 2025 Elearnmarkets. All Rights Reserved

  • Visit Elearnmarkets
  • Courses
  • Webinars
  • Financial Guides
  • Get Free Counselling
  • Visit Elearnmarkets
  • Courses
  • Webinars
  • Financial Guides
  • Get Free Counselling

Download Our App

No Result
View All Result
  • Article Categories
    • Basic Finance
    • Derivatives
    • Financial Planning
    • Fundamental Analysis
    • Technical Analysis
    • ETFs & Mutual Funds
    • Marketshala
    • Miscellaneous
  • Language
    • Hindi
    • Bengali
    • English
  • Courses
  • Webinars
  • Stories
Get Free Course

© 2024 Elearnmarkets All Rights Reserved

A Handbook of Technical Analysis
To start your trading journey as a seasoned technical analyst
Download Guide For FREE
Trading Mentorship Program