
Inverted Hammer Candlestick Patterns represent moments when the market’s direction suddenly shifts. Rather than thinking of these as abstract chart formations, consider them as a three-act story where traders’ psychology flips sentiment changes so dramatically that it creates a visible pattern on your chart.
These patterns emerge from basic market dynamics. A strong move in one direction meets resistance, gets engulfed by the opposite momentum, and then continues in the new direction.
Formation of Inverted Hammer Candlestick Pattern
The Inverted Hammer candlestick pattern has a long shadow at the top, and there is no shadow at the bottom. The length of the long shadow is usually twice the height of the real body of the candlestick, as shown below:
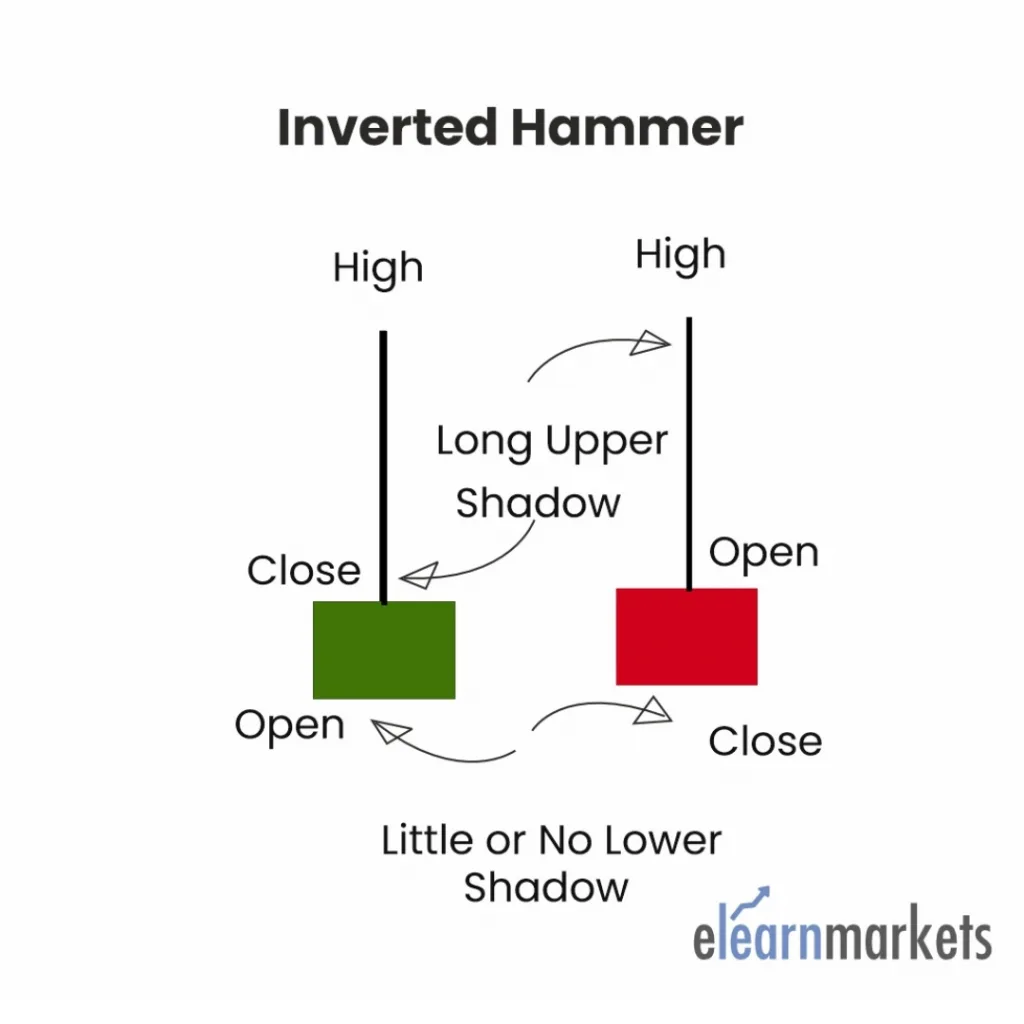
This candlestick is formed when bullish traders start to gain confidence after sellers have pushed the prices downwards. The upper shadow is formed when the bulls try to push the price up, whereas the lower part of the shadow is formed by the bears, who try to resist the higher price. However, the pressure from the bulls is strong enough to close at a higher price.
Also Read: 7 Powerful Continuation Candlestick Patterns
Two variations exist depending on whether the reversal flows upward or downward.
Three Outside Up: When Bears Lose Control
What Happens
This pattern typically emerges after a downtrend has worn out its energy. It unfolds across three candles:
Act One (Bearish Candle): The market drops, reinforcing downward momentum. Sellers are in control, confidence among bears is building.
Act Two (Large Bullish Candle): Without warning, buyers flood the market. This candle opens low but reverses sharply, rising so high that it completely contains the previous bearish candle within its body. This is the critical moment, bears get caught off guard.
Act Three (Higher Bullish Candle): Momentum continues upward. The third candle closes above the second, confirming that the reversal is genuine and not just a false spike.
Why It Matters
The size of the second candle determines the pattern’s significance. A massive engulfing candle indicates strong buying pressure overwhelming previous sellers. A smaller engulfing candle suggests less conviction in the reversal.
Think of it as a tug-of-war where one team suddenly pulls much harder than expected—the bigger the pull, the clearer the momentum shift.
Three Outside Down: When Bulls Stumble
What Happens
This is the inverse pattern, typically appearing after an uptrend has exhausted itself. Again, three candles tell the story:
Act One (Bullish Candle): The market rises, maintaining buyer enthusiasm and confidence.

Act Two (Large Bearish Candle): Sellers emerge unexpectedly and gain control. This candle opens high but reverses hard, falling enough to fully engulf the previous bullish candle. The shift is sudden and powerful.
Act Three (Lower Bearish Candle): The decline continues. The third candle closes below the second, confirming that selling pressure has taken over.
Why It Matters
Just like its counterpart, the power of this pattern depends on how aggressively the second candle reverses. A sweeping bearish candle that engulfs significant bullish price action signals genuine exhaustion among buyers.
The Psychology Behind the Pattern
When the Inverted Hammer candlestick pattern forms, it shows that the bulls are back in the market and have started putting buying pressure to make the prices rise high, and bears are unable to bring the price down.
If the price maintains its strength even in the next trading session, one can enter the buy position.
Practical Considerations for Traders
The three outside pattern works best as a confirmation signal rather than a standalone trade trigger. Market reversals are significant events, so relying solely on one pattern can be risky. Effective traders typically combine these observations with other technical signals, support and resistance levels, volume confirmation in Trading, or momentum indicators to increase confidence before acting.
The timing of these patterns matters too. In choppy, sideways markets, they may be false signals. In clear trending markets, they’re more reliable indicators of actual directional change.
Bottom Line
Three outside patterns offer a structured way to recognize when the market’s psychology is shifting. They’re not predictive magic; they’re a visual record of when enough traders changed their minds at the same moment. When combined with broader market context and additional technical analysis, they become a useful tool for identifying potential reversals worth trading.
You can also use technical scans to filter out stocks for trading the next day by using StockEdge, now also available in the web version.
Read More- All 35 Candlestick Chart Patterns in the Stock Market
Frequently Asked Questions (FAQs)
1. What exactly makes a candlestick pattern “three outside”?
The defining characteristic is the engulfment in the second candle combined with directional continuation in the third. The first candle sets the initial trend, the second candle completely contains the first candle’s body (the main price range, not including wicks), and the third candle extends beyond the second in the same direction as the reversal. It’s this specific three-candle sequence that distinguishes it from other patterns.
2. How reliable are these patterns for predicting reversals?
They’re reasonably reliable indicators when they appear in trending markets, but they’re far from foolproof. Their effectiveness increases significantly when confirmed by other technical signals – volume spikes, support/resistance levels, or momentum indicators. Using them as your sole trading signal is risky. Many false signals occur in sideways or choppy markets.
3. What’s the difference between the three outside pattern and the engulfing pattern?
The engulfing pattern involves just two candles – a candle that gets completely engulfed by the next one. The three outside pattern requires that the third candle continue in the reversal direction, confirming that the reversal has actual momentum behind it. The third candle is what separates a potential reversal from an actual one.
4. Does the size of the second candle really matter that much?
Absolutely. A larger engulfing candle (the second one) indicates stronger buying or selling pressure depending on the pattern. It shows more decisive sentiment change. A smaller engulfing candle suggests weaker conviction in the reversal. When evaluating pattern strength, the size of that middle candle is one of your best clues about how serious the reversal might be.
5. How does the three gaps rule relate to three outside patterns?
They’re completely different patterns. The three gaps rule involves multiple gap formations (price jumps between candle sessions) separated by candles in the same direction, occurring during ongoing trends. Three outside patterns involve engulfment and reversal during trend changes. Don’t confuse the two; they signal different market conditions.
6. Can these patterns appear in all timeframes?
Yes. You’ll find three outside patterns on daily, weekly, hourly, or even minute charts. However, they tend to be more reliable on longer timeframes because they involve more significant price moves and represent more meaningful sentiment shifts. On very short timeframes, false signals become more common.


