Elearnmarkets - Financial Market Learning
  • Courses
  • Webinars
  • Stories
  • Language
    • English
    • Hindi
    • Bengali
No Result
View All Result
Get Free Course
  • Basic Finance
  • Derivatives
    • Futures
    • Options
  • Financial Planning
  • Fundamental Analysis
  • Technical Analysis
  • Mutual Funds
  • Marketshala
  • Miscellaneous
Elearnmarkets - Learn Stock Market, trading, investing for Free
  • Courses
  • Webinars
  • Stories
  • Language
    • English
    • Hindi
    • Bengali
No Result
View All Result
Get Free Course
Elearnmarkets - Learn Stock Market, trading, investing for Free
No Result
View All Result
Home Technical Analysis
How to filter stock for Intraday Trading? 1

How to filter stock for Intraday Trading?

Elearnmarkets by Elearnmarkets
March 5, 2025
in Technical Analysis, Charts, Patterns & Indicators
Reading Time: 11 mins read
5
28.9k
VIEWS
Share on FacebookShare on XShare on WhatsApp

Hindi: आप इस लेख को हिंदी में भी पढ़ सकते है|

  • Intraday Trading is mainly about buying and selling the stock on the same day.
  • Filtering stocks for intraday trading is based on High Liquidity, Medium to High Liquidity, Mimicking the Index and Sectoral Breakout.
  • One can also filter stocks for intraday trading by looking at the stocks of the peer group.
  • Momentum stocks can be filtered for intraday trading using NSE and NSE India or economic times.
  • You can also create your own technical filter to filter out stocks for next trading day by using StockEdge App.

Intraday trading or Day trading as the same suggest involves buying and selling of securities on the same day.

In simple words, there isn’t any change in share ownership as a result of trade and before the market closing; all the positions are squared off.

Table of Contents
Parameters to filter stocks for Intraday Trading
  • High Liquidity
  • Medium to high volatility Stocks are good for Intraday Trading
  • Mimicking the index
  • Sectoral breakout is a good approach to filter out stocks for Intraday Trading
  • Looking for other stocks in the sector when the leaders have started to move
Ways to find out momentum stocks in Intraday Trading

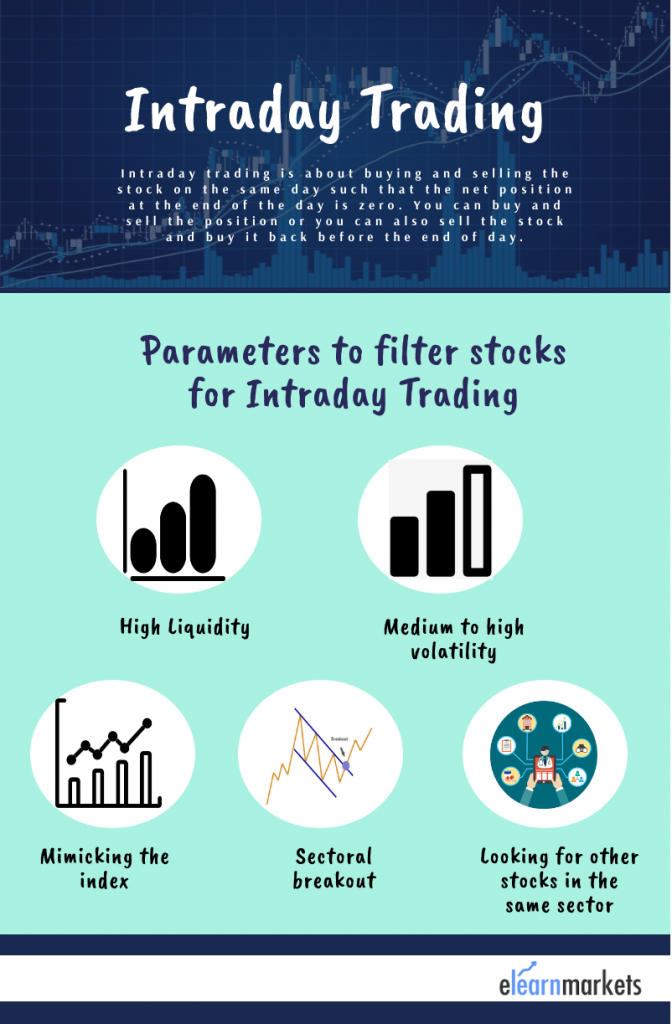
Parameters to filter stocks for Intraday Trading:

1. High Liquidity

It is very vital to select stocks which have enough liquidity for executing the trades.

The best thing about liquid stocks is that they have big volumes and big quantities can be bought or sold without affecting the price significantly.

Depth is also critical, which shows you how much liquidity a stock has at various price levels above or below the current market bid and offer.

2. Medium to high volatility Stocks are good for Intraday Trading

Traders usually need price movement so as to make money in day trading and hence selections of such stocks are important in price terms or percentage terms.

Usually the stock which tends to move more than 3% either side tends to be good stocks for intraday trading.

3. Mimicking the index

There are few traders who specialize in contrarian approach, however most traders usually look for stocks which move in sync with the index.

So when the index moves upward, there is a high possibility for the stock to go up too.

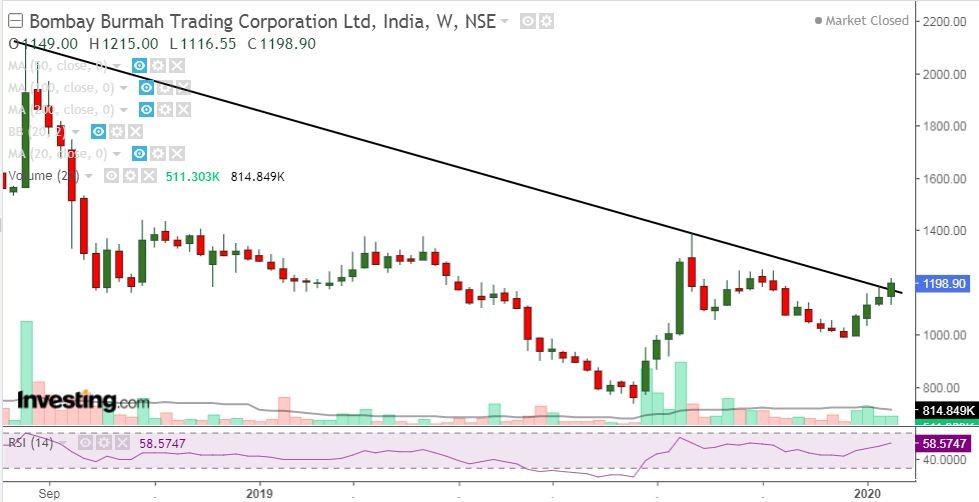
4. Sectoral breakout is a good approach to filter out stocks for Intraday Trading

You may track respective sectoral index to look for probable breakout candidates in the near term.

Let’s take an example to understand this in a better way:

sectoral breakout chart

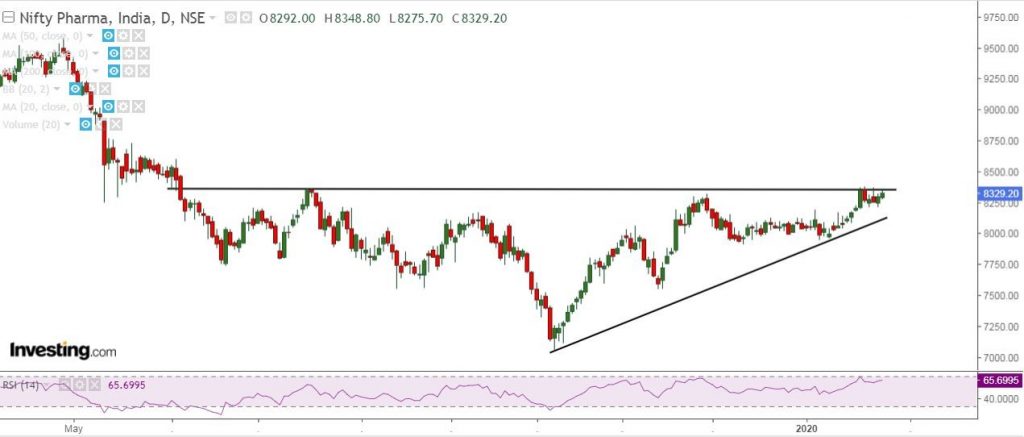
This is a daily chart of Pharma Index and as you can see the index has been consolidating for the last 9 months and presently trading on the verge of a breakout and consolidating for the last 5 trading days. A sustainable move above the latest swing high may lead to a confirmed breakout.

Learn Best ways to pick stocks for Intraday Trading in just 2 hours by Market Experts

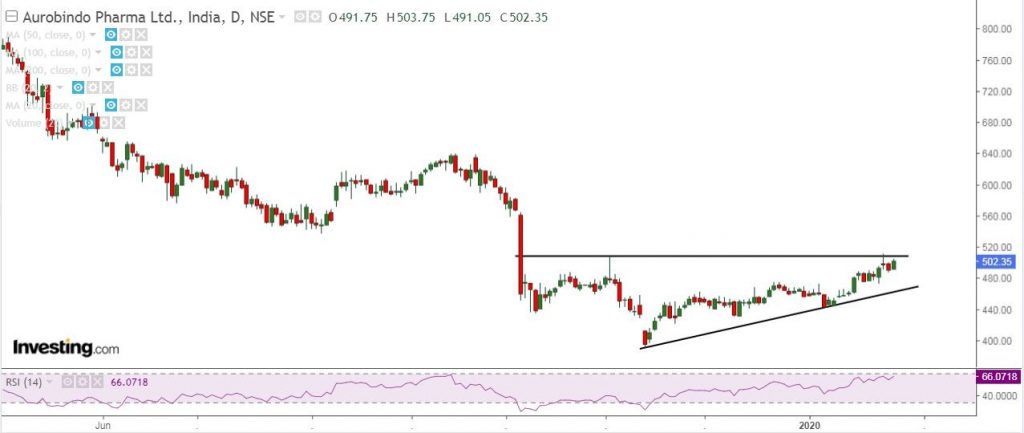
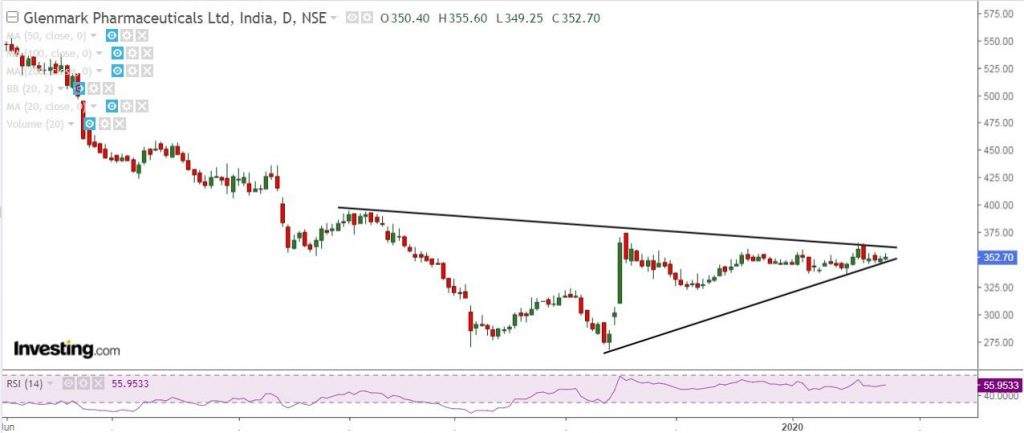
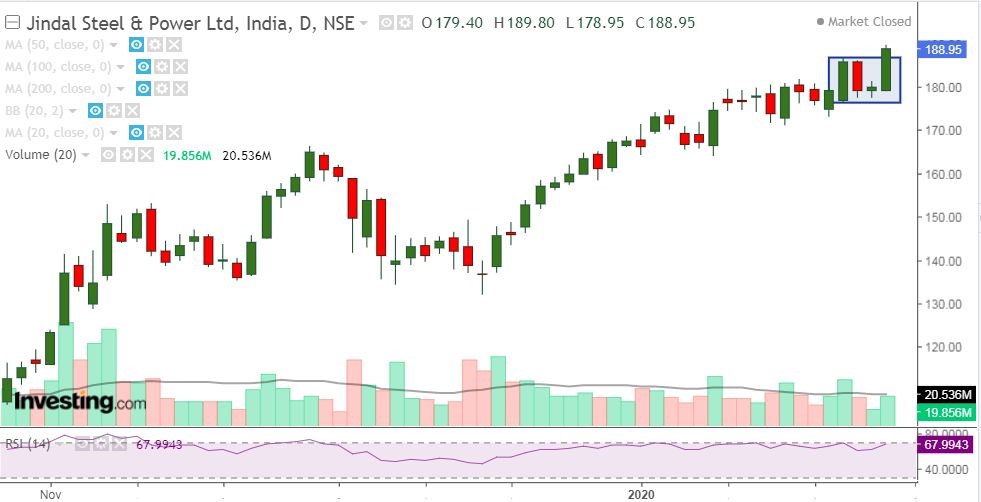
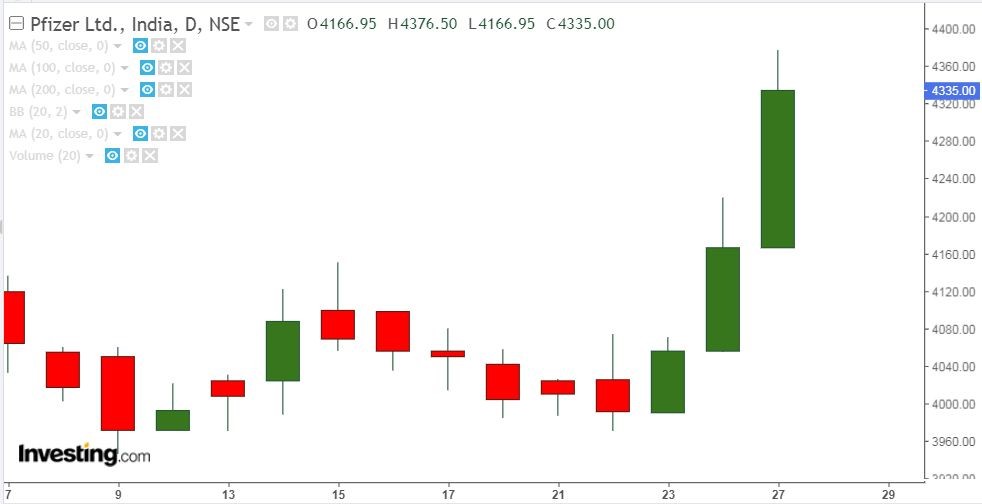
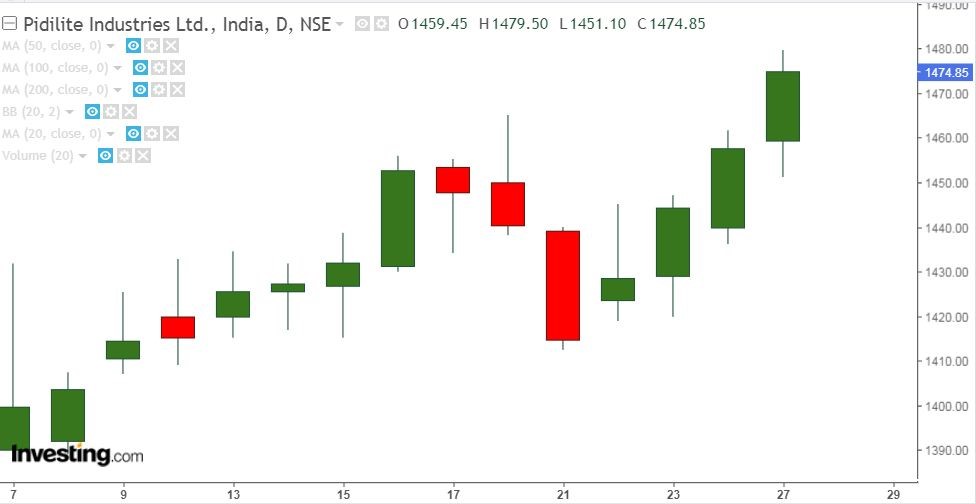
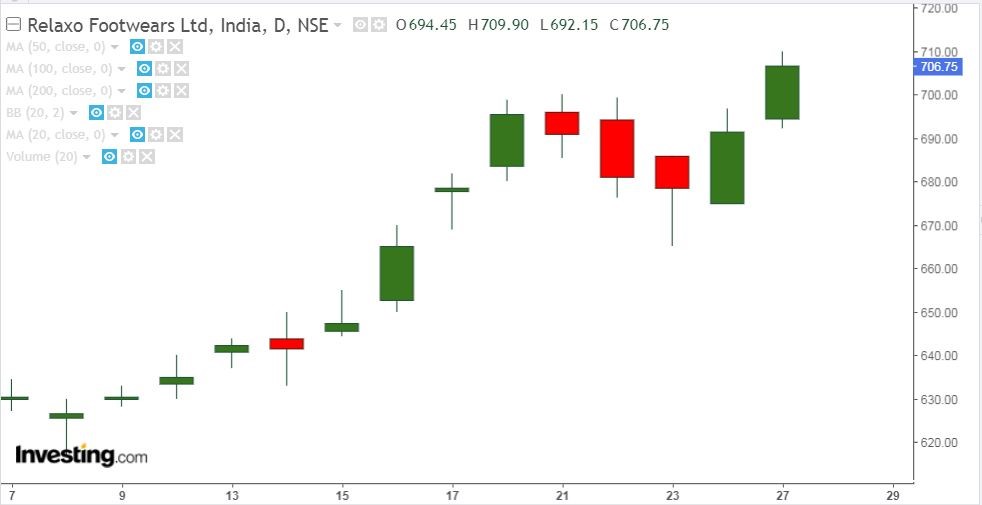
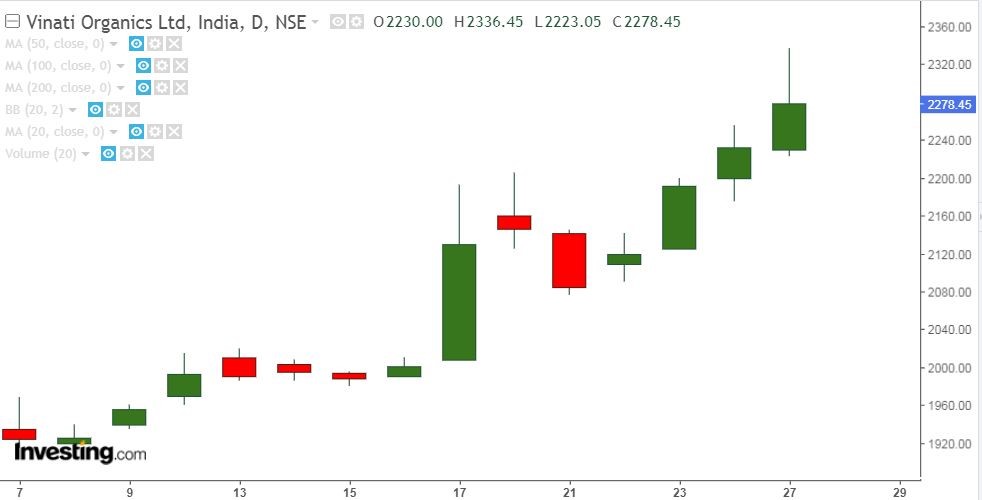
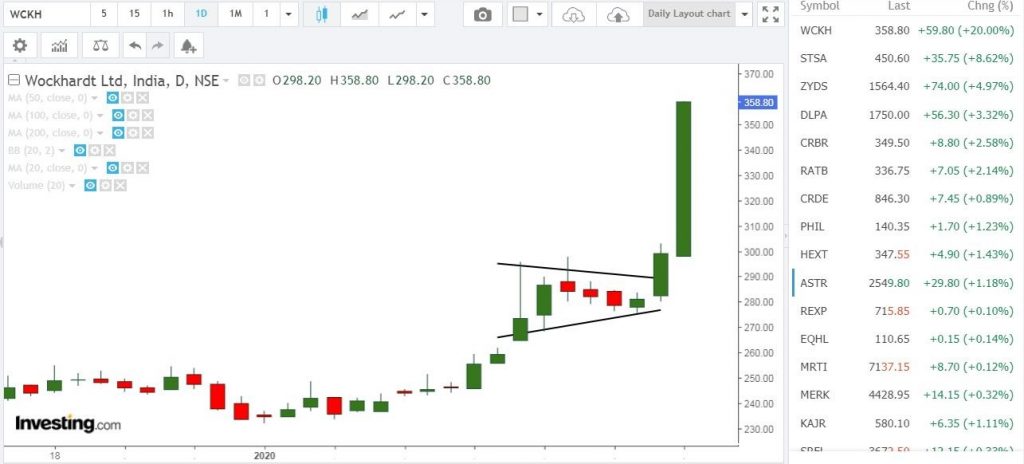
Accordingly you may look for stocks in the sector to filter out trades in the coming days. Here are few recent examples of few pharma companies which are too trading on the verge of breakout.

How to filter stock for Intraday Trading? 2
glenmark-chart

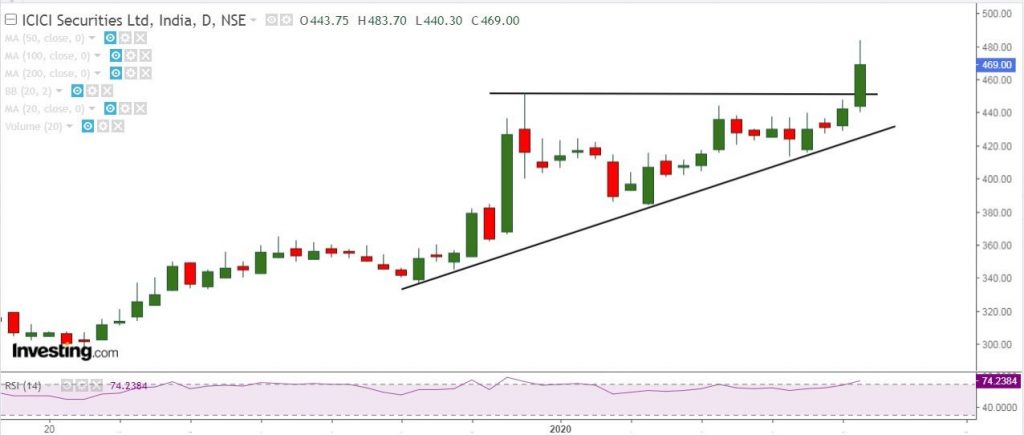
5. Looking for other stocks in the sector when the leaders have started to move

Another way to filter stocks for day trading will be looking at the peer stocks in the same sector when the leader stocks have already started to move.

Let’s take an example to understand this:

Recently there was a breakout in ICICI Securities, on a strong volume and at the same time, the stock also crossed it 52 week high level.

Say if you cannot ride this move, you may look for other stocks in the sector which are trading at probable breakout area.

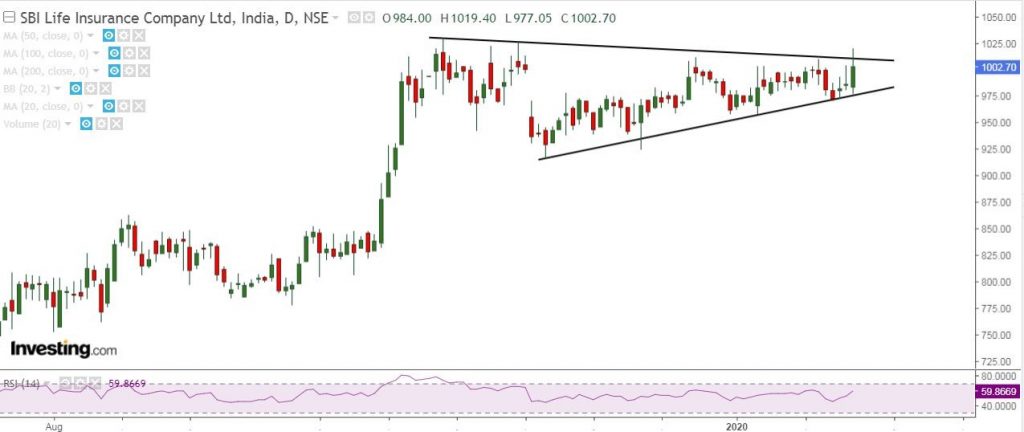
So if you at the chart of SBI Life insurance, this belongs to the same sector and is trading almost on the verge of breakout.

So in the coming days, there is a possibility for the next breakout candidate in the sector. This logic holds for other sectors too like Sugar industries, IT, Banking, etc.

SBI intraday chart
intraday trading parameters

Ways to find out momentum stocks in Intraday Trading:

You may track NSE India or Economic Times to filter Hourly gainers or losers based on various filters and accordingly analyse them technically.

Economic times hourly trading charts

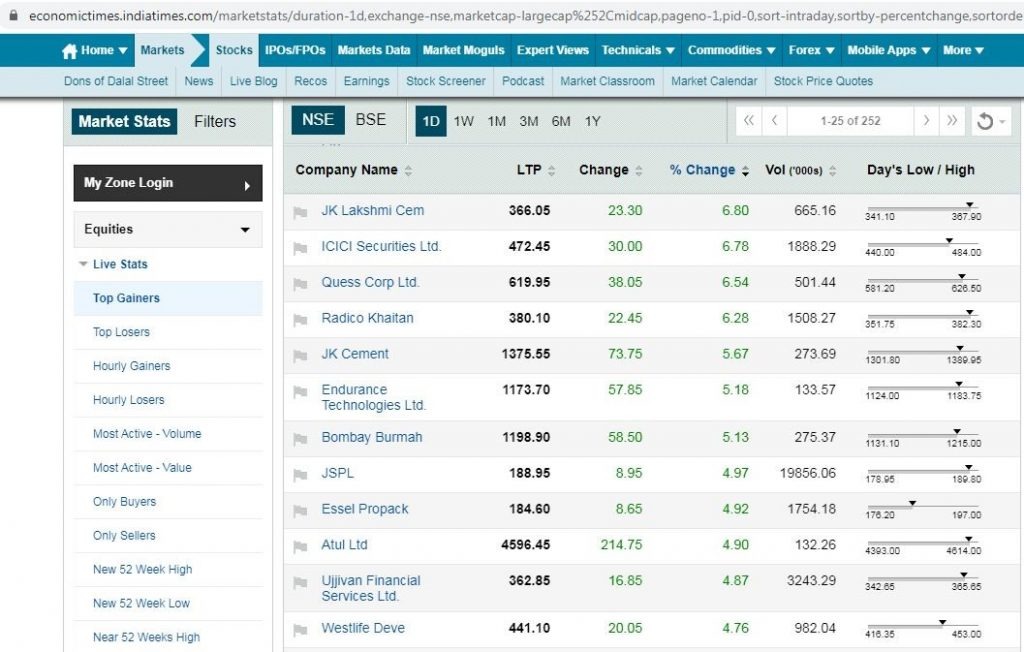
These are the list of stocks which came in the Economic times “Top Gainers” filter and you may keep analysing the stocks technically to identify probable breakout candidates from the list.

Let’s quickly have a look at the recent stock from the list and analyse them technically:

jk lakshmi momentum
ICICI trading chart
quess intraday chart
ujjivan intraday chart
essel chart
burmah chart
jindal chart

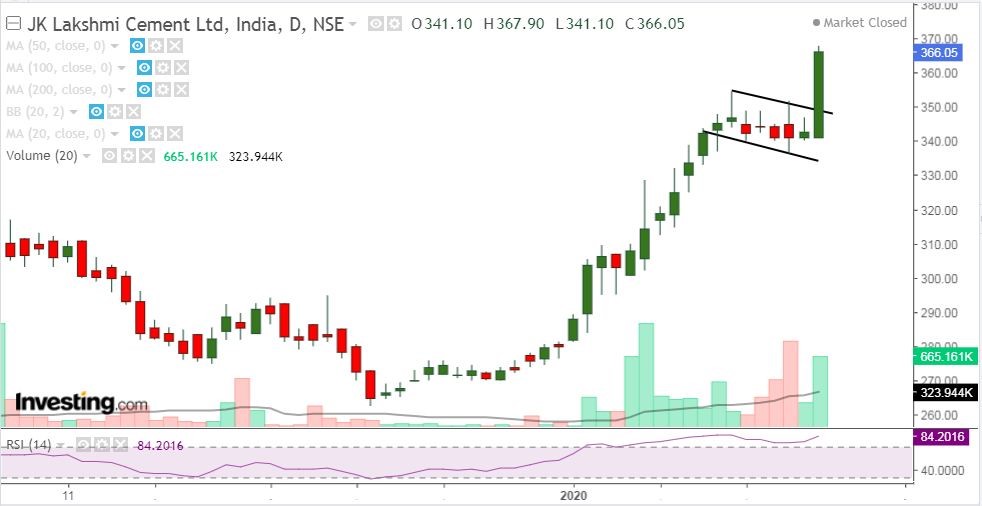
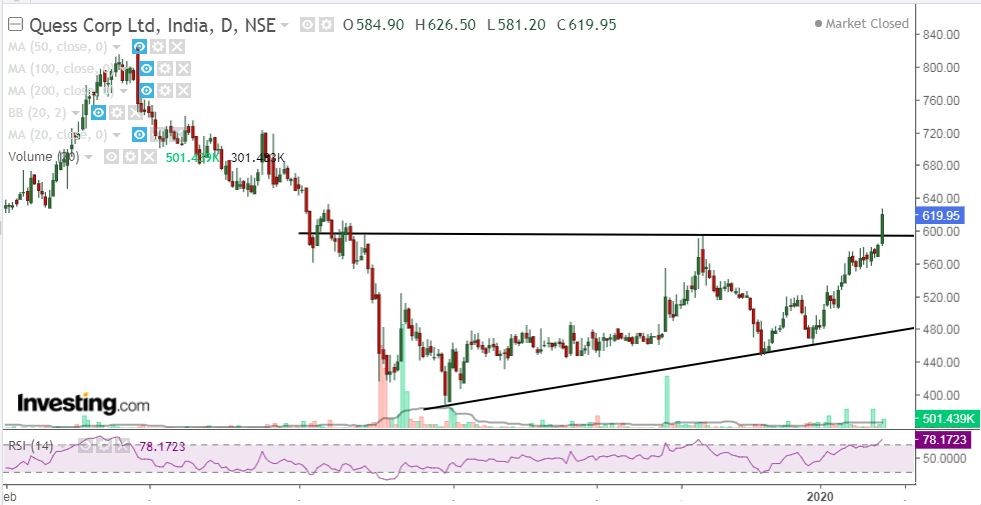
As you can see that most of the stocks from the list were taking breakouts from some technical parameters and accordingly you may filter out stocks for the trading purpose.

By using StockEdge app and create your own technical filter to filter out stocks for next trading day.

Here’s a sample scan made in StockEdge app to understand the overall process:

stockedge-scans
stockedge stocks

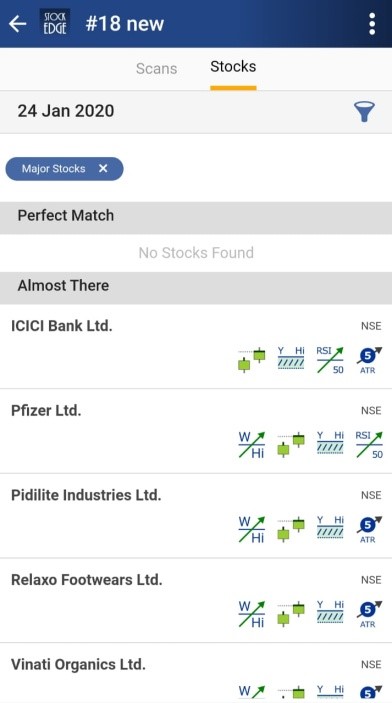
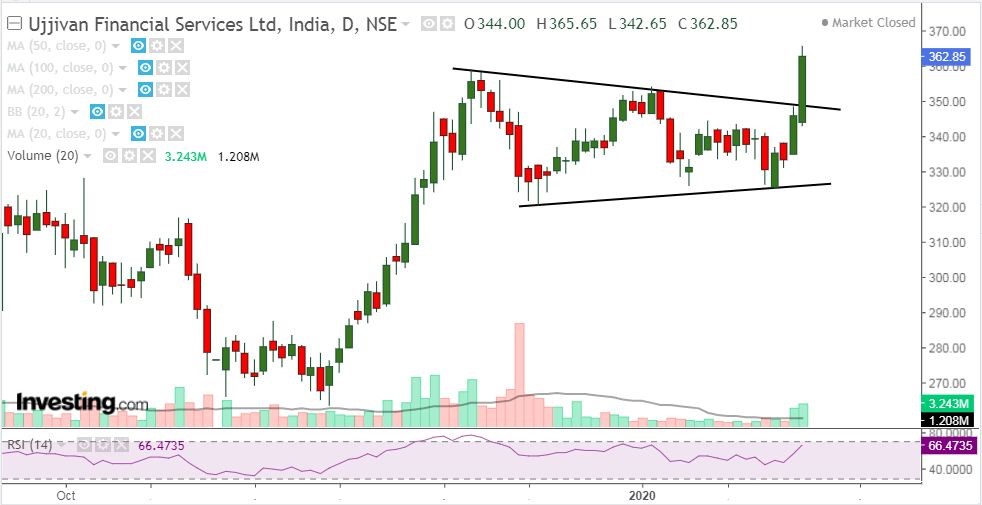
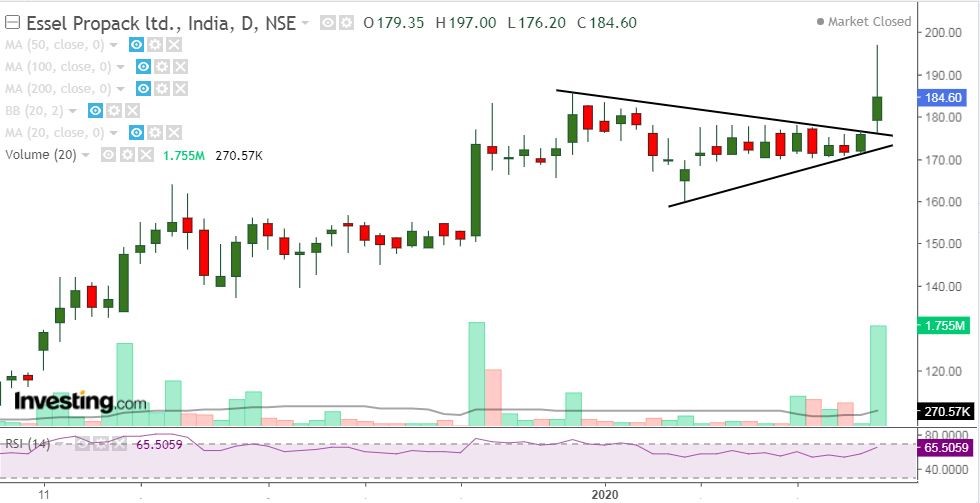
Here’s a list of stock which appeared in the StockEdge scan, let’s look at the scan result with the help of technical chart:

ICICI stockedge
pfizer chart
pidlite trading chart
relaxo-trading-chart
vinati trading chart

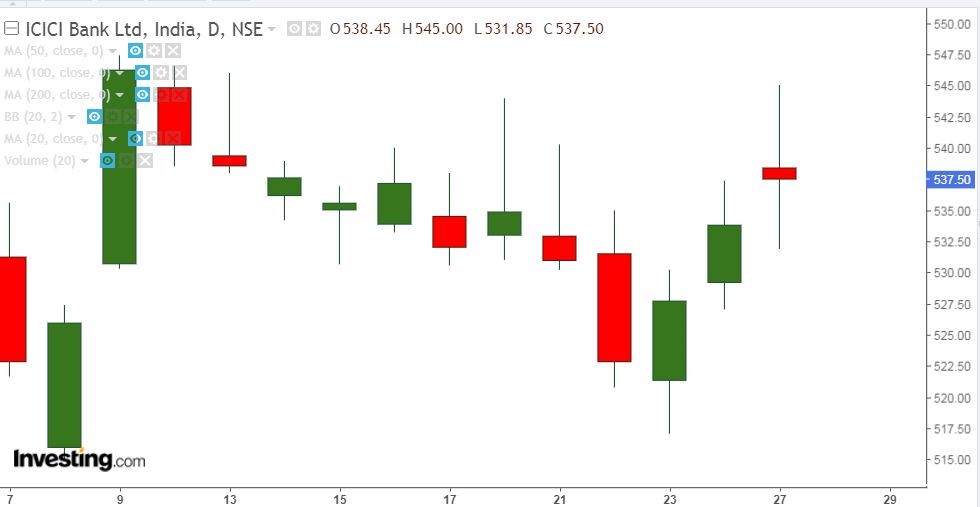
The present candle in the above charts represents intraday performance as per the scan and almost all the stocks have given positive result compared to last day’s closing.

Similarly you may create your own Scans and analyse the stock previous night to be ready with trading the next trading session.

There are few readymade scans too which may also help to filter out stocks for the trading purpose.

wockhardt readymade scan

Over a period of time, you may create a list of 50-60 stocks and create your own watch list and technical setup.

So whenever you come across any technical breakout, you may use it for the trading purpose just the way it is shown in the above image.

Next: Learn how to pick stocks for investing.

Frequently Asked Questions

How can I select intraday stock every hour?

One can use the ACCR(Action, Confirmation, Retest, Reconfirmation ) method of intraday trading that really works when you do intraday trading. You can refer our blog on Intraday Share Trading – Smart Method for Trading in Stocks for more details about this method.

What time is best for intraday?

The first One to two hours of the stock market is the best time frame for intraday trading. For beginners, they should wait until 9:30. The reason behind this is that in the first few minutes of the market opening, stocks are likely reacting to the previous night’s news.

Is intraday profitable?

Intraday trading is all about earning profits with multiple trades. By this traders can reduce the losses and generate daily profits. One should never wait for generating huge profits in just trade; instead plan multiple trades and earn small profits.

How can I earn 500 a day in intraday trading?

Yes, one can, provided one has the required knowledge, skill, experience, discipline and the ability to time the market. But one has to keep in mind that the market is always right and gives every trader a chance to make profits, irrespective of the directions it moves in.

Tags: breakout stocksenglishintermediateintraday tradingmomentum stocks
Share3TweetSend
Get Kotak Offer Get Kotak Offer Get Kotak Offer
Previous Post

The Growth and Investment Opportunity in the Steel Industry

Next Post

Everything You Need to Know About Associate Company

Elearnmarkets

Elearnmarkets

Elearnmarkets (ELM) is a complete financial market portal where the market experts have taken the onus to spread financial education. ELM constantly experiments with new education methodologies and technologies to make financial education effective, affordable and accessible to all. You can connect with us on Twitter @elearnmarkets.

Related Posts

Understand Slippage in Trading
Technical Analysis

What is Slippage in Trading? Meaning & Examples

March 28, 2025
298
Breakout trading strategies
Technical Analysis

Top 5 Breakout Trading Strategies

March 12, 2025
1.1k
5 stocks for today
Technical Analysis

5 Stocks to Buy Today That Could Beat the NIFTY in 2025!

May 5, 2025
400
Image describing What is marginal trading facility
Technical Analysis

 What is a Margin Trading Facility? Advantages & Risks

April 4, 2025
661

Comments 5

  1. priyanka chavan says:
    5 years ago

    informative!

    Reply
  2. معدل الارتداد،معدل الارتداد في المواقع،معدل الارتداد بلوجر،تخفيض معدل الارتداد،حل مشكلة معدل الارتداد says:
    5 years ago

    Very nice article. I absolutely appreciate this site.
    Keep writing!

    Reply
  3. Sankalp mahajan says:
    4 years ago

    I got lot of basic information…

    Reply
  4. westernfx says:
    4 years ago

    Like the content. it is very resourceful indeed.

    Reply
    • Sakshi Agarwal says:
      4 years ago

      Hi,

      We really appreciated that you liked our blog.

      Keep Reading!

      Reply

Leave a Reply Cancel reply

Your email address will not be published. Required fields are marked *

Disclaimer

Elearnmarkets (Kredent InfoEdge Pvt. Ltd.) is a SEBI-registered Research Analyst (RA) entity (SEBI Registration No.: INH300007493). The information provided in this article is for educational and informational purposes only and should not be considered as an offer to buy or sell any securities or investment products.

The stocks, securities, and investment instruments mentioned herein are not recommendations under SEBI (Research Analysts) Regulations, 2014. Readers are advised to conduct their own due diligence and seek independent financial advice before making any investment decisions.

Investments in securities markets are subject to market risks. Please read all related documents carefully before investing. Investing in Equity Shares,
Derivatives, Mutual Funds, or other instruments carry inherent risks, including potential loss of capital. Elearnmarkets (Kredent InfoEdge Pvt. Ltd.) does not provide any guarantee or assurance of returns on any investments. Past performance is not indicative of future performance.

Elearnmarkets Logo

Follow Us

Facebook-f X-twitter Instagram Linkedin-in Youtube Telegram

Register on Elearnmarkets

Continue your financial learning by creating your own account on Elearnmarkets.com

Register Free Account

Download App

Playstore logo
Download on app store

Categories

  • Basic Finance
  • Derivatives
  • Financial Planning
  • Fundamental Analysis
  • Technical Analysis
  • Mutual Funds
  • Miscellaneous

Popular On Elearnmarkets

  • Market Superheroes:
  • Vivek Bajaj
  • Chetan Panchamia
  • Ashish Kyal
  • Premal Parekh
  • Abhijit Paul
  • Jegan
  • Sivakumar Jayachadran
  • Jyoti Budhia
  • Vivek Gadodia
  • Vishal Mehta
  • Piyush Chaudhry
  • Santosh Pasi
  • Gomathi Shankar
  • Market Superheroes:
  • Vivek Bajaj
  • Chetan Panchamia
  • Ashish Kyal
  • Premal Parekh
  • Abhijit Paul
  • Jegan
  • Sivakumar Jayachadran
  • Jyoti Budhia
  • Vivek Gadodia
  • Vishal Mehta
  • Piyush Chaudhry
  • Santosh Pasi
  • Gomathi Shankar
  • Courses:​
  • Options Trading
  • Dow Theory
  • Momentum Trading
  • Stock Investing
  • Harmonic Chart Patterns
  • Algo Trading
  • Elliot Wave Theory
  • Advanced Excel
  • Cryptocurrency
  • NSE Certification Course
  • Courses:​
  • Options Trading
  • Dow Theory
  • Momentum Trading
  • Stock Investing
  • Harmonic Chart Patterns
  • Algo Trading
  • Elliot Wave Theory
  • Advanced Excel
  • Cryptocurrency
  • NSE Certification Course
  • Webinars:
  • Bank Nifty Scalping
  • Intraday Trading Strategies
  • Options Trading Strategies
  • Options selling
  • Price Action
  • Relative Strength
  • Tax Planning
  • Options Buying
  • Growth Stocks
  • Portfolio Management
  • Risk Management
  • Renko Charts
  • Crude Oil
  • Traders Psychology
  • Moving Average
  • Multibagger Stocks
  • Free Learning Modules:
  • Intraday Trading
  • Options Scalping
  • Swing Trading
  • Financial Modelling
  • RSI Indicator
  • Bollinger Bands
  • Pricing of Futures
  • Personal Finance
  • Initial Public Offerings (IPO)
  • Value Investing
  • Technical Indicators
  • Candlesticks
  • Chart Patterns
  • Option Greeks
  • ELSS Funds
  • Banking and Insurance
  • Real Estate
  • Gold
  • Book Summaries:
  • Rich Dad Poor Dad
  • Psychology of Money
  • The Intelligent Investor
  • The Richest Man in Babylon
  • Think and Trade Like a Champion
  • Value Investing and Behavioural Finance
  • Trading in the Zone
  • Learn to Earn
  • Book Summaries:
  • Rich Dad Poor Dad
  • Psychology of Money
  • The Intelligent Investor
  • The Richest Man in Babylon
  • Think and Trade Like a Champion
  • Value Investing and Behavioural Finance
  • Trading in the Zone
  • Learn to Earn
  • Tools:
  • CAGR Calculator
  • SIP Calculator
  • eLearnOptions
  • Future Value Calculator
  • Present Value Calculator
  • Atal Pension Yojana
  • Cost of Delay Calculator
  • Become a Crorepati
  • Tools:
  • CAGR Calculator
  • SIP Calculator
  • eLearnOptions
  • Future Value Calculator
  • Present Value Calculator
  • Atal Pension Yojana
  • Cost of Delay Calculator
  • Become a Crorepati

© 2025 Elearnmarkets. All Rights Reserved

  • Visit Elearnmarkets
  • Courses
  • Webinars
  • Financial Guides
  • Get Free Counselling
  • Visit Elearnmarkets
  • Courses
  • Webinars
  • Financial Guides
  • Get Free Counselling

Download Our App

No Result
View All Result
  • Article Categories
    • Basic Finance
    • Derivatives
    • Financial Planning
    • Fundamental Analysis
    • Technical Analysis
    • ETFs & Mutual Funds
    • Marketshala
    • Miscellaneous
  • Language
    • Hindi
    • Bengali
    • English
  • Courses
  • Webinars
  • Stories
Get Free Course

© 2024 Elearnmarkets All Rights Reserved

A Handbook of Technical Analysis
To start your trading journey as a seasoned technical analyst
Download Guide For FREE
Guidebook On Chart Patterns
Take Your Trading To The Next Level With Strategies Shared In This Ebook
Download Guide For FREE
Trading Mentorship Program