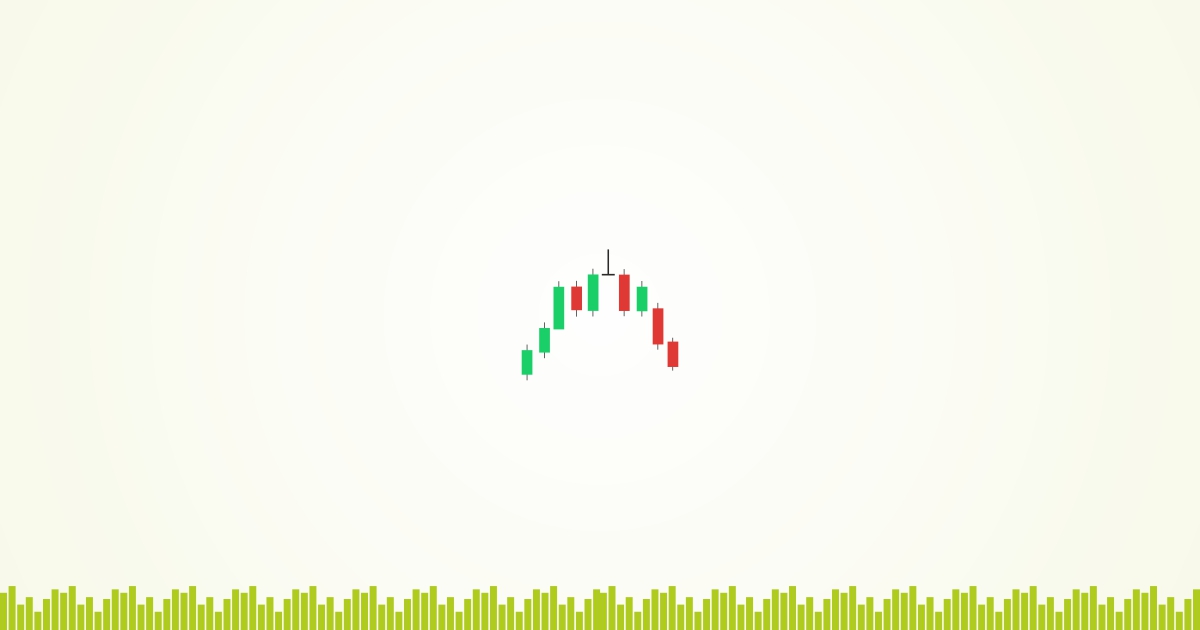
The Gravestone Doji is a candlestick pattern that shows the opening and closing of the candle at the low of the day and is quite bearish.
It is typically seen at the end of an advance where the upper shadow represents new high ground for the move.
The fact that prices end the day at the opening (after all the work at higher levels) is indicative of a change in psychology and is really a sign of exhaustion.
| Table of Contents |
|---|
| Construction of Gravestone Doji Pattern |
| Examples of Gravestone Doji |
| Bottomline |
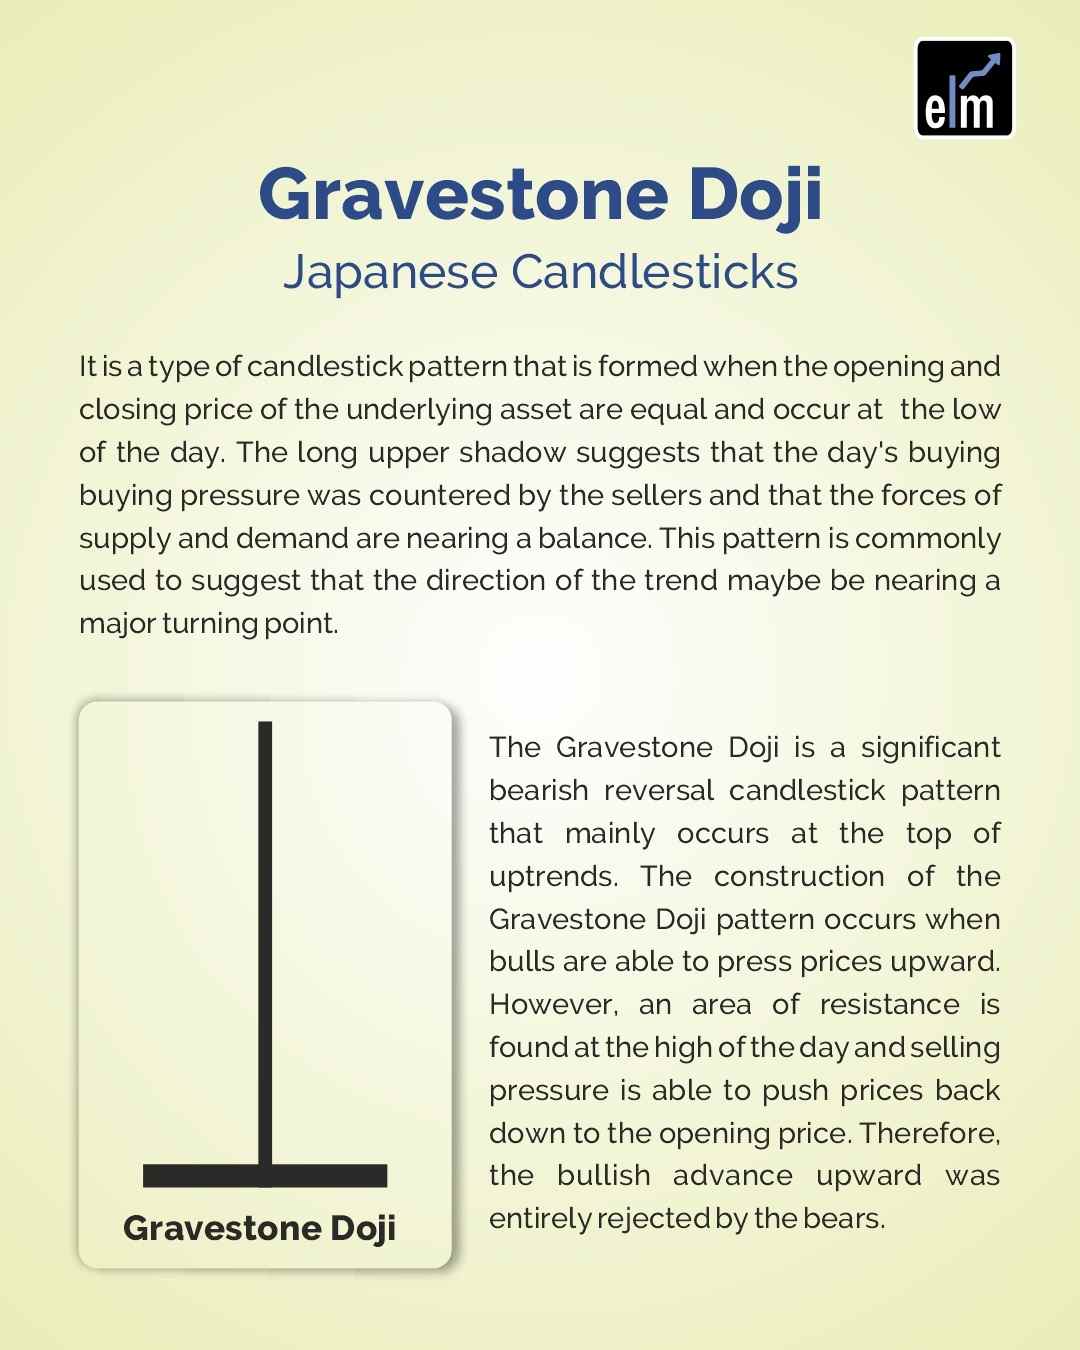
In the case of this candlestick pattern, the longer the shadow, the more negative the candle.
In simple words, the Doji candle ended the session at the same price at which it began.
Looking at the candle, we can interpret the basic underlying psychology of the candle is to reflect a session that ends in indecision.
The basic characteristic that defines this Japanese Candlesticks is a small real body and an unusually long upper shadow.
Construction of Gravestone Doji Pattern
The construction of the bullish Gravestone Doji pattern occurs when the bulls are able to press prices upward.
But, an area of resistance is formed when it reaches the high of the day and the selling pressure pushes the prices back down to the opening price of the day.
This indicates that the bullish rally upward has been completely rejected by the markets.
It is an extremely helpful pattern to help traders visually see where resistance and supply are likely to be located.
After an uptrend, the Gravestone Doji can signal to traders that the uptrend could be over and that long positions should probably be exited.
But other indicators should be used in conjunction with the Gravestone Doji pattern to determine an actual sell signal.
A potential trigger could be a break of the upward trendline support.
Examples of Gravestone Doji
Adani Ports
In the daily chart of Adani ports, we can see a Gravestone Doji formation on the date 22.05.2015. The Doji was formed with a prior uptrend from the levels of 300 to 348.
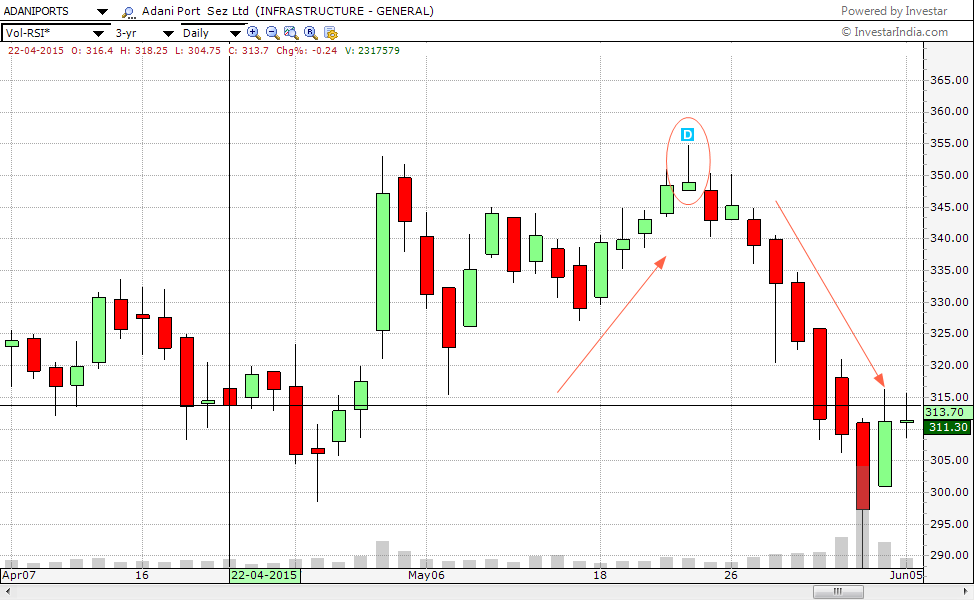
This was a rally of 16 percent and after the formation of the Gravestone Doji, the stock fell from the level of 350 to the levels of 298 which was again a fall of about 15 percent
Andhra Bank:
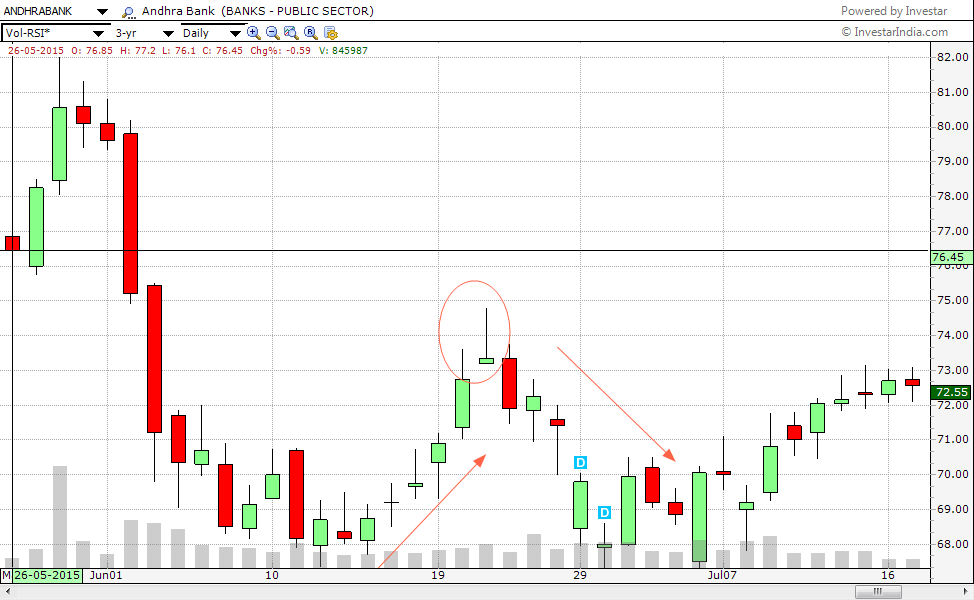
This daily chart of Andhra bank is another example of the Doji pattern. With a prior uptrend of about 7% from the level of 68, it formed at Doji at 73 and then reversed its trend to go back to the levels of 69.
Bottom line:
We hope that the above write-up has helped you to get a clear understanding of this Doji pattern.
Feel free to give your feedback by writing to us in the comment box below.
In order to get the latest updates about Financial Markets visit StockEdge.com
Happy Learning!!
