Elearnmarkets - Financial Market Learning
  • Courses
  • Webinars
  • Stories
  • Language
    • English
    • Hindi
    • Bengali
No Result
View All Result
Get Free Course
  • Basic Finance
  • Derivatives
    • Futures
    • Options
  • Financial Planning
  • Fundamental Analysis
  • Technical Analysis
  • Mutual Funds
  • Marketshala
  • Miscellaneous
Elearnmarkets - Learn Stock Market, trading, investing for Free
  • Courses
  • Webinars
  • Stories
  • Language
    • English
    • Hindi
    • Bengali
No Result
View All Result
Get Free Course
Elearnmarkets - Learn Stock Market, trading, investing for Free
No Result
View All Result
Home Technical Analysis
6 Tenets of Dow Theory: The Modern Study of Technical Analysis 1

6 Tenets of Dow Theory: The Modern Study of Technical Analysis

Elearnmarkets by Elearnmarkets
May 27, 2025
in Technical Analysis
Reading Time: 6 mins read
0
41.6k
VIEWS
Share on FacebookShare on XShare on WhatsApp

Key Takeaways:

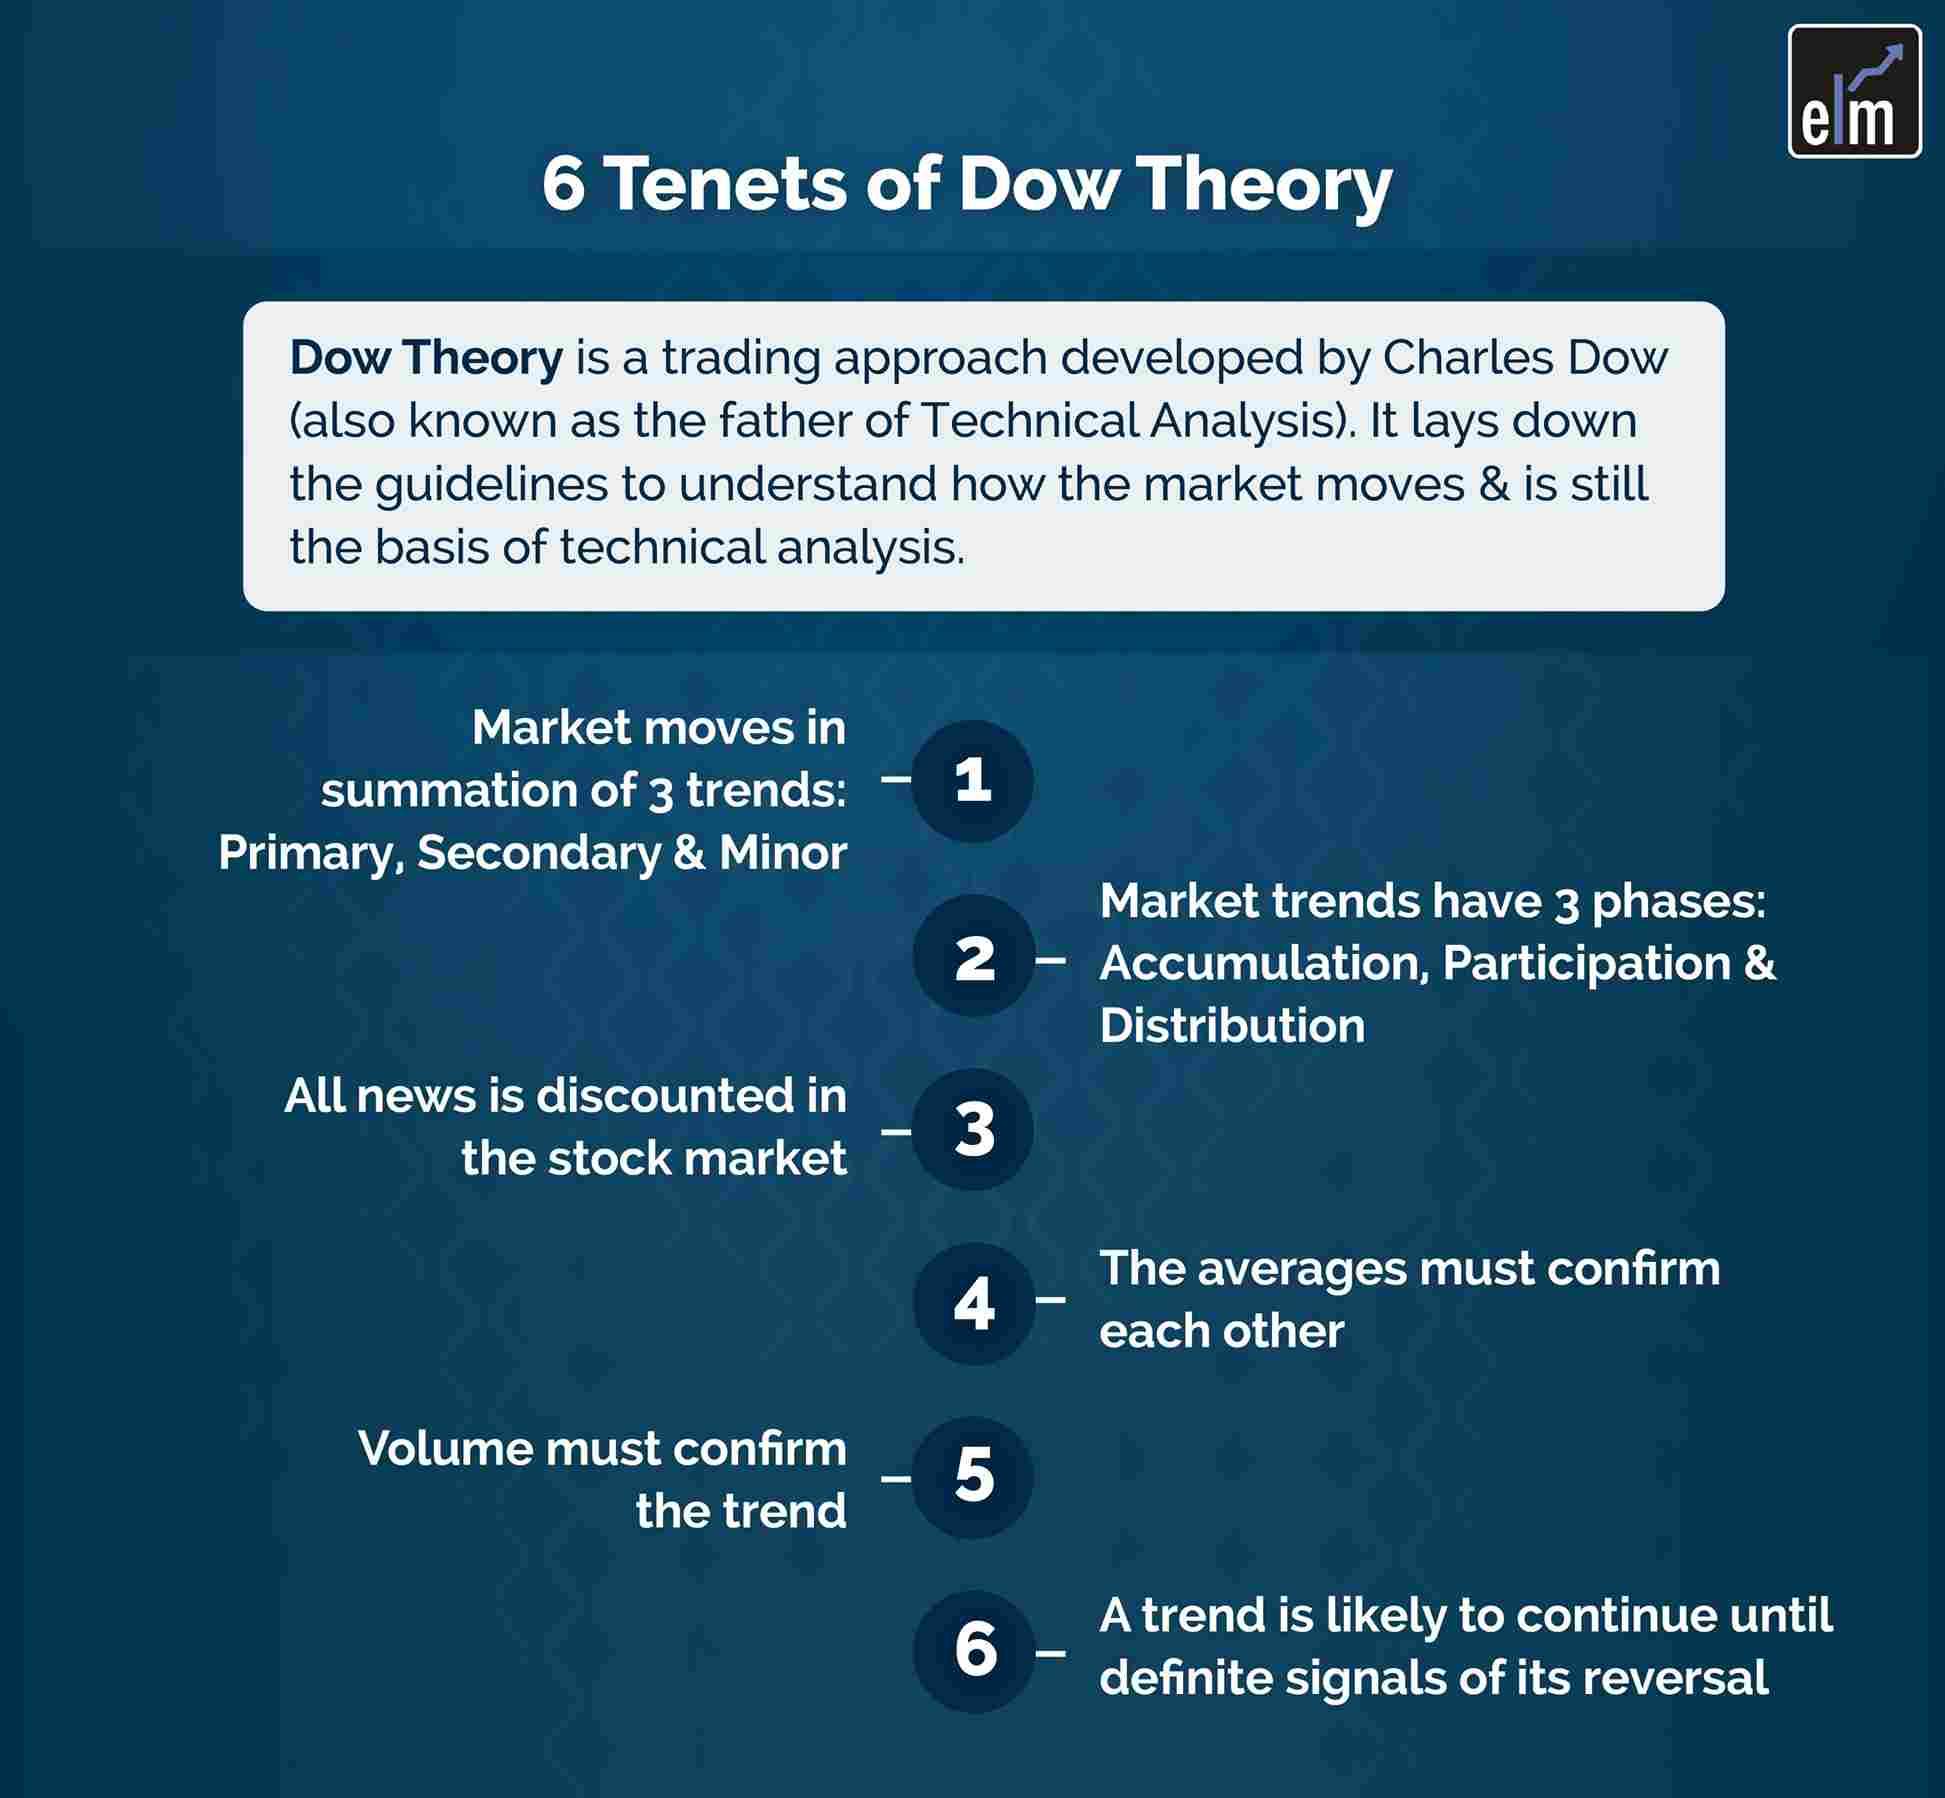
  • Market moves in three trends: primary, secondary & minor.
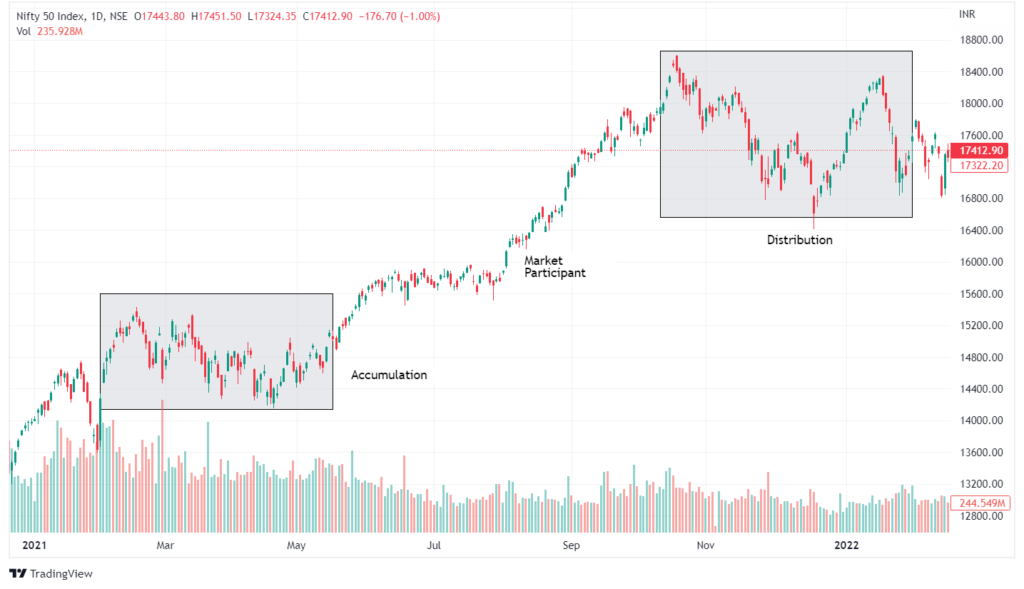
  • Each trend unfolds in three phases: accumulation, participation & distribution.
  • Stock prices reflect all news and information.
  • Trend confirmation needs support from multiple market indices.
  • Volume plays a key role in validating price trends.
  • Trends persist unless strong reversal signals emerge.

The Dow Theory was a ground-breaking strategy that permanently altered how stock investors traded. Technical analysis is also built on Charles Dow’s market movement analysis principles. Charles Dow was not only a co-founder of the prestigious Wall Street Journal but also a co-founder of the Dow Jones Industrial Average.

The Dow Theory’s guiding principles are familiar to anyone with even a passing trading knowledge. Even if you’re not aware of it, the Dow Theory is most likely used if you use technical analysis charts.

In today’s blog we will discuss 6 Tenets of Dow Theory:

Table Of Contents
  1. What is Dow Theory?
  2. The 6 Tenets of Dow Theory:
    • 1. Market Moves in Summation of Three Trends
    • 2. Market Trends Have Three Phases
    • 3. All News is Discounted in the Stock Market
    • 4. Averages Must Confirm
    • 5. Volumes Confirm Trends            
    • 6. Trends Continue Unless Definitive Reversals Come About
  3. Bottom Line

What is Dow Theory?

Dow Theory is a trading approach developed by Charles Dow, who is also known as the father of Technical Analysis. It is still the basis of the technical analysis of financial markets. The basic idea of Dow Theory is that market price action reflects all available information, and the market price movement is comprised of three main trends.

Most modern-day technical analysis theory has an origin in ideas proposed by Dow and his partner Edward Jones back in the 19th century. Those ideas were published in the Wall Street Journal and are still assimilated by most of the technicians. Dow Theory still dominates the far more sophisticated and equipped modern study of technical analysis.

The 6 Tenets of Dow Theory:

Dow Theory

1. Market Moves in Summation of Three Trends

  • The PRIMARY TREND: It can be as long as years and is the ‘main movement’ of the market.
  • The INTERMEDIATE TREND: lasting between 3 weeks to several months, retraces the last primary move by some 33-66% and is difficult to decipher.
  • The MINOR TREND: is least reliable, lasting from several days to a few hours, constitutes noise in the market and may be subject to manipulation.

2. Market Trends Have Three Phases

Be it the bull trend or the bear trend, either way, there are three well-defined phases for each. For an uptrend, the phases are Revival of confidence (accumulation), Response (public participation), and Over-confidence (Speculation). The three defined stages of the Primary Bear Trend are Abandonment of hope (Distribution),  Selling on decreased earnings (doubting),  Panic ( distressed selling )

dow principles

3. All News is Discounted in the Stock Market

Prices know it all. All possible information and expectations are factored into prices beforehand.

The efficient market hypothesis serves as the foundation for Dow Theory’s first tent. (EMH). According to the EMH theory, the market price has already discounted everything that can be known. Human emotion is the only thing that is not taken into account by the stock price.

From the Dow Theory’s first principle, we can learn the following important lesson:

  • A price action analysis is the study of human emotion.
  • This idea, which forms the cornerstone of all technical trading, is one that you subscribe to if you support technical analysis strategies.

4. Averages Must Confirm

Initially, when the US was a growing industrial power, Dow formulated the two averages. One would reflect the state of manufacturing, and the other, the movement of those products in the economy. The logic was that if there is production, then those who move them about should also be benefiting, and hence new peaks in the industrial average needed to be confirmed by the peaks in the transportation average. Today, the roles have changed, but the relations remain among sectors, and so does the necessity of confirmation.

5. Volumes Confirm Trends            

Dow was of the belief that trends in prices could be confirmed by volumes. When the movements in price were accompanied by high volumes, they would depict the ‘true’ movement of the prices.

According to the fifth rule of the Dow Theory, volume should support the trend and move in lockstep with it. A rise in buying activity should be observed if there is a bullish candlestick trend. As a result, a bearish trend should be accompanied by an increase in selling pressure.

volume market interest

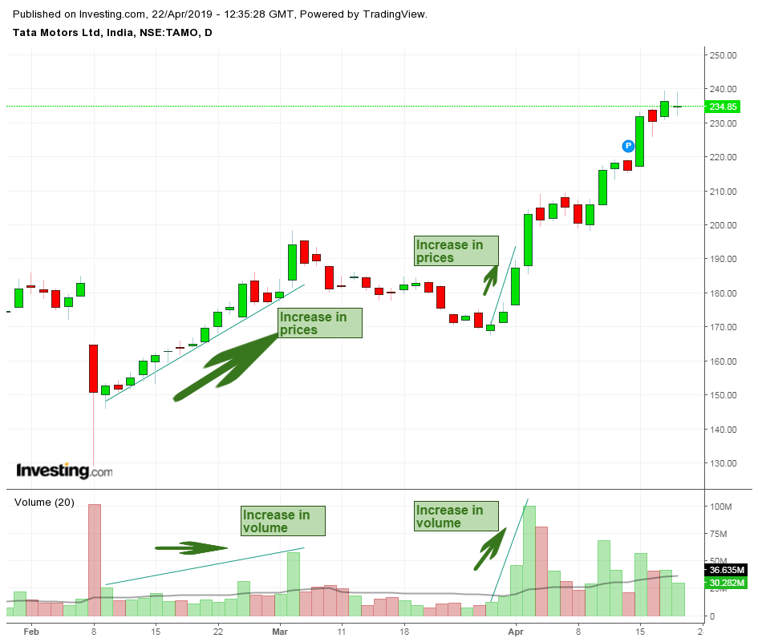
Note: A weak trend may be indicated by low volume.

The key concept is that volume must follow the main trend.

You can also do our course on Online NSE Academy Certified Capital Market Professional (E-NCCMP)

6. Trends Continue Unless Definitive Reversals Come About

Irrespective of the day-to-day erratic movement and market noise that may be witnessed in prices, Dow believed that prices moved in trends. Reversals in trends are hard to predict unless it’s too late due to the nature and difference in magnitude of trends. However, a trend is believed to be in action unless definitive proofs of reversal emerge.

Bottom Line

By understanding the Dow Theory, traders are better able to spot hidden trends that more experienced investors may be noticing. This allows them to make more informed decisions regarding their open positions.

We hope you found this blog informative and use the information to its maximum potential in the practical world. Also, show some love by sharing this blog with your family and friends and helping us spread financial literacy.

RELATED: Get legal consultation online from top lawyers to understand the legal issues and complications that could arise out of trading and investments if we aren’t careful

Happy Investing!

Tags: Dow theorydow theory principlesenglishstock markettechnical analysistrend
ShareTweetSend
Get Kotak Offer Get Kotak Offer Get Kotak Offer
Previous Post

How to do Short Term Momentum Trading Effectively?

Next Post

Trading Contrarian Strategies

Elearnmarkets

Elearnmarkets

Elearnmarkets (ELM) is a complete financial market portal where the market experts have taken the onus to spread financial education. ELM constantly experiments with new education methodologies and technologies to make financial education effective, affordable and accessible to all. You can connect with us on Twitter @elearnmarkets.

Related Posts

Understand Slippage in Trading
Technical Analysis

What is Slippage in Trading? Meaning & Examples

March 28, 2025
337
Breakout trading strategies
Technical Analysis

Top 5 Breakout Trading Strategies

March 12, 2025
1.2k
5 stocks for today
Technical Analysis

5 Stocks to Buy Today That Could Beat the NIFTY in 2025!

May 5, 2025
424
Image describing What is marginal trading facility
Technical Analysis

 What is a Margin Trading Facility? Advantages & Risks

April 4, 2025
720

Leave a Reply Cancel reply

Your email address will not be published. Required fields are marked *

Disclaimer

Elearnmarkets (Kredent InfoEdge Pvt. Ltd.) is a SEBI-registered Research Analyst (RA) entity (SEBI Registration No.: INH300007493). The information provided in this article is for educational and informational purposes only and should not be considered as an offer to buy or sell any securities or investment products.

The stocks, securities, and investment instruments mentioned herein are not recommendations under SEBI (Research Analysts) Regulations, 2014. Readers are advised to conduct their own due diligence and seek independent financial advice before making any investment decisions.

Investments in securities markets are subject to market risks. Please read all related documents carefully before investing. Investing in Equity Shares,
Derivatives, Mutual Funds, or other instruments carry inherent risks, including potential loss of capital. Elearnmarkets (Kredent InfoEdge Pvt. Ltd.) does not provide any guarantee or assurance of returns on any investments. Past performance is not indicative of future performance.

Elearnmarkets Logo

Follow Us

Facebook-f X-twitter Instagram Linkedin-in Youtube Telegram

Register on Elearnmarkets

Continue your financial learning by creating your own account on Elearnmarkets.com

Register Free Account

Download App

Playstore logo
Download on app store

Categories

  • Basic Finance
  • Derivatives
  • Financial Planning
  • Fundamental Analysis
  • Technical Analysis
  • Mutual Funds
  • Miscellaneous

Popular On Elearnmarkets

  • Market Superheroes:
  • Vivek Bajaj
  • Chetan Panchamia
  • Ashish Kyal
  • Premal Parekh
  • Abhijit Paul
  • Jegan
  • Sivakumar Jayachadran
  • Jyoti Budhia
  • Vivek Gadodia
  • Vishal Mehta
  • Piyush Chaudhry
  • Santosh Pasi
  • Gomathi Shankar
  • Market Superheroes:
  • Vivek Bajaj
  • Chetan Panchamia
  • Ashish Kyal
  • Premal Parekh
  • Abhijit Paul
  • Jegan
  • Sivakumar Jayachadran
  • Jyoti Budhia
  • Vivek Gadodia
  • Vishal Mehta
  • Piyush Chaudhry
  • Santosh Pasi
  • Gomathi Shankar
  • Courses:​
  • Options Trading
  • Dow Theory
  • Momentum Trading
  • Stock Investing
  • Harmonic Chart Patterns
  • Algo Trading
  • Elliot Wave Theory
  • Advanced Excel
  • Cryptocurrency
  • NSE Certification Course
  • Courses:​
  • Options Trading
  • Dow Theory
  • Momentum Trading
  • Stock Investing
  • Harmonic Chart Patterns
  • Algo Trading
  • Elliot Wave Theory
  • Advanced Excel
  • Cryptocurrency
  • NSE Certification Course
  • Webinars:
  • Bank Nifty Scalping
  • Intraday Trading Strategies
  • Options Trading Strategies
  • Options selling
  • Price Action
  • Relative Strength
  • Tax Planning
  • Options Buying
  • Growth Stocks
  • Portfolio Management
  • Risk Management
  • Renko Charts
  • Crude Oil
  • Traders Psychology
  • Moving Average
  • Multibagger Stocks
  • Free Learning Modules:
  • Intraday Trading
  • Options Scalping
  • Swing Trading
  • Financial Modelling
  • RSI Indicator
  • Bollinger Bands
  • Pricing of Futures
  • Personal Finance
  • Initial Public Offerings (IPO)
  • Value Investing
  • Technical Indicators
  • Candlesticks
  • Chart Patterns
  • Option Greeks
  • ELSS Funds
  • Banking and Insurance
  • Real Estate
  • Gold
  • Book Summaries:
  • Rich Dad Poor Dad
  • Psychology of Money
  • The Intelligent Investor
  • The Richest Man in Babylon
  • Think and Trade Like a Champion
  • Value Investing and Behavioural Finance
  • Trading in the Zone
  • Learn to Earn
  • Book Summaries:
  • Rich Dad Poor Dad
  • Psychology of Money
  • The Intelligent Investor
  • The Richest Man in Babylon
  • Think and Trade Like a Champion
  • Value Investing and Behavioural Finance
  • Trading in the Zone
  • Learn to Earn
  • Tools:
  • CAGR Calculator
  • SIP Calculator
  • eLearnOptions
  • Future Value Calculator
  • Present Value Calculator
  • Atal Pension Yojana
  • Cost of Delay Calculator
  • Become a Crorepati
  • Tools:
  • CAGR Calculator
  • SIP Calculator
  • eLearnOptions
  • Future Value Calculator
  • Present Value Calculator
  • Atal Pension Yojana
  • Cost of Delay Calculator
  • Become a Crorepati

© 2025 Elearnmarkets. All Rights Reserved

  • Visit Elearnmarkets
  • Courses
  • Webinars
  • Financial Guides
  • Get Free Counselling
  • Visit Elearnmarkets
  • Courses
  • Webinars
  • Financial Guides
  • Get Free Counselling

Download Our App

No Result
View All Result
  • Article Categories
    • Basic Finance
    • Derivatives
    • Financial Planning
    • Fundamental Analysis
    • Technical Analysis
    • ETFs & Mutual Funds
    • Marketshala
    • Miscellaneous
  • Language
    • Hindi
    • Bengali
    • English
  • Courses
  • Webinars
  • Stories
Get Free Course

© 2024 Elearnmarkets All Rights Reserved

A Handbook of Technical Analysis
To start your trading journey as a seasoned technical analyst
Download Guide For FREE
Young Investors