
Many well-known contrarian traders are probably familiar to you that follow contrarian strategies.
Warren Buffet is a well-known trader who believes that the best time to enter a stock is when it has been beaten down.
Even George Soros, well-known for shorting the yen and the pound, made a tidy $2 billion in trading profits!
“The time to buy is when there’s blood in the streets,” said Baron Rothschild, a British nobleman, and member of the Rothschild banking family.
Contrarian trading is straightforward. You defy market expectations.
This means that you sell when others buy and buy when others sell. Many famous traders have made a living by trading in this manner. Warren Buffet, for example, is a well-known trader who employs this strategy.
Contrarian traders think differently than others. They do not trade based on fear and greed, as many traders who want to make a quick buck do.
So the polar opposite of a contrarian is someone who follows the herd and trades like everyone else.
So, in today’s blog, let us discuss some contrarian strategies that can be used in trading:
What is Contrarian Investing?
Contrarian investing is a strategy used by visionary investors who invest for the long term. These investors do not attempt to time the market. They analyze market movements to determine the direction of herd investors, and then they move in the opposite direction.
It is, however, a planned action—the decision to go against herd sentiment is supported by extensive market research. The investigation is narrowly focused on a single company. After all, the investment’s success or failure is determined by the company’s performance—business operations, SOP, and resource management.
Sometimes contrarians panic and reverse their decision, resulting in significant losses. Furthermore, portfolios do not reflect profits until stocks recover—investors must be patient with stock performance while tracking.
Contrarian Trading Strategy
A daily time frame will be used. Of course, you can use other time frames, but for contrarian trading strategies, we recommend using a daily chart.
Now that we’ve covered the fundamentals of a contrarian trader, let’s go over the strategy’s rules!
1. Check that stock that has been Trending Down since last 3 Months-
As previously stated, you can use this method with any market to apply these rules to whatever you are trading. We will use the example of SBI Life Insurance Ltd:
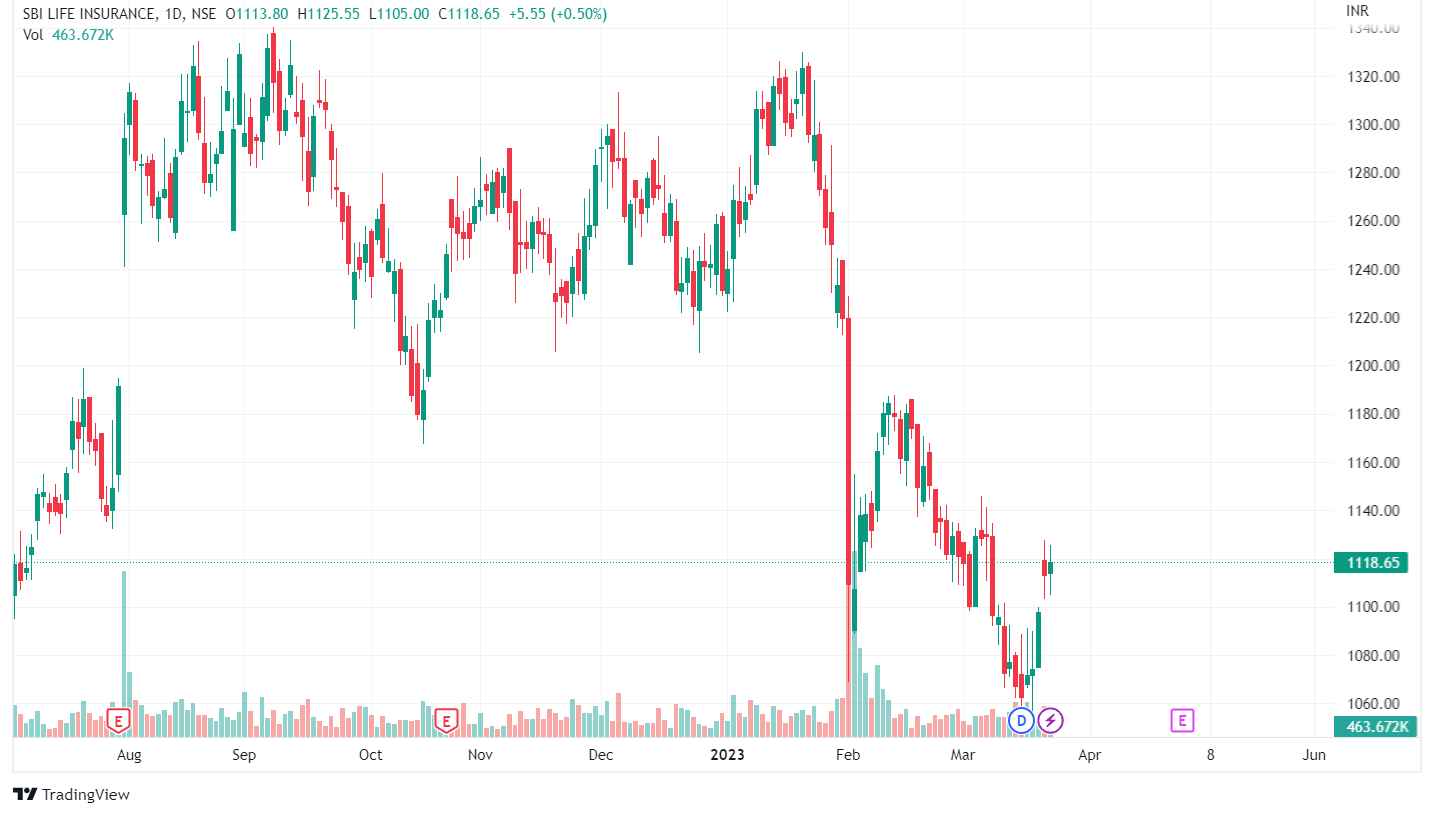
We need at least three months because many traders are beginning to panic. You want to panic with this strategy. Searching for 52-week lows is an excellent way to find these.
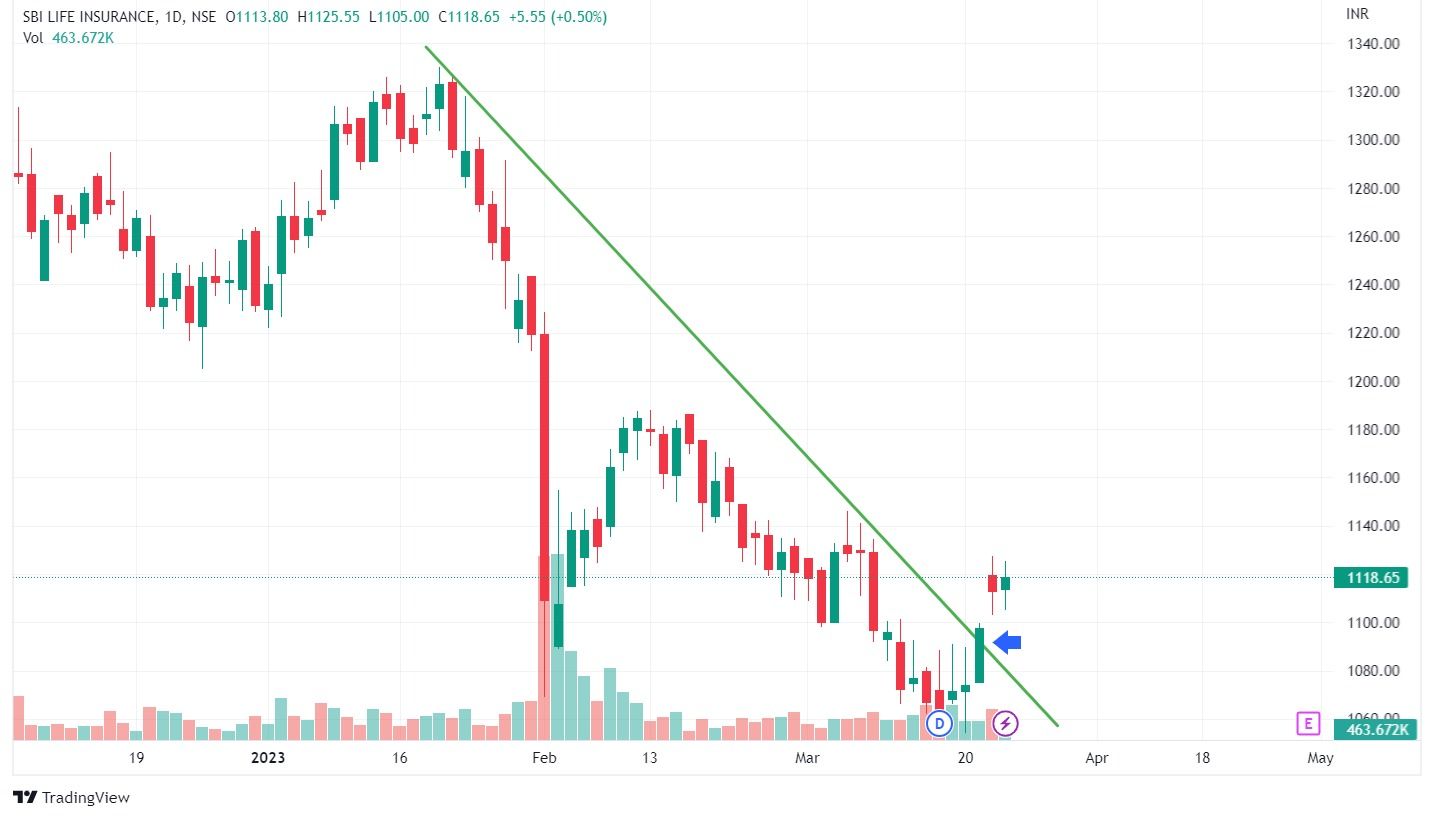
2. Draw Trendline
A trendline can be incredibly simple to draw. However, to ensure that you understand exactly how to do this, read the trendline article here.


This is how the trendline should look. In this case, it has already broken, which is great news because we can now proceed to rule #3.
3. Price Break Trendline
You are waiting for a daily candle to break through your trendline. To be considered a break, the price must close the daily candle above the trendline.
4. Wait for Sideways Market
Remember, there has been a lot of fear in recent months, so many traders are looking for a trendline break in the hopes that it will rise again.
Because contrarian investors do not buy when everyone else does, this is where an intelligent contrarian investor will hold out.
Most will return when a trendline is broken, so we must wait for a sideways move and enter when others are no longer interested.
When a pair, a stock, or a cryptocurrency goes sideways, traders tend to lose interest in it.
This is when the contrarian trader comes into play!
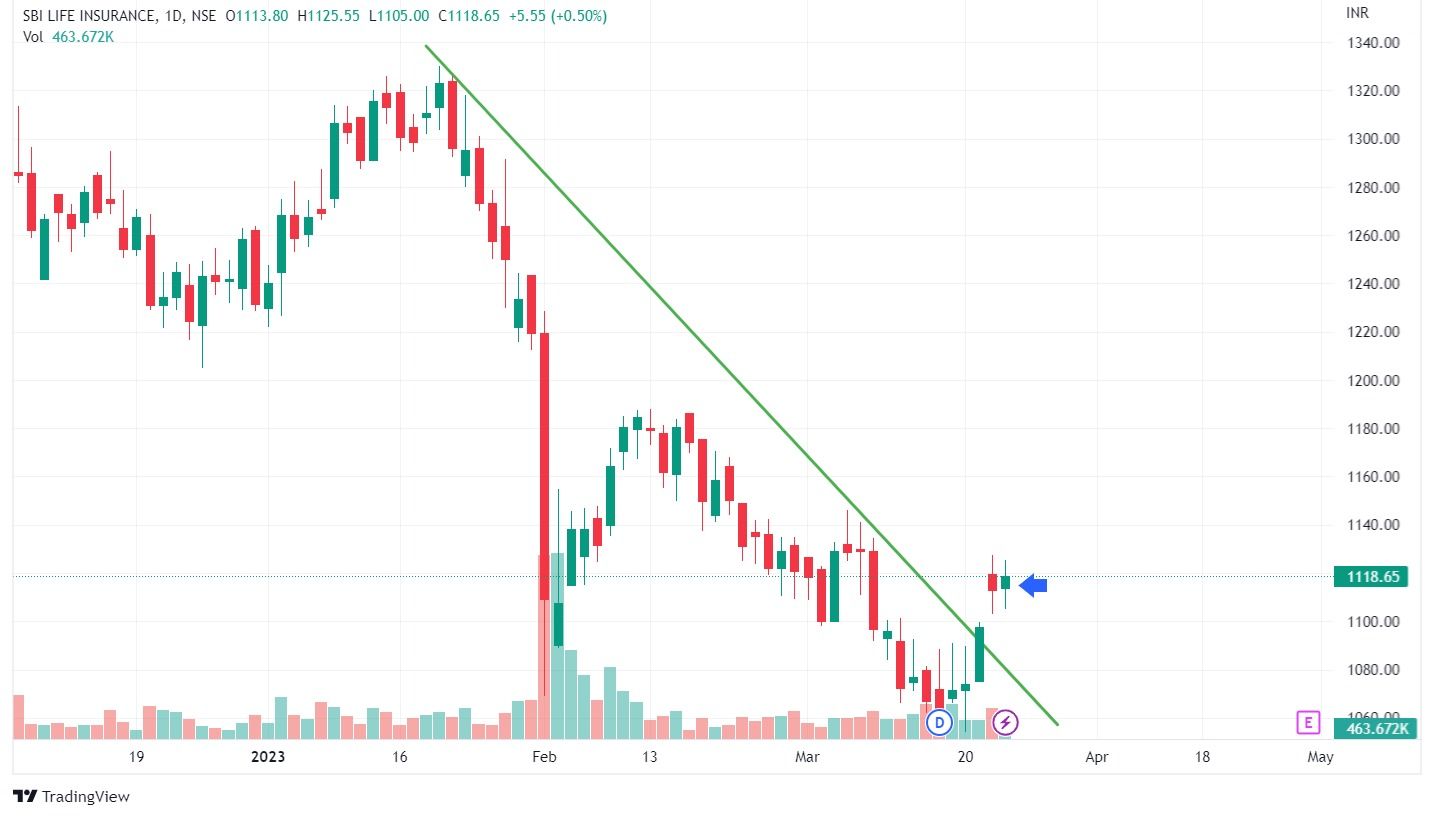
5. Breakout from Sideways Market
This can be accomplished by either drawing an additional trendline or simply watching price action, as it will be obvious.
After you’ve entered your position, it’s time to set your stop loss.
6. Stop-loss and Profit Target
A stop loss should always be considered by traders. The stop-loss order should be placed a few points below the lowest price. We recommend trailing your stop-loss as a take-profit target.
You can also join our Trading Mentorship Program
Bottomline
Stick to the rules and your convictions. Don’t get caught up in emotional trading; it’s one of the worst mistakes a trader can make. So, if you’re looking for the best contrarian trading strategies, the best contrarian investing strategies, and how to become a contrarian trading master, then stick to the strategy outlined above!
We hope you found this blog informative and use the information to its maximum potential in the practical world. Also, show some love by sharing this blog with your family and friends and helping us spread financial literacy.
Interested in Trading? Then join our online trading course in hindi and enhance your skills now!
Also, Hop in to the advanced microsoft excel course now and enhance your financial skills!
Happy Investing!


