Elearnmarkets - Financial Market Learning
  • Categories
    • Basic Finance
    • Derivatives
      • Futures
      • Options
    • Financial Planning
    • Fundamental Analysis
    • Technical Analysis
    • Marketshala
    • Miscellaneous
  • Language
    • English
    • Hindi
    • Bengali
No Result
View All Result
  • Courses
  • Webinars
  • Stories
Elearnmarkets - Learn Stock Market, trading, investing for Free
No Result
View All Result
Home Technical Analysis
5 important roles of Relative Strength Index (RSI) 1

5 important roles of Relative Strength Index (RSI)

Elearnmarkets by Elearnmarkets
September 11, 2023
in Technical Analysis, Charts, Patterns & Indicators
Reading Time: 10 mins read
4
41.3k
VIEWS
Share on FacebookShare on XShare on WhatsApp

Relative Strength Index (RSI) is a momentum oscillator, developed by J. Welles Wilder, which measures the speed and velocity of price movement of trading instruments (stocks, commodity futures, bonds, forex etc.) over a specified period of time.

The objective of RSI indicator is to measure the change in price momentum.

It is a leading indicator and is widely used by Technical Analysts over the globe.

RSI can be used to spot a general trend.

It is considered overbought when it goes above 70 and oversold when it goes below 30

 Moreover, RSI can also be used to look for failure swings, divergences and centre line crossover.

Table of Contents

  • What is the Relative Strength Index?
  • RSI Calculation
  • 5 Important Roles of Relative Strength Index
    • 1. Trendline Application
    • 2. Pattern Breakout
    • 3. Advance breakout and breakdown
    • 4. Role of 50
    • 5. Failure swing
  • Using RSI Scans in StockEdge
  • Watch the video below to learn How to trade with the Relative Strength Index:
  • Bottomline

What is the Relative Strength Index?

Technical analysis uses the momentum indicator known as the Relative Strength Index (RSI). In order to assess whether an investment is overvalued or undervalued, it evaluates the frequency and size of recent price changes. An oscillator (a line graph) representing the RSI is shown, with a scale from 0 to 100.

RelatedPosts

5 Important Volatility Indicators that Traders should know 5

5 Important Volatility Indicators that Traders should know

September 19, 2023
57.9k
Top 5 Momentum Indicators that Analyses Trend Strength 6

Top 5 Momentum Indicators that Analyses Trend Strength

September 7, 2023
93.2k
NR4 and NR7 Trading Strategy Setup 7

NR4 and NR7 Trading Strategy Setup

September 14, 2023
82.3k

J. Welles Wilder was the one who created the RSI. The RSI is typically regarded as overbought when it rises above 70 and oversold when it falls below 30. The RSI provides immediate buy and sell signals.

RSI Calculation

The formula for relative strength index calculation is as follows –

RSI = 100 – 100 / (1 + RS)
RS  =  Average Gain over a specified period/ Average loss over the same period

The default setting for the Relative Strength Index is 14, but you may change this value to decrease or increase sensitivity based on your requirement.

For instance, a 12-day RSI is more likely to reach overbought or oversold levels than a 24-day RSI.

5 Important Roles of Relative Strength Index

Apart from reading overbought and oversold conditions, there are certain special features in the relative strength index. Those are as follows-

1. Trendline Application

It is an interesting fact that the relative strength index and the closing chart almost go hand in hand.

Sometimes it becomes difficult to differentiate which one is RSI and which one is the closing chart.

We apply trend lines in the closing chart may it be up or down.

Similarly, we can apply closing trend lines in the same manner in RSI.

It is interesting to know that RSI trend lines would be broken at least 3-4 days before and this gives an advanced signal that price is going to break the same trend line within a day or two.

Relative Strength Index

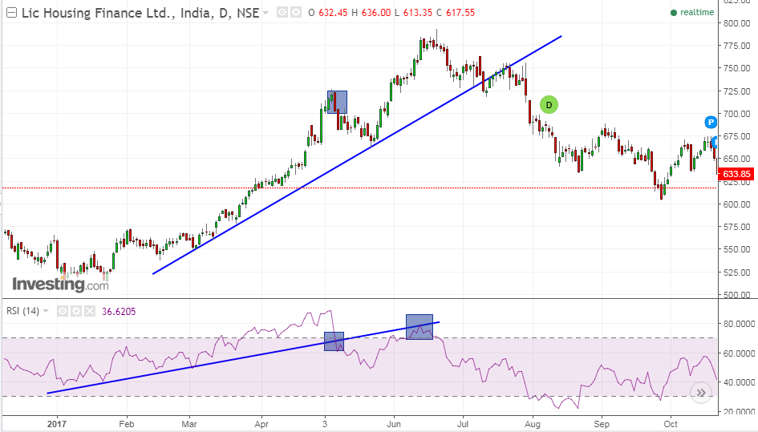
The above is the chart of LIC Housing Finance and as we can see RSI already gave an advanced sell signal.

The first sell signal came on 9th May 2017 when RSI breached the uptrend line and the second sell signal came in on 14th June 2017, when the RSI bounced after breaching the uptrend line and faced a strong resistance from the uptrend line in RSI as shown in the chart.

Soon after the second sell signal came in, the stock corrected about 25% from its high.

2. Pattern Breakout

We know that the formation of the pattern is an interesting phenomenon in building the chart. Any pattern it be reversal or continuation will stage a breakout at a particular point in time.

It is again interesting to know as RSI considers the underlying relative strength of a stock over a specified period of time. Such breakout will occur at least 2-3 days in advance in RSI which price will follow in due course.

pattern breakout

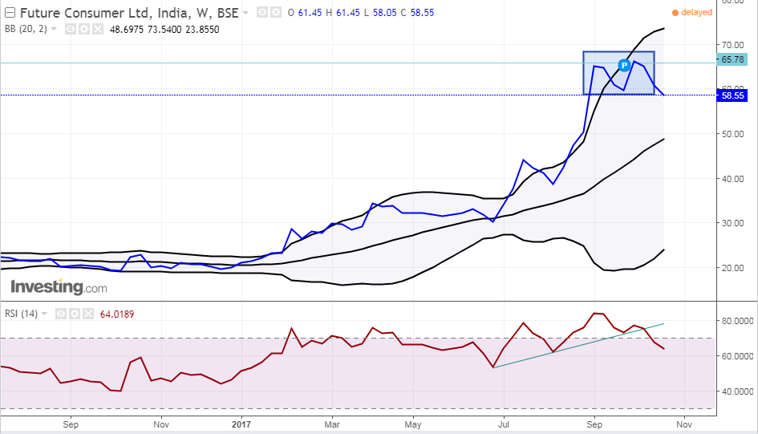
The above is the chart of Future Consumer where there was a head and shoulder pattern was there in RSI. At the same time, there was a double top formation at the top and M-top formation in Bollinger bands which rather confirmed our sell signal. Soon after the RSI line breached the neckline, there was a good correction in the price.

3. Advance breakout and breakdown

The concept of advance breakout and breakdown works wonderfully in OBV indicators.

The same logic is true also in the case of RSI.

An advance breakout implies when the indicator (RSI here) has breached the previous top while the price hasn’t breached the previous top yet.

So it’s basically an advanced or early signal that indicates that price will also follow the indicator in the coming few sessions.

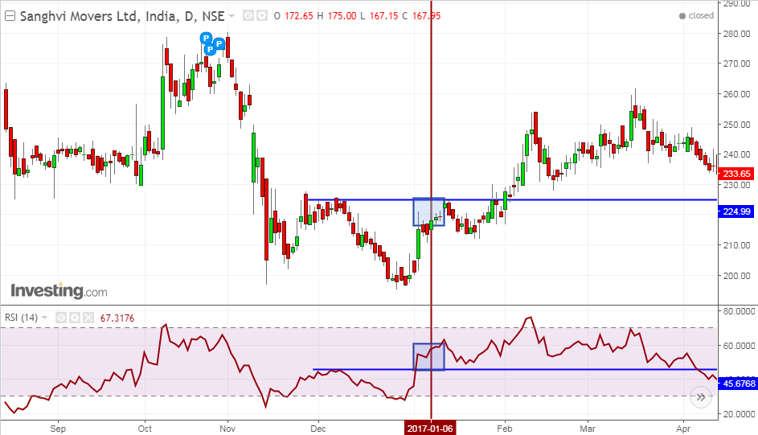
Below is the chart of Sanghvi movers, as we closely watch the RSI line, we can see that RSI already breached the previous resistance but the price still hovering below the previous resistance.

Soon after the price breakout, the stock witnessed a good rally.

5 important roles of Relative Strength Index (RSI) 2

Similarly, in case of advanced breakdown, the indicator has breached the previous bottom but the price is still below or at the previous bottom, thus giving an early signal that the price may soon break the previous bottom and see some correction in the coming days.

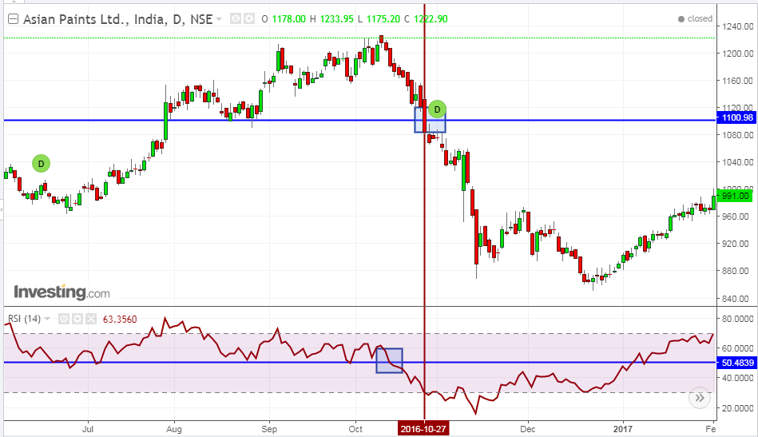
Below is the price chart of Asian paints where we can clearly see that the relative strength index(RSI) breached its previous support quite before. Soon after the price also followed the same and witnessed a strong correction almost from its highs.

advanced breakdown asian paints

4. Role of 50

In the relative strength index, the mid-50 line acts as a very important line to indicate the price direction.

It is usually seen that the price continues to stay above the mid-50 line during the bullish phase while it faces strong resistance from the 50 lines in RSI during the bearish phase of the market.

However, there may be a lot of whipsaws in the daily chart, so it’s better to look at the bigger timeframe chart say the weekly chart.

rsi 50 trading

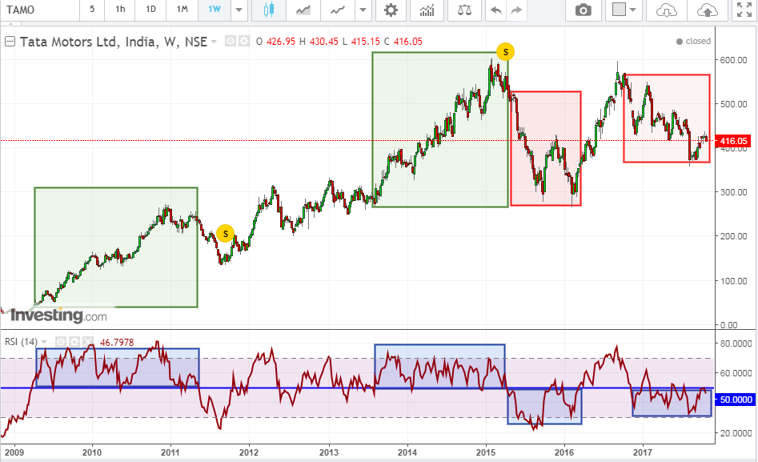
The above is the chart of Tata Motors and we can see that whenever the RSI is maintained above the mid-50 line, the stock is in the bullish mode while when the price is below the mid-50 line, the stock shows good correction.

In short, we can say that the mid-50 line in RSI acts as a good trend changer.

5. Failure swing

A bullish failure swing forms when RSI moves below 30 (oversold), bounces above 30, pulls back, holds above 30 and then breaks its prior high.

It is basically a move to oversold levels and then a higher low above oversold levels.

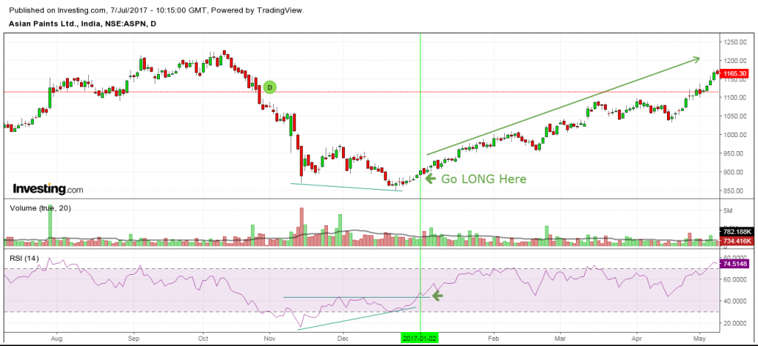
Below is the chart of Asian Paints where there is a clear failure swing in RSI. Soon after the resistance broke in RSI, the stock witnessed a good rally.

failure swing

A bearish failure swing forms when RSI moves above 70, pulls back, bounces, fails to exceed 70 and then breaks its prior low.

It is basically a move to overbought levels and then a lower high below overbought levels.

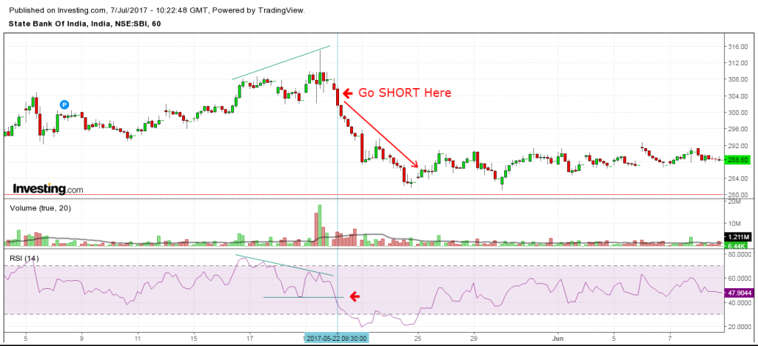
Below is the chart of SBI where there is a clear failure swing in RSI. Soon after the support was broken in the relative strength index, the stock saw a good correction within a month’s time.

sbi failure swing chart

Using RSI Scans in StockEdge

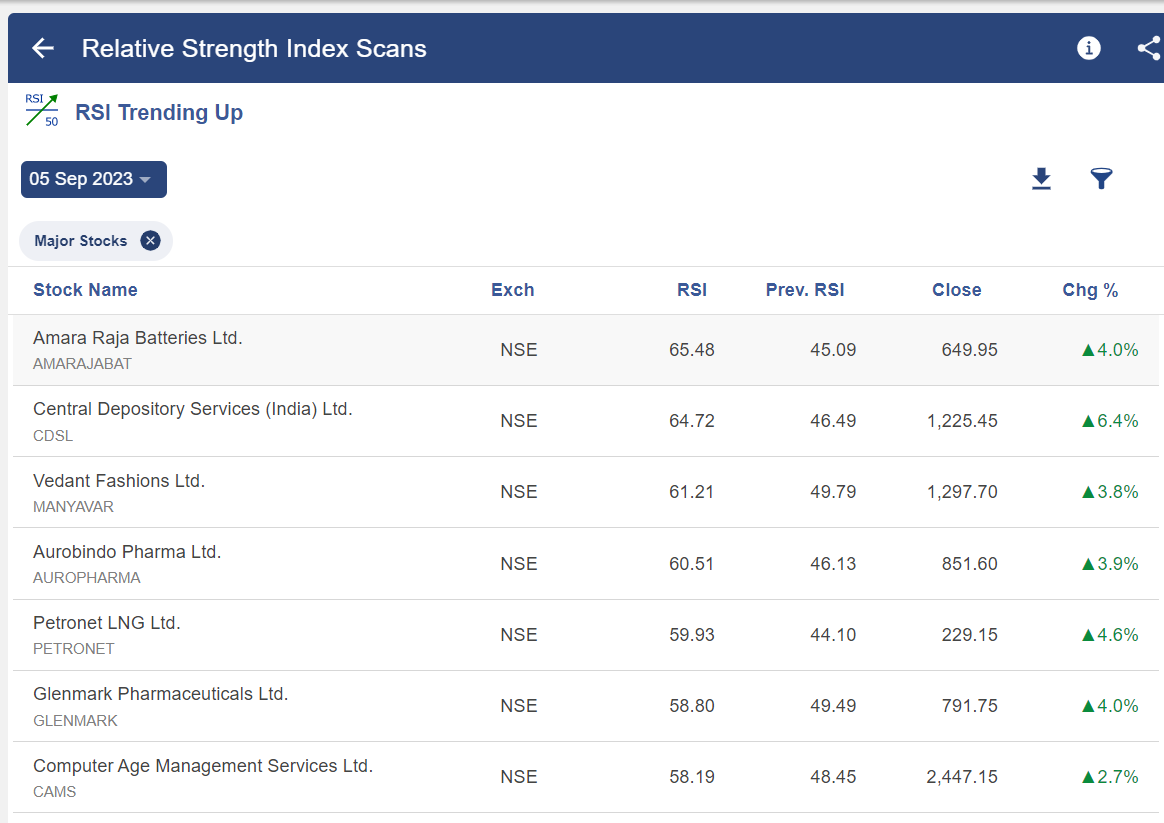
Below are the RSI Scans available in StockEdge through which you can filter out stocks based on the following criteria:

5 important roles of Relative Strength Index (RSI) 3

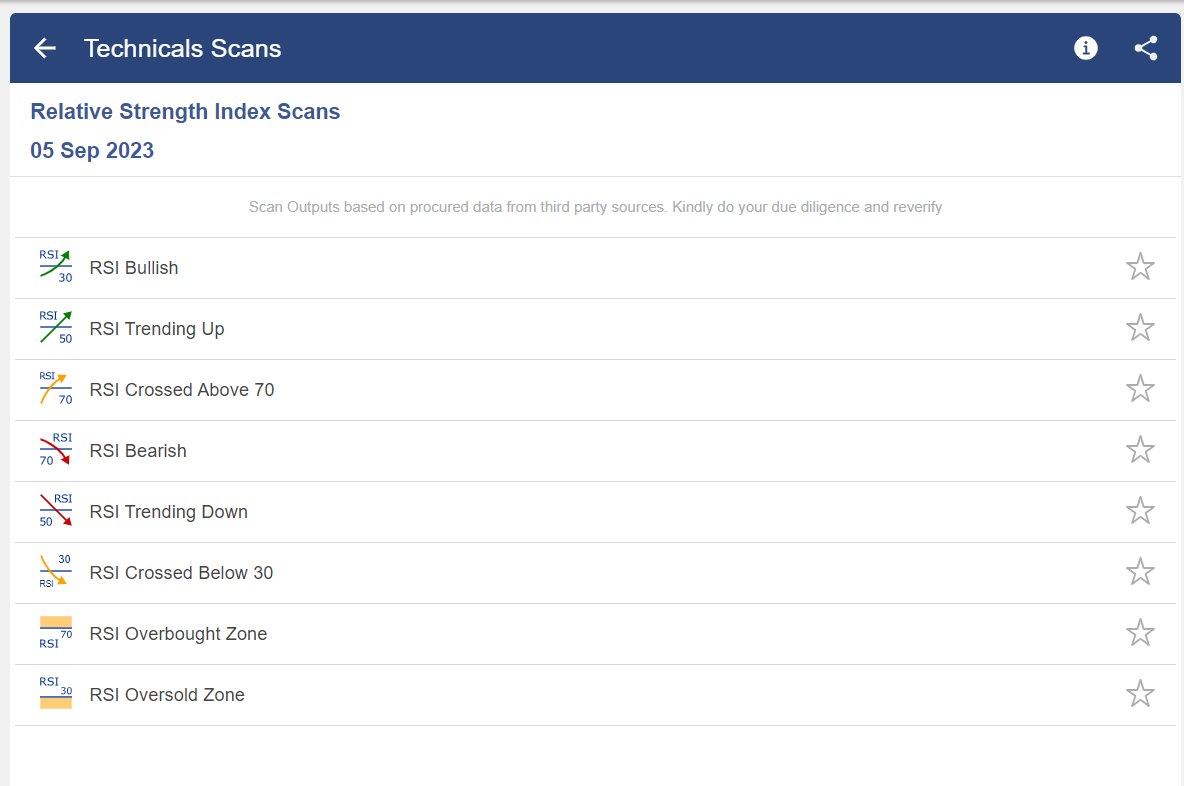
Once you select any of the scans above, you will get a list of stocks, that fulfil that criteria as shown below:

5 important roles of Relative Strength Index (RSI) 4

Watch the video below to learn How to trade with the Relative Strength Index:

Bottomline

Just like other indicators, the signal quality will also depend upon the characteristics of the underlying security. The relative strength index should also be used in conjunction with other indicators and technical parameters to generate better and more confirmed trading signals.

Tags: englishFailure swingRelative STrength IndexrsiRSI Indicatorrsi trading strategyrsi wildertechnical analysis
ShareTweetSend
Get Kotak Offer Get Kotak Offer Get Kotak Offer
Previous Post

Options Trading Vs Intraday Trading – Which is Right For You?

Next Post

Top 5 Momentum Indicators that Analyses Trend Strength

Elearnmarkets

Elearnmarkets

Elearnmarkets (ELM) is a complete financial market portal where the market experts have taken the onus to spread financial education. ELM constantly experiments with new education methodologies and technologies to make financial education effective, affordable and accessible to all. You can connect with us on Twitter @elearnmarkets.

Related Posts

5 Important Volatility Indicators that Traders should know 8
Technical Analysis

5 Important Volatility Indicators that Traders should know

September 19, 2023
57.9k
Top 5 Momentum Indicators that Analyses Trend Strength 9
Technical Analysis

Top 5 Momentum Indicators that Analyses Trend Strength

September 7, 2023
93.2k
NR4 and NR7 Trading Strategy Setup 10
Technical Analysis

NR4 and NR7 Trading Strategy Setup

September 14, 2023
82.3k
Renko Charts-How to trade Efficiently with Renko Charts? 11
Technical Analysis

Renko Charts-How to trade Efficiently with Renko Charts?

August 28, 2023
4.3k

Comments 4

  1. Rajat says:
    6 years ago

    Thanks for sharing these useful techniques

    Reply
  2. Viraj says:
    3 years ago

    Oho Thank you for your useful information.
    That is very very useful for beginners.

    Thank a lot team.

    Reply
  3. mohammad hosein says:
    2 years ago

    this article is one of best articles about RSI .
    thank you man

    Reply
    • Sakshi Agarwal says:
      2 years ago

      Hi,

      We are glad that you liked our post.

      Thank you for Reading!

      Reply

Leave a Reply Cancel reply

Your email address will not be published. Required fields are marked *

Elearnmarkets Logo

Follow Us

Facebook-f Twitter Instagram Linkedin-in Youtube Telegram

Register on Elearnmarkets

Continue your financial learning by creating your own account on Elearnmarkets.com

Register Free Account

Download App

Playstore logo
Download on app store

Categories

  • Basic Finance
  • Derivatives
  • Financial Planning
  • Fundamental Analysis
  • Technical Analysis
  • Marketshala
  • Miscellaneous

Popular On Elearnmarkets

  • Market Superheroes:
  • Vivek Bajaj
  • Chetan Panchamia
  • Ashish Kyal
  • Premal Parekh
  • Abhijit Paul
  • Jegan
  • Sivakumar Jayachadran
  • Vishal Malkan
  • Jyoti Budhia
  • Vivek Gadodia
  • Vishal Mehta
  • Piyush Chaudhry
  • Santosh Pasi
  • Gomathi Shankar
  • Market Superheroes:
  • Vivek Bajaj
  • Chetan Panchamia
  • Ashish Kyal
  • Premal Parekh
  • Abhijit Paul
  • Jegan
  • Sivakumar Jayachadran
  • Vishal Malkan
  • Jyoti Budhia
  • Vivek Gadodia
  • Vishal Mehta
  • Piyush Chaudhry
  • Santosh Pasi
  • Gomathi Shankar
  • Courses:​
  • Options Trading
  • Dow Theory
  • Momentum Trading
  • Stock Investing
  • Stock Market for Beginners
  • Harmonic Chart Patterns
  • Algo Trading
  • Elliot Wave Theory
  • Advanced Excel
  • Cryptocurrency
  • NSE Certification Course
  • Courses:​
  • Options Trading
  • Dow Theory
  • Momentum Trading
  • Stock Investing
  • Stock Market for Beginners
  • Harmonic Chart Patterns
  • Algo Trading
  • Elliot Wave Theory
  • Advanced Excel
  • Cryptocurrency
  • NSE Certification Course
  • Webinars:
  • Bank Nifty Scalping
  • Intraday Trading Strategies
  • Options Trading Strategies
  • Options selling
  • Price Action
  • Relative Strength
  • Tax Planning
  • Options Buying
  • Growth Stocks
  • Portfolio Management
  • Relative Strength Index
  • Risk Management
  • Renko Charts
  • Crude Oil
  • Traders Psychology
  • Moving Average
  • Multibagger Stocks
  • Free Learning Modules:
  • Intraday Trading
  • Options Scalping
  • Swing Trading
  • Financial Modelling
  • RSI Indicator
  • Bollinger Bands
  • Pricing of Futures
  • Personal Finance
  • Initial Public Offerings (IPO)
  • Value Investing
  • Technical Indicators
  • Candlesticks
  • Chart Patterns
  • Option Greeks
  • ELSS Funds
  • Banking and Insurance
  • Real Estate
  • Gold
  • Book Summaries:
  • Rich Dad Poor Dad
  • Psychology of Money
  • The Intelligent Investor
  • The Richest Man in Babylon
  • Think and Trade Like a Champion
  • Value Investing and Behavioural Finance
  • Trading in the Zone
  • Learn to Earn
  • Book Summaries:
  • Rich Dad Poor Dad
  • Psychology of Money
  • The Intelligent Investor
  • The Richest Man in Babylon
  • Think and Trade Like a Champion
  • Value Investing and Behavioural Finance
  • Trading in the Zone
  • Learn to Earn
  • Tools:
  • CAGR Calculator
  • SIP Calculator
  • eLearnOptions
  • Future Value Calculator
  • Present Value Calculator
  • Atal Pension Yojana
  • Cost of Delay Calculator
  • Become a Crorepati
  • Tools:
  • CAGR Calculator
  • SIP Calculator
  • eLearnOptions
  • Future Value Calculator
  • Present Value Calculator
  • Atal Pension Yojana
  • Cost of Delay Calculator
  • Become a Crorepati

© 2023 Elearnmarkets. All Rights Reserved

  • Visit Elearnmarkets
  • Courses
  • Webinars
  • Financial Guides
  • Get Free Counselling
  • Visit Elearnmarkets
  • Courses
  • Webinars
  • Financial Guides
  • Get Free Counselling

Get Elearnmarkets App

No Result
View All Result
  • Article Categories
    • Basic Finance
    • Derivatives
    • Financial Planning
    • Fundamental Analysis
    • Technical Analysis
    • Marketshala
    • Miscellaneous
  • Language
    • Hindi
    • Bengali
    • English
  • Courses
  • Webinars
  • Stories

© 2020 Elearnmarkets All Rights Reserved

View Details
View Course Details
Guidebook On Chart Patterns
Take Your Trading To The Next Level With Strategies Shared In This Ebook
Download Now