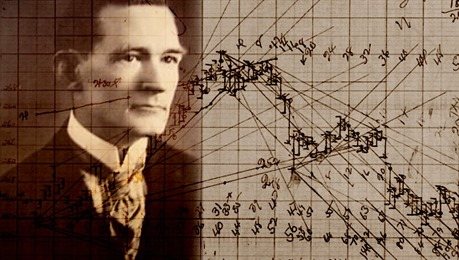
Gann Techniques are technical analysis tools that were developed by the renowned financial trader William Delbert Gann (WD Gann), during his career on Wall Street which spanned the first half of the twentieth century.
As per the Gann technique goes, we have been given certain rules which are known as Gann techniques. The most interesting aspect of this is that regardless of the time it holds true across all the markets.

Top 15 important Gann Techniques: –
1. If a high price of any week is achieved on Friday, then expect higher prices in the next week.
2. If the low price of the week is achieved on Friday, it indicates lower price next week.
3. In a highly up trending market, weekly lows are generally achieved on Tuesday.
4. If a price crosses the high of the last 3 days at least by 3 rupees, it is a buy signal on the fourth day and the stop loss to be placed below 3 rupees of the 3 day high.
Also Read: 17 Principles of W.D.Gann that will discipline your trading style
5. If the low of the last 3 days is broken by 3 rupees, then it is a sell signal on the fourth day. Sell the stock on the fourth day and keep a stop loss of 3 rupees above the last 3 day low.
6. 50% of the last highest rate is one of the strongest place to buy. Any accumulation at the 50% zone has to be with the strict stop loss of 5 rupees or 1% of the stock value.
7. If the subsequent correction is greater than the previous correction, both in terms of price and time magnitude, then it is an early signal of a trend reversal.
8. If a previous stock either on weekly chart or on monthly chart is crossed by 5 rupees on closing basis, then it should not retrace 5 rupees below the previous stock on a closing basis.
9. If the main trend is up, correction will not last more than 4 weeks.
10. If the main trend is down, no retracement rally will last for more than 4 weeks.
11. If the price is constantly rising for 5 days, then there is every chance that correction will last for at least 3 days. Time frame could be any. The ratio is 5:3.
12. Once price is in a consolidation phase, suddenly one day there is a volume spike, it is an early indication that trend might change.
13. If a market is constantly rising for 9 days, there is an every chance that a correction would last for 5 days. Time frame could be any. Ratio is 9:5.
14. In a highly trending market once price closes below 30 DMA and remains below at least for 3 consecutive days, it foretells that further correction to be continued.
15. Whenever a stock rising from a level of 100% or Rs 100 whichever is earlier, becomes a strong resistance.

BOTTOMLINE
Visit Elearnmarkets to get avail free and premium courses on Financial Markets.
Check stockedge to get latest market updates and get technical and fundamental scans.


EXCELLENT