Elearnmarkets - Financial Market Learning
  • Courses
  • Webinars
  • Stories
  • Language
    • English
    • Hindi
    • Bengali
No Result
View All Result
Get Free Course
  • Basic Finance
  • Derivatives
    • Futures
    • Options
  • Financial Planning
  • Fundamental Analysis
  • Technical Analysis
  • Mutual Funds
  • Marketshala
  • Miscellaneous
Elearnmarkets - Learn Stock Market, trading, investing for Free
  • Courses
  • Webinars
  • Stories
  • Language
    • English
    • Hindi
    • Bengali
No Result
View All Result
Get Free Course
Elearnmarkets - Learn Stock Market, trading, investing for Free
No Result
View All Result
Home Technical Analysis
Golden Crossover Strategy

What is the Golden Crossover Strategy?

Vivek Bajaj by Vivek Bajaj
September 28, 2024
in Technical Analysis
Reading Time: 9 mins read
1
2.9k
VIEWS
Share on FacebookShare on XShare on WhatsApp

One of the most profitable moving average strategies that investors follow is the golden crossover strategy.

When an asset’s 50-day short-term moving average crosses over its 200-day long-term moving average, the market displays a golden cross, a momentum technical indicator. 

A golden crossover indicates that a bullish reversal may take place.

Many investors view the Golden Cross as the Holy Grail of chart patterns. Want to know more about how this indicator works? Then keep reading below-

Table of Contents

  • Concept of Golden Crossover Strategy
  • How to Identify a Golden Cross on a Chart?
    • First Stage 
    • Second Stage
    • Third Stage
  • How to Use the Golden Crossover Strategy?
  • Benefits of Investing in Indian Golden Cross Stocks
    • 1. Less risk
    • 2. Possibility of sustained growth
    • 3. Major returns
    • 4. Diversification
  • Conclusion
  • Frequent Ask Questions (FAQ)
    • How to read a golden cross?
    • Is Golden Cross profitable?
    • How to find golden crossover stocks?

Concept of Golden Crossover Strategy

When a very short-term moving average crosses above a long-term moving average, it forms a golden cross pattern on the chart.

 When a security’s short-term moving average (like the 50-day moving average) crosses over its long-term moving average (like the 200-day moving average) or resistance level, a bullish breakout pattern known as a golden cross is created.

What is the Golden Crossover Strategy? 1

The golden cross suggests the probability of the emergence of a long-term bull market. The indication is often strengthened by high trading volumes.

How to Identify a Golden Cross on a Chart?

As a momentum indicator, the golden cross signifies that prices are steadily rising and accumulating momentum. Instead of being bearish, traders and investors now have bullish outlooks.

 Typically, the indicator consists of three stages-
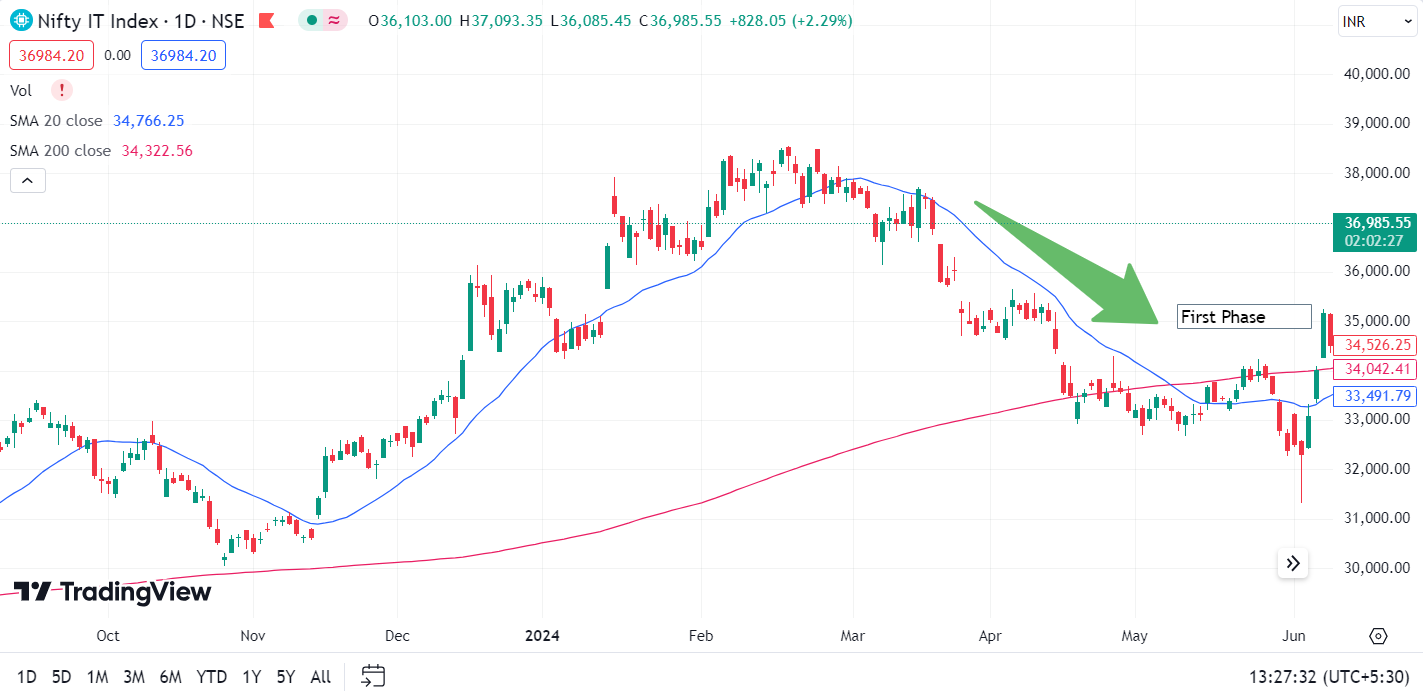
First Stage 

There is a fall in the first phase, but it is almost over because there is more interest in buying than in selling.
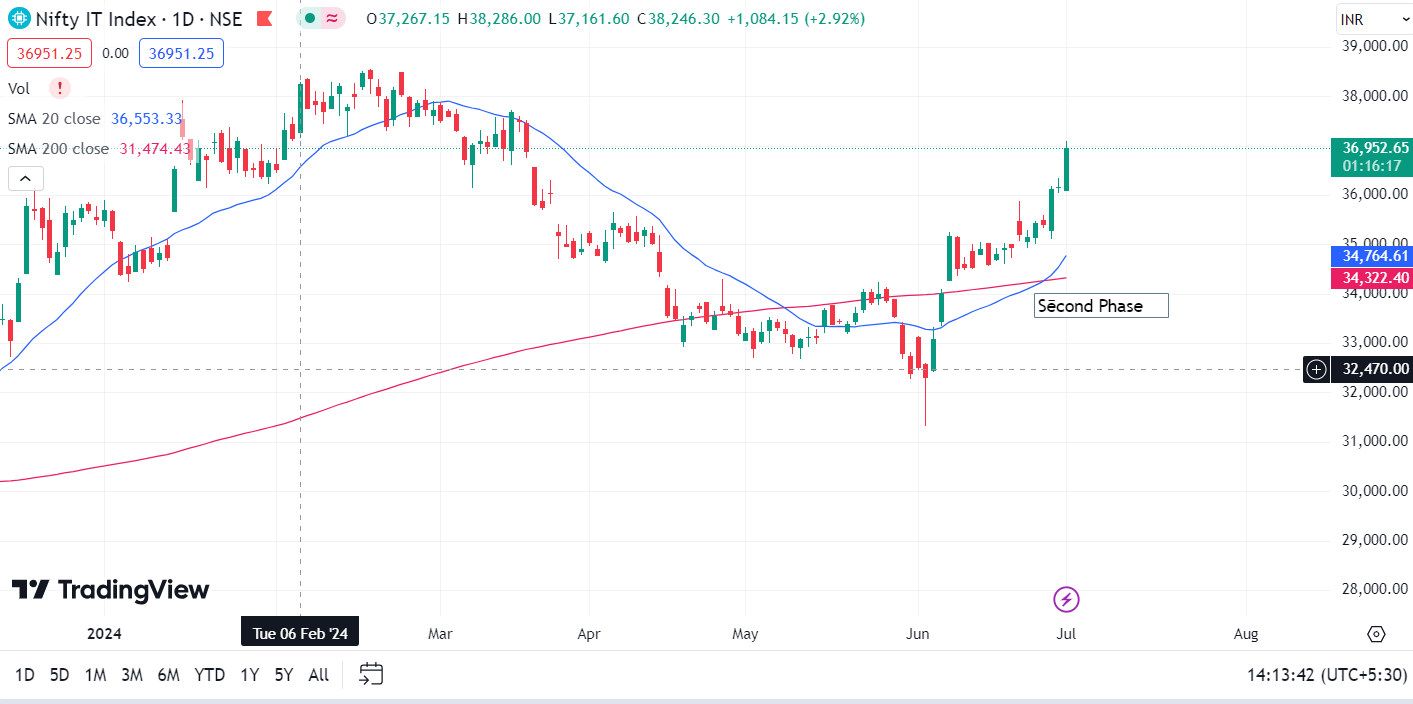
What is the Golden Crossover Strategy? 2

Second Stage

In the second phase, there comes a fresh upsurge. The new uptrend’s breakout is identified when the short-term average forms the Golden Cross, crossing from below to above the long-term average.

What is the Golden Crossover Strategy? 3

Third Stage

At the conclusion of this phase, the bull market is confirmed by the new trend’s ongoing advances. If a corrective negative retracement happens during this phase, the Golden Cross two-moving average should serve as a level of support. As long as the 50-day moving average and the price are both below 200 days, a bull market is considered to be in place.

How to Use the Golden Crossover Strategy?

Here are some points for using the Golden Crossover Strategy-

  • The golden cross can be a useful tool for traders looking to make informed decisions. Rather than depending just on volume and price swings, you can identify possible chances far faster if you monitor this pattern closely in your charts. 

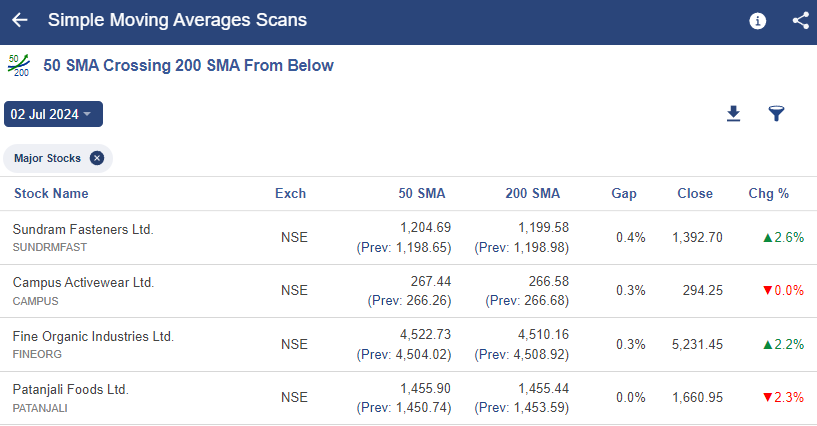
You can filter out stocks with Golden Crossovers with the help of StockEdge as shown below-

What is the Golden Crossover Strategy? 4
  • Gold crosses can also be used in conjunction with other technical indicators. Use support and resistance levels or trend lines, for instance, to guide your trading decisions.
  • Any macroeconomic influences that are at work—such as economic news—should be considered. It will let you decide whether to utilize all of the benefits that this design has to offer or not.
  • A Golden Crossover is a useful indicator, but it’s not foolproof. It is advisable to employ supplementary technical indicators such as relative strength index (RSI) or volume in order to validate the upward trend and possible purchasing opportunity.
  • Golden Crossovers may serve as false signals that cause prices to reverse or go into brief uptrends.
  • Examine the moving averages’ slope following the crossing. A stronger possible uptrend is indicated by a steeper slope.

Benefits of Investing in Indian Golden Cross Stocks

Here are some Benefits of Investing in Indian Golden Cross Stocks

What is the Golden Crossover Strategy? 5

1. Less risk

A Golden Crossover implies that a market is shifting from being bearish to a bullish one. This could mean stocks in downtrends are less likely to experience sudden declines in their prices as compared to other such investments during the short-term (after all, past performance doesn’t predict future results).

2. Possibility of sustained growth

With this Golden Crossover comes the potential for ongoing long-term growth that is supported by both its short-term momentum and underlining company fundamentals change. This means there might be some kind of steady increase in value over longer periods.

3. Major returns

However, if the uptrend following the Golden Crossover is strong and sustained, it could lead to significant returns on your investment. Yet, remember that stock markets are inherently risky, and not every investment will give you good returns.

4. Diversification

The inclusion of these kinds of stocks into your portfolio can help diversify your holdings as well as potentially enhance its risk-adjusted returns. This has something to do with the fact that such stocks have chances of showing different behaviour in certain stages when compared to the market’s overall movement.

Conclusion

A popular technical analysis tool for figuring out when to enter and quit the stock market is the Golden Cross. Like all technical indicators, it could be more reliable, though. As a result, you need to combine it with other chart patterns and technical indicators.

Frequent Ask Questions (FAQ)

How to read a golden cross?

Shorter-term 50-day moving average crosses over longer-term 200-day moving average. This suggests that the longer-term trend may give way to the shorter-term momentum, potentially resulting in an upswing.

Is Golden Cross profitable?

Although the Golden Cross may point to an impending price increase, it is not a surefire way to make money.

How to find golden crossover stocks?

Many online trading platforms and charting tools offer features to identify Golden Cross patterns on charts such as StockEdge

Tags: basicenglishgolden crossover strategytechnical analysis
ShareTweetSend
Get Kotak Offer Get Kotak Offer Get Kotak Offer
Previous Post

What is NAV in Mutual Funds and Why It Matters ?

Next Post

The Advantages of Mutual Funds: A Beginner’s Guide

Vivek Bajaj

Vivek Bajaj

Mr. Vivek Bajaj has over 18 years of trading experience in equities, options, currencies, and commodity markets. He is the co-founder of Stockedge and Elearnmarkets and is passionate about data, analytics, and technology. He serves on various exchange committees and has played a significant role in the evolution of India's derivative market. He has been a speaker at various colleges and higher institutions, including IIT and IIMs.

Related Posts

Understand Slippage in Trading
Technical Analysis

What is Slippage in Trading? Meaning & Examples

March 28, 2025
374
Breakout trading strategies
Technical Analysis

Top 5 Breakout Trading Strategies

March 12, 2025
1.3k
5 stocks for today
Technical Analysis

5 Stocks to Buy Today That Could Beat the NIFTY in 2025!

May 5, 2025
457
Image describing What is marginal trading facility
Technical Analysis

 What is a Margin Trading Facility? Advantages & Risks

April 4, 2025
866

Comments 1

  1. Anshul Jain says:
    10 months ago

    Beautiful 🙂 literally that’s enough👍🏻

    Reply

Leave a Reply Cancel reply

Your email address will not be published. Required fields are marked *

Disclaimer

Elearnmarkets (Kredent InfoEdge Pvt. Ltd.) is a SEBI-registered Research Analyst (RA) entity (SEBI Registration No.: INH300007493). The information provided in this article is for educational and informational purposes only and should not be considered as an offer to buy or sell any securities or investment products.

The stocks, securities, and investment instruments mentioned herein are not recommendations under SEBI (Research Analysts) Regulations, 2014. Readers are advised to conduct their own due diligence and seek independent financial advice before making any investment decisions.

Investments in securities markets are subject to market risks. Please read all related documents carefully before investing. Investing in Equity Shares,
Derivatives, Mutual Funds, or other instruments carry inherent risks, including potential loss of capital. Elearnmarkets (Kredent InfoEdge Pvt. Ltd.) does not provide any guarantee or assurance of returns on any investments. Past performance is not indicative of future performance.

Elearnmarkets Logo

Follow Us

Facebook-f X-twitter Instagram Linkedin-in Youtube Telegram

Register on Elearnmarkets

Continue your financial learning by creating your own account on Elearnmarkets.com

Register Free Account

Download App

Playstore logo
Download on app store

Categories

  • Basic Finance
  • Derivatives
  • Financial Planning
  • Fundamental Analysis
  • Technical Analysis
  • Mutual Funds
  • Miscellaneous

Popular On Elearnmarkets

  • Market Superheroes:
  • Vivek Bajaj
  • Chetan Panchamia
  • Ashish Kyal
  • Premal Parekh
  • Abhijit Paul
  • Jegan
  • Sivakumar Jayachadran
  • Jyoti Budhia
  • Vivek Gadodia
  • Vishal Mehta
  • Piyush Chaudhry
  • Santosh Pasi
  • Gomathi Shankar
  • Market Superheroes:
  • Vivek Bajaj
  • Chetan Panchamia
  • Ashish Kyal
  • Premal Parekh
  • Abhijit Paul
  • Jegan
  • Sivakumar Jayachadran
  • Jyoti Budhia
  • Vivek Gadodia
  • Vishal Mehta
  • Piyush Chaudhry
  • Santosh Pasi
  • Gomathi Shankar
  • Courses:​
  • Options Trading
  • Dow Theory
  • Momentum Trading
  • Stock Investing
  • Harmonic Chart Patterns
  • Algo Trading
  • Elliot Wave Theory
  • Advanced Excel
  • Cryptocurrency
  • NSE Certification Course
  • Courses:​
  • Options Trading
  • Dow Theory
  • Momentum Trading
  • Stock Investing
  • Harmonic Chart Patterns
  • Algo Trading
  • Elliot Wave Theory
  • Advanced Excel
  • Cryptocurrency
  • NSE Certification Course
  • Webinars:
  • Bank Nifty Scalping
  • Intraday Trading Strategies
  • Options Trading Strategies
  • Options selling
  • Price Action
  • Relative Strength
  • Tax Planning
  • Options Buying
  • Growth Stocks
  • Portfolio Management
  • Risk Management
  • Renko Charts
  • Crude Oil
  • Traders Psychology
  • Moving Average
  • Multibagger Stocks
  • Free Learning Modules:
  • Intraday Trading
  • Options Scalping
  • Swing Trading
  • Financial Modelling
  • RSI Indicator
  • Bollinger Bands
  • Pricing of Futures
  • Personal Finance
  • Initial Public Offerings (IPO)
  • Value Investing
  • Technical Indicators
  • Candlesticks
  • Chart Patterns
  • Option Greeks
  • ELSS Funds
  • Banking and Insurance
  • Real Estate
  • Gold
  • Book Summaries:
  • Rich Dad Poor Dad
  • Psychology of Money
  • The Intelligent Investor
  • The Richest Man in Babylon
  • Think and Trade Like a Champion
  • Value Investing and Behavioural Finance
  • Trading in the Zone
  • Learn to Earn
  • Book Summaries:
  • Rich Dad Poor Dad
  • Psychology of Money
  • The Intelligent Investor
  • The Richest Man in Babylon
  • Think and Trade Like a Champion
  • Value Investing and Behavioural Finance
  • Trading in the Zone
  • Learn to Earn
  • Tools:
  • CAGR Calculator
  • SIP Calculator
  • eLearnOptions
  • Future Value Calculator
  • Present Value Calculator
  • Atal Pension Yojana
  • Cost of Delay Calculator
  • Become a Crorepati
  • Tools:
  • CAGR Calculator
  • SIP Calculator
  • eLearnOptions
  • Future Value Calculator
  • Present Value Calculator
  • Atal Pension Yojana
  • Cost of Delay Calculator
  • Become a Crorepati

© 2025 Elearnmarkets. All Rights Reserved

  • Visit Elearnmarkets
  • Courses
  • Webinars
  • Financial Guides
  • Get Free Counselling
  • Visit Elearnmarkets
  • Courses
  • Webinars
  • Financial Guides
  • Get Free Counselling

Download Our App

No Result
View All Result
  • Article Categories
    • Basic Finance
    • Derivatives
    • Financial Planning
    • Fundamental Analysis
    • Technical Analysis
    • ETFs & Mutual Funds
    • Marketshala
    • Miscellaneous
  • Language
    • Hindi
    • Bengali
    • English
  • Courses
  • Webinars
  • Stories
Get Free Course

© 2024 Elearnmarkets All Rights Reserved

A Handbook of Technical Analysis
To start your trading journey as a seasoned technical analyst
Download Guide For FREE
How to Spot False Dips and Trade with Confidence